Project 1 - Parsing NASA thermodynamic data
Here iam attaching the explination of the cods line by line
% NASA thermodynamic project 1\1

clear all;
close all;
clc

%reading file

NASA_file = fopen('thermo.dat','r');
fgetl(NASA_file)
A = fscanf(NASA_file,'%f',NASA_file);
A = A';
R = 8.314;
global_low_temp = A(:,1);
global_mid_temp = A(:,2);
global_high_temp = A(:,3);

fgetl(NASA_file);
fgetl(NASA_file);
fgetl(NASA_file);

% For first species

% z = fgetl(NASA_file)
% low_temp_of_monoatomic_oxygen = z(46:55)
% mid_temp_of_monoatomic_oxygen = z(56:65)
% high_temp_of_monoatomic_oxygen = z(66:75)

for i = 1 :  53
a = fgetl(NASA_file);
b = strsplit(a,' ');
species_name = (b{1});
llt = str2num(b{end-3});
lmt = str2num(b{end-1});
lht = str2num(b{end-2});
T = linspace(llt,lht,500);
posdot = strfind(a,'.');

lowtemp = a(posdot(1)-3:posdot(1)+3);
lowtemp = str2num(lowtemp);

% midtemp
% hightemp

c1 = fgetl(NASA_file);

posE = strfind(c1,'E');
a1 = c1(1:posE(1)+3);
a1 = str2num(a1);
a2 = c1(16:posE(2)+3);
a2 = str2num(a2);
a3 = c1(31:posE(3)+3);
a3 = str2num(a3);
a4 = c1(46:posE(4)+3);
a4 = str2num(a4);
a5 = c1(61:posE(5)+3);
a5 = str2num(a5);

c2 = fgetl(NASA_file);
posE = strfind(c1,'E');
a6 = c2(1:posE(1)+3);
a6 = str2num(a6);
a7 = c2(16:posE(2)+3);
a7 = str2num(a7);
a8 = c2(31:posE(3)+3);
a8 = str2num(a8);
a9 = c2(46:posE(4)+3);
a9 = str2num(a9);
a10 = c2(61:posE(5)+3);
a10 = str2num(a10);

c3 = fgetl(NASA_file);
posE = strfind(c3,'E');
a11 = c3(1:posE(1)+3);
a11 = str2num(a11);
a12 = c3(16:posE(2)+3);
a12 = str2num(a12);
a13 = c3(31:posE(3)+3);
a13 = str2num(a13);
a14 = c3(46:posE(4)+3);
a14 = str2num(a14);

%calling functions
cp = specific_heat(a1,a2,a3,a4,a5,a6,a7,a8,a9,a10,a11,a12,a13,a14,T,lmt,R);
H = enthalpy(a1,a2,a3,a4,a5,a6,a7,a8,a9,a10,a11,a12,a13,a14,T,lmt,R);
S = entropy(a1,a2,a3,a4,a5,a6,a7,a8,a9,a10,a11,a12,a13,a14,T,lmt,R);

mkdir('D:\NASA_CHALLENGE',species_name);  %create new folder and save plots
%plotting
figure(1)
plot(T, cp)
ylabel ('specific_heat')
xlabel ('Temp')

m1 = 'specific heat of %s';
m2 = species_name;
m3 = sprintf(m1,m2);
n1 = 'specific heat of %s';
n2 = species_name;
n3 = title(n1,n2);

figure(2)
plot(T, H)
ylabel ('Enthalpy')
xlabel ('Temp')

m4 = 'enthalpy (H) of %s';
m5 = species_name;
m6 = sprintf(m4,m5);

n4 = 'Enthalpy %s';
n5 = species_name;
n6 = title(n4,n5);

figure(3)
plot(T, S)
ylabel ('Entropy')
xlabel ('Temp')
title('Entropy_VS_Temp')
m7 = 'Entropy of %s';
m8 = species_name;
m9 = sprintf(m7,m8);

n7 = 'Entropy of %s';
n8 = species_name;
n9 = sprintf(n7,n8);

program =(['D:\NASA_CHALLENGE\',species_name]);
cd(program)

%storing file
saveas(figure(1),sprintf('%s.jpg',m3))
saveas(figure(2),sprintf('%s.jpg',m6))
saveas(figure(3),sprintf('%s.jpg',m9))
cd('C:\Users\Admin\Documents\MATLAB')   %come to original folder

[molecular_wt] = mw(species_name);
end


%function programs for molecular weight

function [molecular_wt] = mw(species_name)
elements = ['H','O','A','N','C'];
atomic_weight = [1,16,40,14,12];
molecular_wt = 0;
for i = 1 : length(species_name)
    for j = 1: length(elements)
        if strcmpi(species_name(i),elements(j))
            molecular_wt = molecular_wt + atomic_weight(j);
            pos = j;
        end
    end
    f = str2double(species_name(i));
    if f>1
        molecular_wt = molecular_wt + atomic_weight(pos)*(f-1);
    end
end
disp(molecular_wt)
end

% function code for specific heat, enthalpy and entropy


function cp = specific_heat(a1,a2,a3,a4,a5,a6,a7,a8,a9,a10,a11,a12,a13,a14,T,lmt,R)
R = 8.314;
if T<=lmt
    cp = (a7 + a8*T + a9*T.^2 + a10*T.^3 + a11*T.^4)*R;
else

     cp = (a1 + a2*T + a3*T.^2 + a4*T.^3 + a5*T.^4)*R;
end
end


function H = enthalpy(a1,a2,a3,a4,a5,a6,a7,a8,a9,a10,a11,a12,a13,a14,T,lmt,R)
R = 8.314;
if T<=lmt
     H = (a8 + (a9*T)/2 + (a10*T.^2)/3 + (a11*T.^3)/4 + (a12*T.^4)/5 + ((a13)./T))*R.*T;
    else

    H = (a1 + (a2*T)/2 + (a3*T.^2)/3 + (a4*T.^3)/4 + (a5*T.^4)/5 + ((a6)./T))*R.*T;
end
end

function S = entropy(a1,a2,a3,a4,a5,a6,a7,a8,a9,a10,a11,a12,a13,a14,T,lmt,R)
R = 8.314;
if T<=lmt
        S = (a8 *log(T) + a9* T + a10*T.^2/2 + a11*T.^3/3 + a12*T.^4/4 + a14)*R;
    else

        S = (a1 *log(T) + a2* T + a3 * T.^2/2 + a4*T.^3/3 + a5*T.^4/4 +a7)*R;


end
end
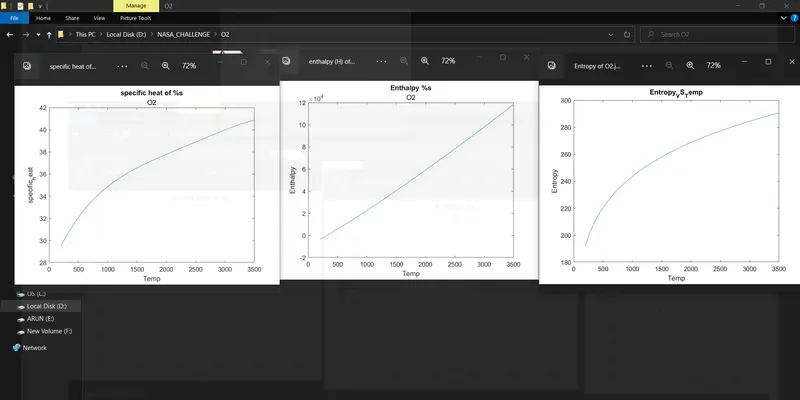
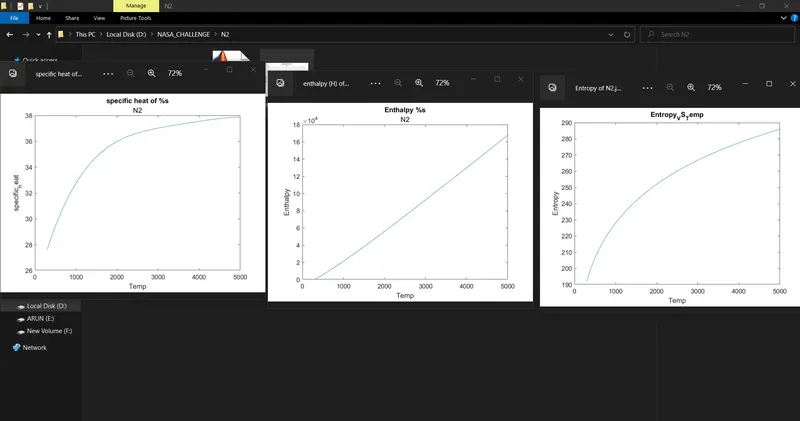
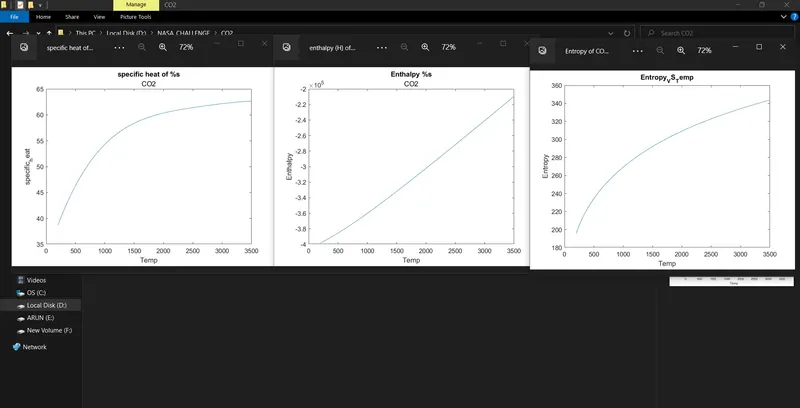
Here iam attaching the plots of o2, n2, co2.
1. First i was started with the title of the program and then igo with clear all, close all, clc to clear all the past commands and work space.
2. Then i was opend the NASA file using the fopen command. By using this command the file was read by the mat lab.
3. then by using the fgetl commnd we can extract the first line in the NASA file in this the extracted line was in a string type by using the string2num command the string value would be changed into variable.
4. Then the nasa file was saved in a variable A by using the fscanf command using the format specifiers in the program which is in a an rray of 1x3 then it was seperated by the names as global high temp, global mid temp, global high temp.
5. fgetl(NASA_file) execute the commands three times to skip the three comments line
6. And then the next time that command is set to as a variable a and then i executing the for loop.
7. In for loop i=53 ittrations because of the 53 species
8. here the species names were stored in a variable called 'a' and then the variable which is splitted using the command strsplit which is used to split the line usin the spce in that line and extract the local middle high and low temp.
9. After extracting all the temp values and stored in a variable called lmt,lht,llt.
10. Then i was extracted the 14 constanants using the strsplit by using the letter E to split.
11. After extracting the species constanant to the string then it should be converted as numbers by using the command str2num.
12. then i wrote a function command to find the specific heat, enthalpy and entropy.
13. In that function command i had been introduced a if statement for the low temperature second seven constanants is to substitute the T values for the equation and the first seven constnants is for the low temperature constanants. By following the same step i had been wrote function for the both entopy and enthalpy.
14. And i have ploted the cp vs temp, h vs temp, s vs temp.
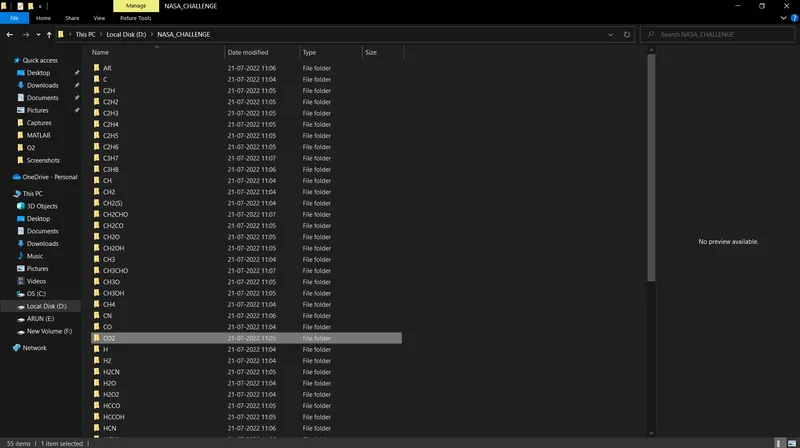
15. Then the plotted graph is to stored in a particular folder. by using the mk directory we could choose the folder wher we want to store and using the change directory command is to store the figures in the certain folder which will be named as the specific species names.
16. After that I used the saveas command to save the figure in the certain location.
17. Then iam going to find the molecular weight.
18. In that i was written a function command to find the molecular weight. In that i have specifed the (H,N,O,A,C) as the main elements and it's atomic weight was given in that after i have introduced the for loop inside the function in that i have entered the i vale as the species names . in this which propably give all the molecular weight for the remaining 53 species. Then the if statement is used to compare the string by using the string comparission command. Then the command is passed to the double elements.
19. And at last the Molecular Weight was displayed in the command window.
20. The for loop- is got end. the progaram was done