Project 1 - Parsing NASA thermodynamic data

Plots for o2
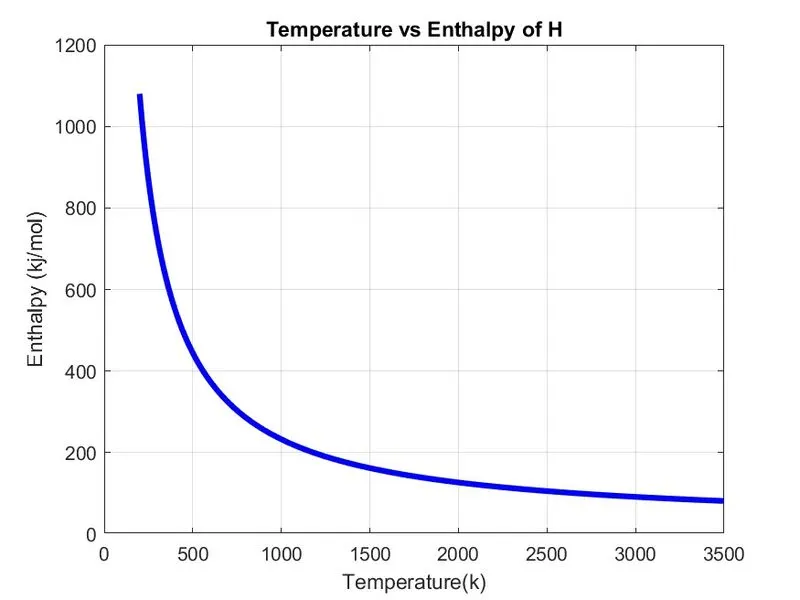
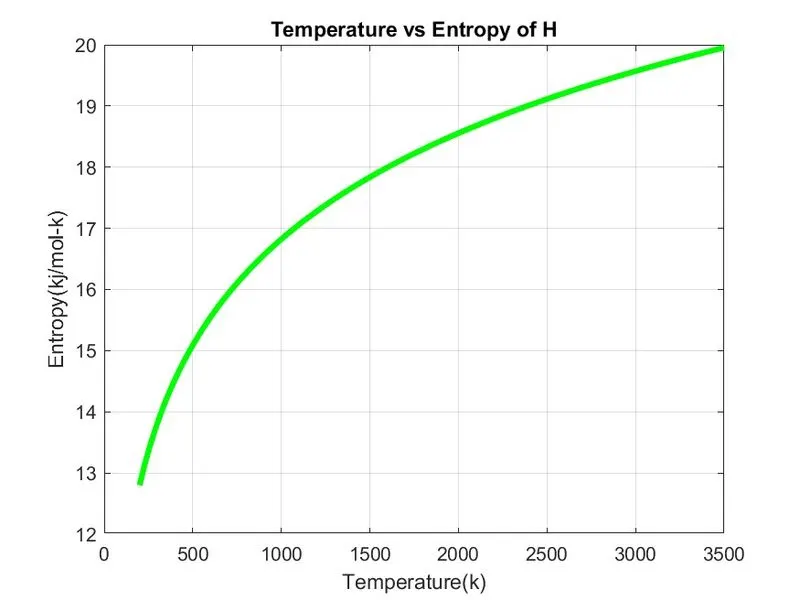
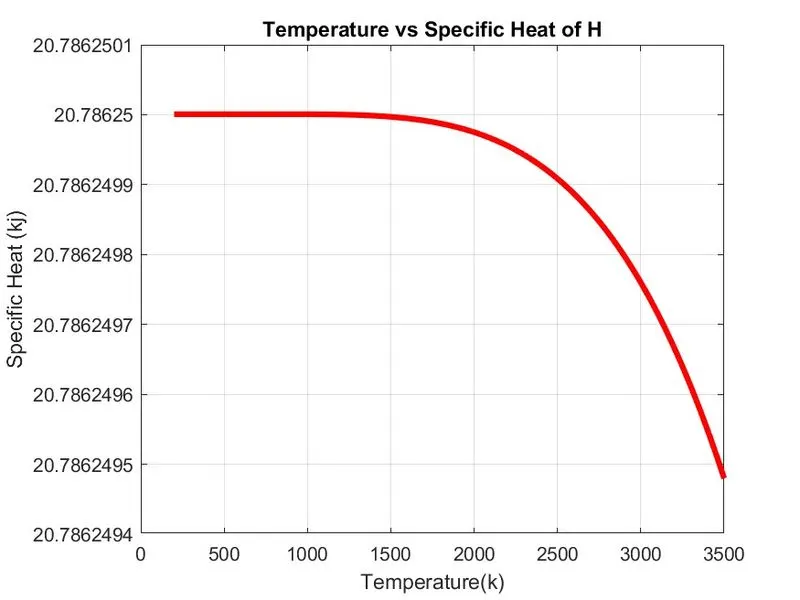
Molecular Weight of O2 is 32
Plots for n2
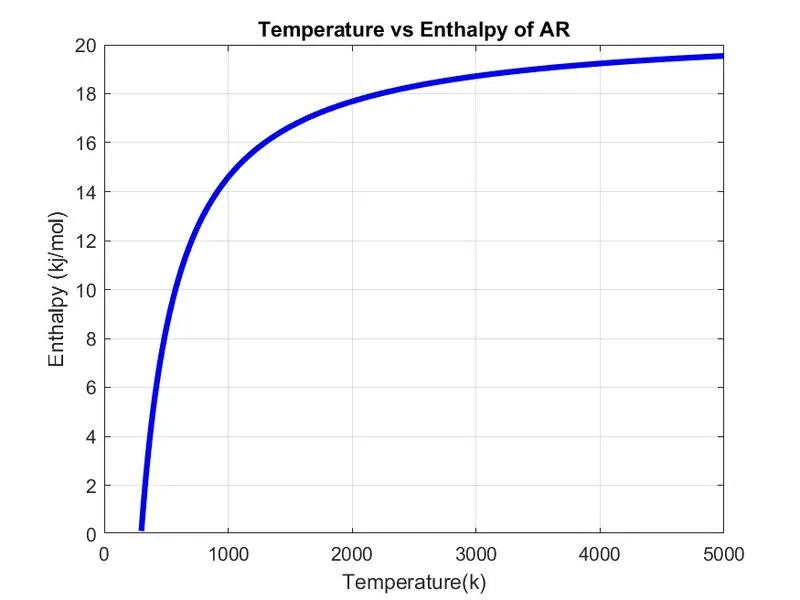
Molecular Weight of N2 is 28
Plots of Co2
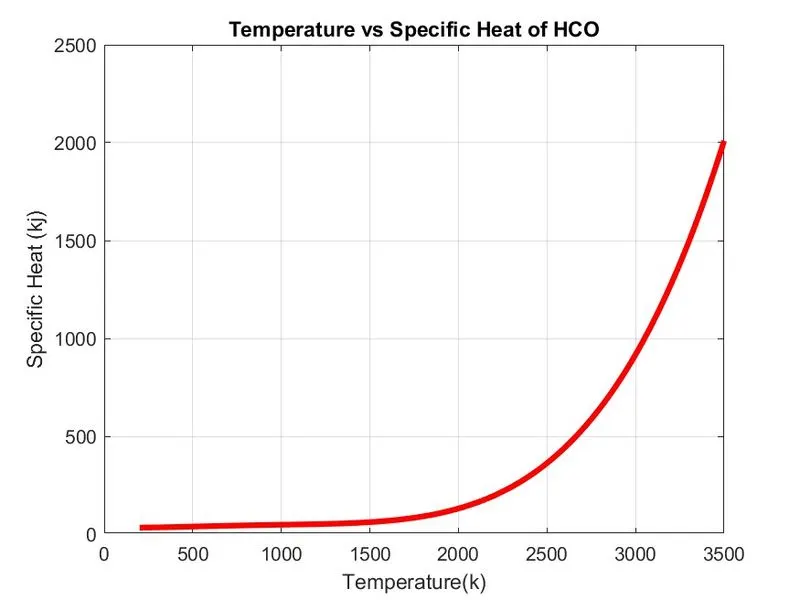
Molecular Weight of CO2 is 44
Program with explaination
clear all
close all
clc

% Reading the NASA thermodynamic
f1 =fopen('THERMO.dat');

for m = 1:5
    comment_line = fgetl(f1);
end

% Universal Gas constant R(j/mol-k)
R = 8.3145;

%reading all specis individual
for j = 1:53
    tline = fgetl(f1);
    A = strsplit(tline,' ');
    species_name = (A{1});

    %Reading Local Temperature for each species
    local_low_temp = str2double(A{end-3});
    local_high_temp = str2double(A{end-2});
    local_mid_temp = str2double(A{end-1});

    % Reading 1st line of Temperature value
    tline = fgetl(f1);
    a=strfind(tline,'E');
    a1 = tline(1:a(1)+3);
    a1=str2double(a1);
    a2=tline(a(1)+4:a(2)+3);
    a2=str2double(a2);
    a3=tline(a(2)+4:a(3)+3);
    a3=str2double(a3);
    a4=tline(a(3)+4:a(4)+3);
    a4=str2double(a4);
    a5=tline(a(4)+4:a(5)+3);
    a5=str2double(a5);
    tline = fgetl(f1);
    a=strfind(tline,'E');
    a6 = tline(1:a(1)+3);
    a6=str2double(a6);
    a7=tline(a(1)+4:a(2)+3);
    a7=str2double(a7);
    a8=tline(a(2)+4:a(3)+3);
    a8=str2double(a8);
    a9=tline(a(3)+4:a(4)+3);
    a9=str2double(a9);
    a10=tline(a(4)+4:a(5)+3);
    a10=str2double(a10);
    tline = fgetl(f1);
    a=strfind(tline,'E');
    a11 = tline(1:a(1)+3);
    a11=str2double(a11);
    a12=tline(a(1)+4:a(2)+3);
    a12=str2double(a12);
    a13=tline(a(2)+4:a(3)+3);
    a13=str2double(a13);
    a14=tline(a(3)+4:a(4)+3);
    a14=str2double(a14);

    T = linspace(local_low_temp,local_high_temp,500);
    %specific heat, Enthalpy & Entropy Calculation
    if T>1000
        Cp = (a1 + a2.*T+ a3.*T^2 + a4.*T^3 + a5.*T^4)*R;
        H = (a1 + (a2*T)./2 + (a3*T^2)./3 + (a4*T^3)./4 + (a5*T^4)./5 + a6/T)*R;
        S = a1.*log(T) + a2.*T + (a3*T^2)./2 + (a4*T^3)./3 + (a5*T^4)./4 + a7;
    else
        Cp = (a8 + a9*T + a10*T.^2 + a11*T.^3 + a12*T.^4)*R;
        H = (a8 + ((a9*T)/2) + ((a10*(T).^2)/3) + ((a11*(T).^3)/4) + ((a12*(T).^4)/5) + (a13./T))*R;
        S = a8.*log(T) + a9.*T + (a10*T.^2)/2 + (a11*T.^3)/3 + (a12*T.^4)/4 + a14;
    end
       %defining atoms and their respective atomic weights
    Atoms = ['O','H','C','N','Ar'];
    Atomic_weight = [16,1,12,14,40];
    M = 0;
    %Finding Moleculer weight
    for k = 1:length(species_name)
        for l = 1: length(Atoms)
            if strcmp(species_name(k),Atoms(l))
            M = M + Atomic_weight(l);
            place = l;
            end
        end
        n = str2double(species_name(k));
        if (n>1)
            M = M + Atomic_weight(place)*(n-1);
        end
    end
    fprintf('molecular Weight of %s  ',species_name);
    fprintf('%f',M);
    disp(' ')

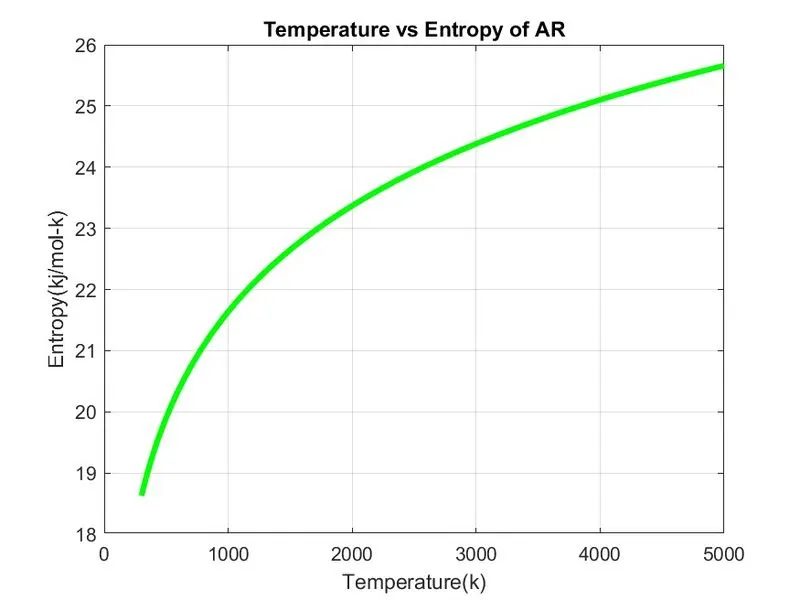
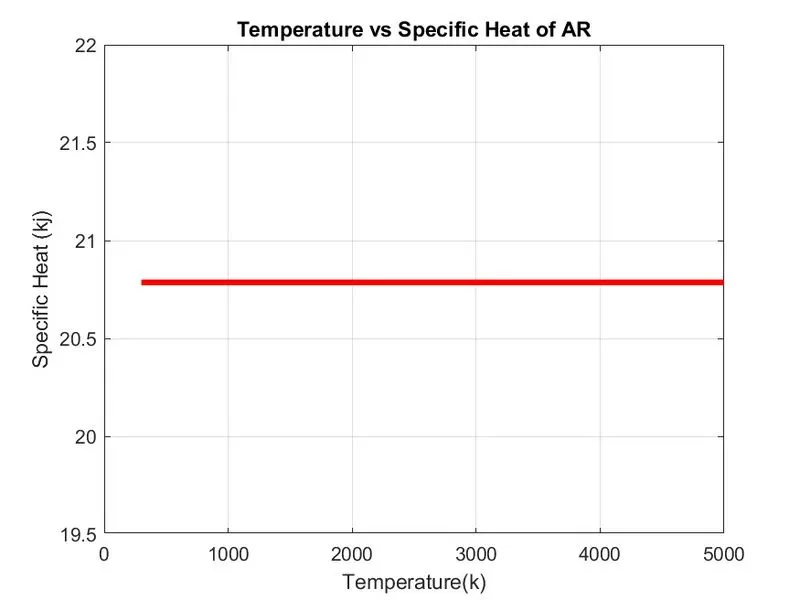
   figure(1)
   plot(T,Cp,'linewidth',3, 'Color','r');
   xlabel('Temperature(k)');
   ylabel('Specific Heat (kj)');
   title(sprintf('Temperature vs Specific Heat of %s', species_name))
   grid on
   saveas(figure(1),'Specific Heat.jpg')
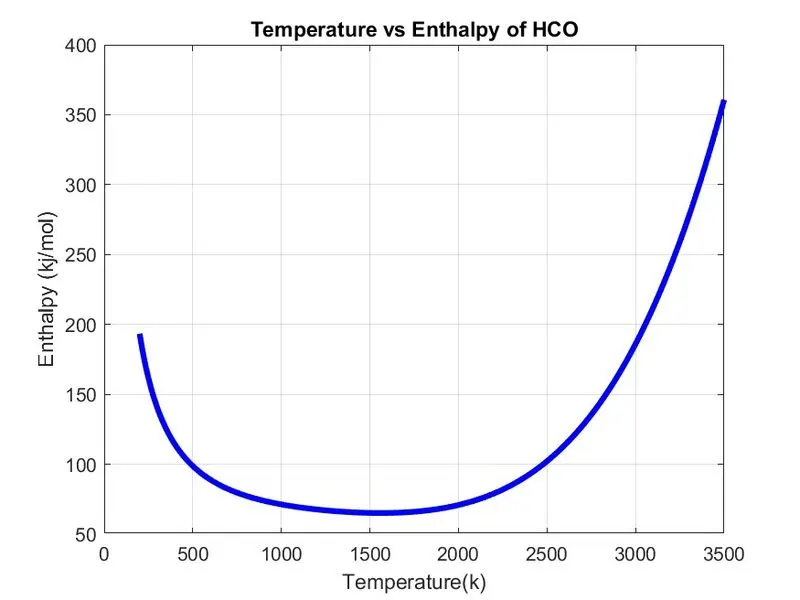
   figure(2)
   plot(T,H,'linewidth',3, 'Color','b')
   xlabel('Temperature(k)')
   ylabel('Enthalpy (kj/mol)')
   title(sprintf('Temperature vs Enthalpy of %s', species_name))
   grid on
   saveas(figure(2),'Enthalpy.jpg')
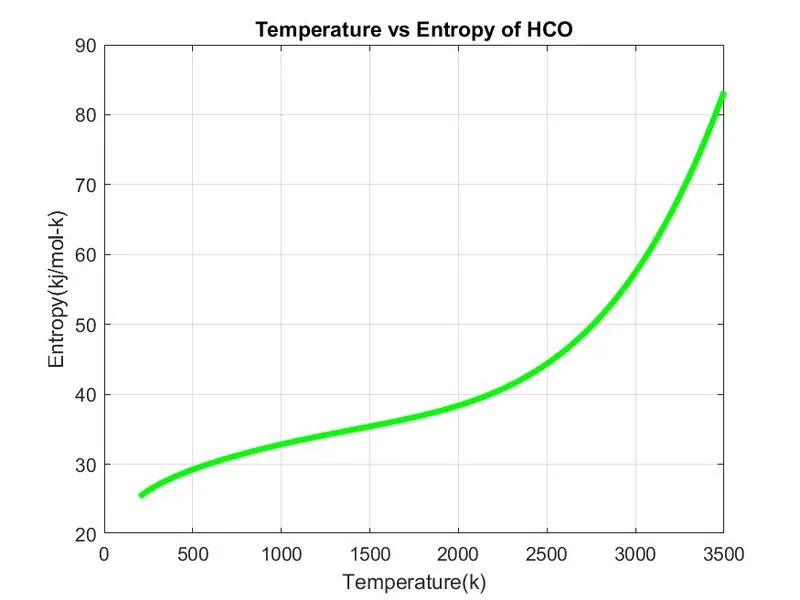
   figure(3)
   plot(T,S,'linewidth',3, 'Color','g')
   xlabel('Temperature(k)')
   ylabel('Entropy(kj/mol-k)')
   title(sprintf('Temperature vs Entropy of %s', species_name))
   grid on
   saveas(figure(3),'Entropy.jpg')
   cd('C:\Users\nandh\OneDrive\Documents\MATLAB\file_pasing');
   mkdir(species_name);
   cd(species_name);


   M_file = fopen('Molecular Weight.txt','w');
   fprintf(M_file,'Molecular Weight of %s is %d', species_name,M);
   fclose(M_file);


end