Project 1 - Parsing NASA thermodynamic data
Aim:-Write a MATLAB code that extracts the 14 coefficients and calculates the enthalpy, entropy, and specific heats for all the species in the data file. You will be reading this file NASA thermodynamic data
Objective:-
Calculate the molecular weight of each species and display it in the command window.
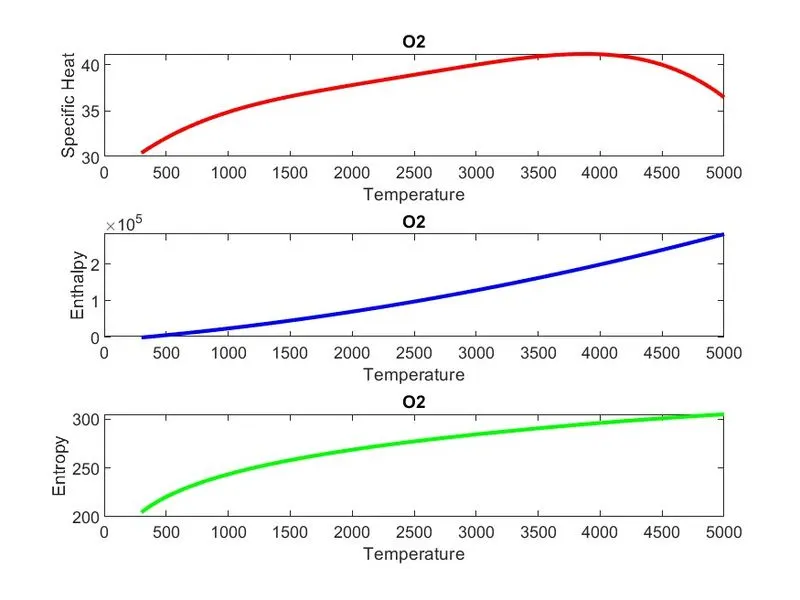
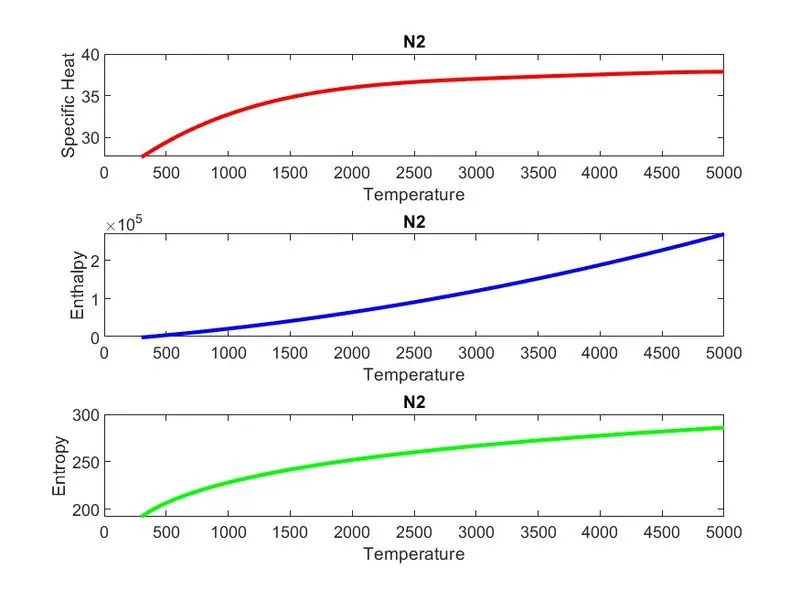
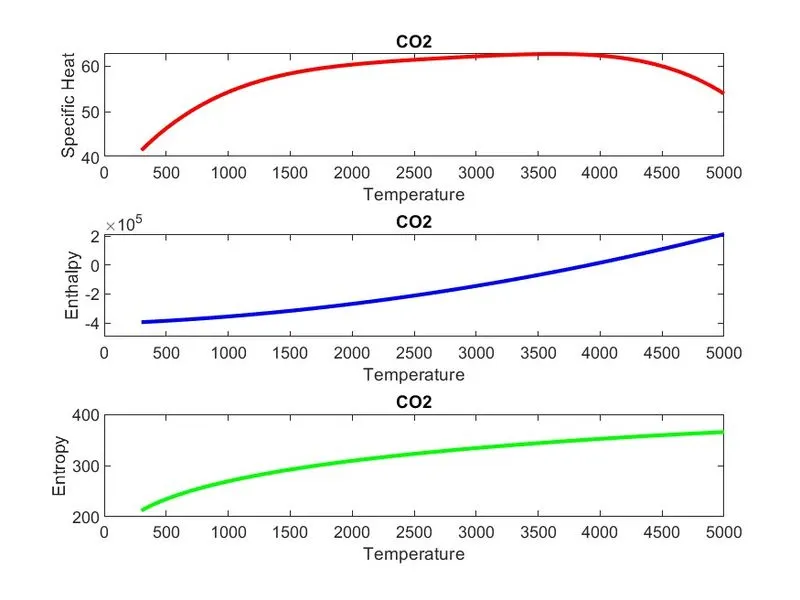
Plot the Cp, Enthalpy, and Entropy for the local temperature range (low temperature: high temperature) specific for each species
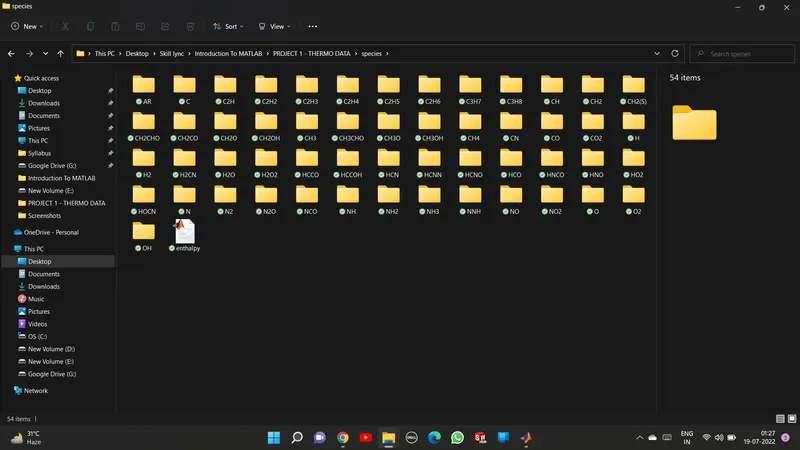
Screenshot of the window where all the folders are saved.
Plots for o2, N2, and Co2 species.
Theory:-
File parsing is defined as how we can read information from a particular data file or text file. And how we can use that information in a program. File parsing helps us to read the data from any external file. It also helps us to write any particular file in the data stored on our computer.
In this Project, we are extracting the coefficient of the polynomial stored in the NASA thermodynamic file. By using some inbuilt MATLAB function we successfully find some thermodynamic properties like specific heat, enthalpy, and entropy with the help of that thermodynamic data.
cp is the specific heat
R is Gas constant
T temperature
S is Entropy
ln meaning log
a1 a2 a3 ... These are coefficients of the polynomial.
% Write a MATLAB code that extracts the 14 coefficients and calculates the enthalpy, entropy, and specific heats for all the species in the data file. You will be reading this file NASA thermodynamic data

clear all

close all

clc

% R is Universal Gas Constant and its value is

R=8.314;  %J/mol K

% Using the fopen command we are going to read the data from the file THERMO.dat

f1=fopen('THERMO.dat','r');

% Using the fgetl command we are ignoring the first three lines of the file and store the global temperature values of file"THERMO.dat"

l1=fgetl(f1);

l2=fgetl(f1);

% Using the strsplit command we are splitting the string into three cell array

t=strsplit(l2);

% Using the str2num command we are converting the string into a number by splitting the global temperature into low, medium, and high temperature

global_low_temp=str2num(t{2});

global_medium_temp=str2num(t{3});

global_high_temp=str2num(t{4});

% Using the linspace command we are dividing the minimum and temperature data into 400 parts

temp=linspace(global_low_temp,global_high_temp,400);

% Using For loop we are ignoring the first three lines and starting the loop for the next 53 species.

for i=1:3

    fgetl(f1);
end

for i=1:53

    %first reading the line information of species

    line_1=fgetl(f1);

    A=strsplit(line_1, ' ');

    species_name=(A{1});

    % Now Extracting the 14 ( HIGH & LOW ) Temperature

    tline_2=fgetl(f1);

    tline_3=fgetl(f1);

    tline_4=fgetl(f1); % Reading the line from 2 to 4 for extracting the coefficient.

    % Extracting the Coefficient of string using finding the location of E with the help of string

    a=strfind(tline_2,'E');

    b=strfind(tline_3,'E');

    c=strfind(tline_4,'E');

    % Extracting the 7 HIGH temperature a1, a2, a3, a4, a5, a6, a7 using str2num command

    a1=str2num(tline_2(1:a(1)+3));

    a2=str2num(tline_2(a(1)+4:a(2)+3));

    a3=str2num(tline_2(a(2)+4:a(3)+3));

    a4=str2num(tline_2(a(3)+4:a(4)+3));

    a5=str2num(tline_2(a(4)+4:a(5)+3));

    a6=str2num(tline_3(1:b(1)+3));

    a7=str2num(tline_3(b(1)+4:b(2)+3));

    % Extracting the 7 LOW-temperature b1, b2, b3, b4, b5, b6, b7 using the str2num command

    b1=str2num(tline_3(b(2)+4:b(3)+3));

    b2=str2num(tline_3(b(3)+4:b(4)+3));

    b3=str2num(tline_3(b(4)+4:b(5)+3));

    b4=str2num(tline_4(1:c(1)+3));

    b5=str2num(tline_4(c(1)+4:c(2)+3));

    b6=str2num(tline_4(c(2)+4:c(3)+3));

    b7=str2num(tline_4(c(3)+4:c(4)+3));

    % Making new subfolder species to save the plots of individual species

    mkdir(['C:\Users\Dell\OneDrive\Desktop\Skill lync\Introduction To MATLAB\PROJECT 1 - THERMO DATA\species\',species_name]);

    %calculating Specific heat by calling function

    c_p=specific_heat(a1,a2,a3,a4,a5,b1,b2,b3,b4,b5,R,temp,global_medium_temp);

    %calculating enthalpy by calling function

    h=enthalpy(a1,a2,a3,a4,a5,a6,b1,b2,b3,b4,b5,b6,R,temp,global_medium_temp);

    %calculating entropy by calling function

    S=entropy(a1,a2,a3,a4,a5,a7,b1,b2,b3,b4,b5,b7,R,temp,global_medium_temp);

    % Plotting the values of specific heat, enthalpy, and entropy vs Temperature Graphs.

    figure(1)

    % Specific Heat vs Temperature

    subplot(3,1,1)

    plot(temp,c_p,'LineWidth',2,'Color','r')

    title(species_name)

    xlabel("Temperature")

    ylabel("Specific Heat")

    % Enthalpy vs Temperature

    subplot(3,1,2)

    plot(temp,h,'LineWidth',2,'Color','b')

    title(species_name)

    xlabel("Temperature")

    ylabel("Enthalpy")

    % Entropy vs Temperature

    subplot(3,1,3)

    plot(temp,S,'LineWidth',2,'Color','g')

    title(species_name)

    xlabel("Temperature")

    ylabel("Entropy")

   %Saving the jpg file of plots for each species in the individual species folder

  directory = (['C:\Users\Dell\OneDrive\Desktop\Skill lync\Introduction To MATLAB\PROJECT 1 - THERMO DATA\species\',species_name]);

  %saving old path to old_folder

  old_folder = cd(directory);

  %saving the plot in the species folder

  saveas(1,'output1.jpg');

  %changing current directory back to the original folder

  cd(old_folder);

 %Calculation For Molecular Mass Of Species

Atom = ['C','H','O','N','A']; % Create Array To save Species Character into a Variable

Atom_wt = [12.01,1.0079,16,14.0067,39.95]; % Create Array To save Atomic Weight into a Variable

Mol_mass = 0;

% Nested For Loop For Multiple Iteration

for m = 1:length(species_name)

    for n = 1:length(Atom_wt)

       if strcmp(species_name(m),Atom(n));

          Mol_mass = Mol_mass + Atom_wt(n);

        x = n;

       end

    end

    z = str2double(species_name(m));  % To Convert Species Sting Value Into Number

    if z > 1

        % Calculate Moecular Weight

        Mol_mass = Mol_mass + (Atom_wt(x)*(z-1));

    end

end
% Print The Floating Value Of Molecular Mass

fprintf('Molecular mass of %s is = %f\ n',species_name,Mol_mass)

end

% closing the file f1

fclose(f1)
Code Explanation:-
- First I used the basic commands like clear all, close all, and clc for clearing the temporary outputs
- After that, I open the file THERMO.DAT with the help of fopen MATLAB inbuilt function
- With the help of getl, we ignore the first three comments of the file.
- With the help of for loop, I execute the whole code of 53 different species
- For each specific heat, enthalpy, and entropy we plot the graphs and saved them into the PC by the mkdir command
- After that, with the help of for loop, we successfully get the molecular weight of the species.
- And finally, we closed the file f1. with the help of the close command.
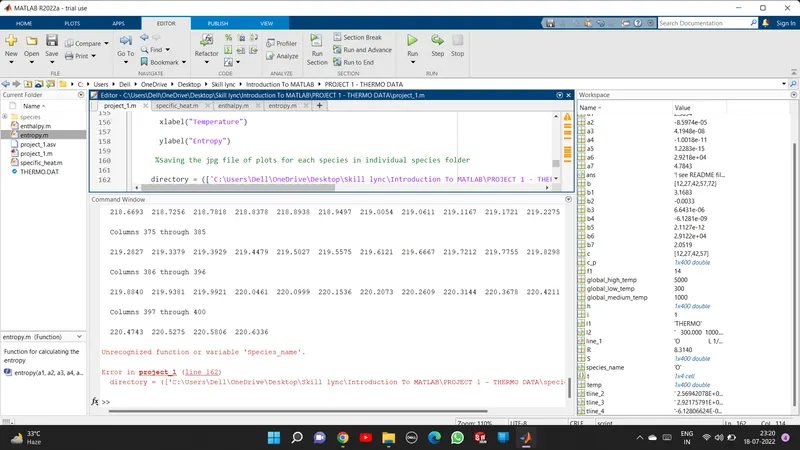
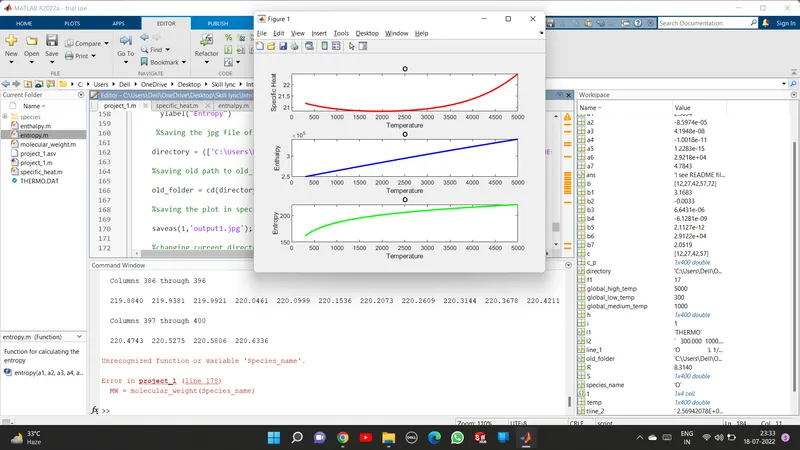
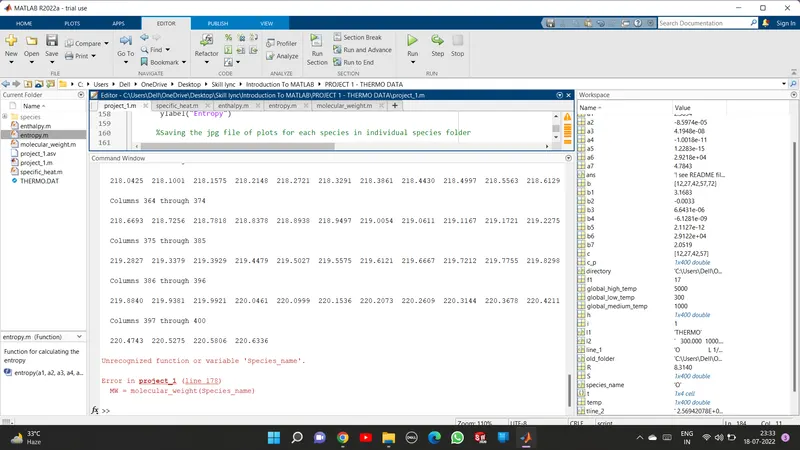
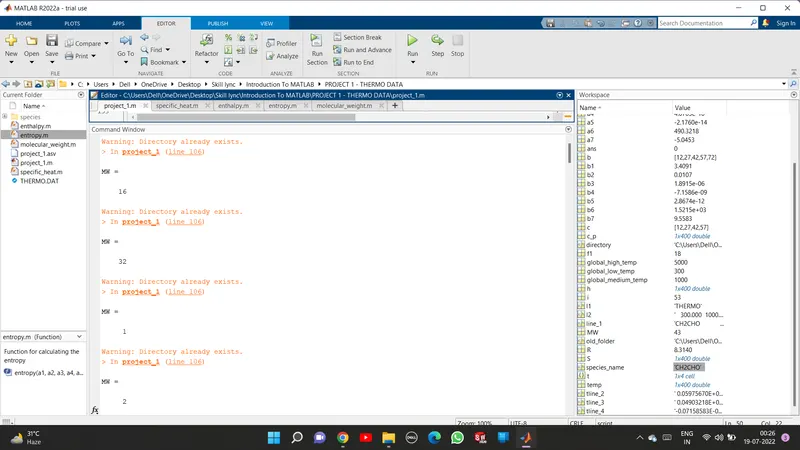
Error:-
I faced some errors while doing this Project these are as follows:
RESULT:-
Plotting the graph in-between Specific heat Vs temperature, Enthalpy Vs Temperature, and Entropy Vs Temperature
For O2, N2, and CO2.
Screenshot for all 53 species plot diagrams.
Conclusion:-
finally, we extracted the values of the coefficient from the NASA thermodynamic data and used them in the code to plot the different graphs between specific heat, enthalpy, and entropy vs Temperature. Also, we find out the molecular weight of all 53 species.