Project 1 - Parsing NASA thermodynamic data
Objective:
To write a program in MatLab to parse the NASA thermodynamic data file and then calculate the thermodynamic properties of various gas species.
Parsing:
The Input Parser provides a consistent way to validate and assign defaults to inputs, improving the robustness and maintainability of your code. To validate the inputs, you can take advantage of existing MATLAB functions or write your own validation routines.
Equation:
Cp/R = a1 + a2 T + a3 T^2 + a4 T^3 + a5 T^4
H/RT = a1 + a2 T/2 + a3 T^2/3 + a4 T^3/4 + a5 T^4/5 + a6/T
S/R = a1 1nT + a2 T + a3 T^2 /2 + a4 T^3/3 + a5 T^4/4 + a7
Here;
- Cp=specific heat
- R =molar gas constant
- T=temperature
- S=Entropy
- H=Enthalpy
- a=coefficients
Specific heat function code:
function Cp = Specific_heat(a1,a2,a3,a4,a5,a8,a9,a10,a11,a12,T,R,global_midtemp)

%calculating specific_heat for higher and lower temperature respectively
if(T>= global_midtemp)
    Cp=R*(a1+(a2*T)+(a3*(T).^2)+(a4*(T).^3)+(a5*(T).^4));
else
    Cp=R*(a8+(a9*T)+(a10*(T).^2)+(a11*(T).^3)+(a12*(T).^4));
end
end
Enthalpy function code:
function H = Enthalpy(a1,a2,a3,a4,a5,a6,a8,a9,a10,a11,a12,a13,T,R,global_midtemp)

%calculating enthalpy for higher and lower temperature respectively
if(T>=global_midtemp)

    H=R*((a1*T)+((a2*(T).^2)/2)+((a3*(T).^3)/3)+((a4*(T).^4)/4)+((a5*(T).^5)/5)+a6);

else
    H=R*((a8*T)+((a9*(T).^2)/2)+((a10*(T).^3)/3)+((a11*(T).^4)/4)+((a12*(T).^5)/5)+a13);
end
end
Entropy function code:
function S=Entropy(a1,a2,a3,a4,a5,a7,a8,a9,a10,a11,a12,a14,T,R,global_midtemp)

%calculating entropy for higher and lower temperature respectively
if(T>= global_midtemp)
    S=R*(a1.*log(T)+(a2*T)+((a3*(T).^2)/2)+((a4*(T).^3)/3)+((a5*(T).^4)/5)+a7);
else
    S=R*(a8.*log(T)+(a9*T)+((a10*(T).^2)/2)+((a11*(T).^3)/3)+((a12*(T).^4)/4));
end
end
wt function code:
function Molecular_weight=wt(species_name)

Elements=['H' 'C' 'O' 'N' 'A' 'S'];
Atomic_weight =[1 12 16 14 40 32];
species=upper(species_name)

Molecular_weight=0;

for i=1:length(species)
  for    j=1:length(Elements)

    if strcmp(species(i),Elements(j))

        Molecular_weight=Molecular_weight+Atomic_weight(j);
        k=j;

    else
        n=str2double(species(i));
        if (n>1)
            Molecular_weight=Molecular_weight+Atomic_weight(k)*(n-1);
            break
        end
    end
  end
end
end
Main code:
clear all
close all
clc

%R=molar gas constant
R=8.314;

%syntax to open the  file THERMO.dat
f1=fopen('THERMO.dat','r')

%To read lines
l1=fgetl(f1);
l2=fgetl(f1);
value=strsplit(l2,' ');

%To get global temperatures from file in number form
global_lowtemp=str2num(value{2})
global_midtemp=str2num(value{3})
global_hightemp=str2num(value{4})

%temperature range
T=linspace(global_lowtemp,global_hightemp,1000);

%skipping these 3 lines
l3=fgetl(f1);
l4=fgetl(f1);
l5=fgetl(f1);

%Reading species ,calcuating cp,h,s and plotting
for i=1:53
    tline=fgetl(f1);

    A=strsplit(tline,' ');
    name_of_species=(A{1});
    lowtemp= str2num(A{end-3});
    midtemp=str2num(A{end-2});
    hightemp=str2num(A{end-1});

    %Finding 7 higher coefficients and 7 lower coefficients

    tline1=fgetl(f1);
    a=findstr(tline1,'E');

    a1=tline1(1:a(1)+3);
    a1=str2num(a1);
    a2=tline1(a(1)+4:a(2)+3);
    a2=str2num(a2);
    a3=tline1(a(2)+4:a(3)+3);
    a3=str2num(a3);
    a4=tline1(a(3)+4:a(4)+3);
    a4=str2num(a4);
    a5=tline1(a(4)+4:a(5)+3);
    a5=str2num(a5);

    tline2=fgetl(f1);
    a=findstr(tline2,'E');

    a6=tline2(1:a(1)+3);
    a6=str2num(a6);
    a7=tline2(a(1)+4:a(2)+3);
    a7=str2num(a7);
    a8=tline2(a(2)+4:a(3)+3);
    a8=str2num(a8);
    a9=tline2(a(3)+4:a(4)+3);
    a9=str2num(a9);
    a10=tline2(a(4)+4:a(5)+3);
    a10=str2num(a10);


    tline3=fgetl(f1);
    a=findstr(tline3,'E');
    a11=tline3(1:a(1)+3);
    a11=str2num(a11);
    a12=tline3(a(1)+4:a(2)+3);
    a12=str2num(a12);
    a13=tline3(a(2)+4:a(3)+3);
    a13=str2num(a13);
    a14=tline3(a(3)+4:a(4)+3);
    a14=str2num(a14);

    %calculate specific heat(cp),Enthalpy(H),Entropy(S)
    Cp=Specific_heat(a1,a2,a3,a4,a5,a8,a9,a10,a11,a12,T,R,global_midtemp);
    H=Enthalpy(a1,a2,a3,a4,a5,a6,a8,a9,a10,a11,a12,a13,T,R,global_midtemp);
    S=Entropy(a1,a2,a3,a4,a5,a7,a8,a9,a10,a11,a12,a14,T,R,global_midtemp);


    %calculating molecular weight and printing it.
    Molecular_weight=wt(name_of_species);
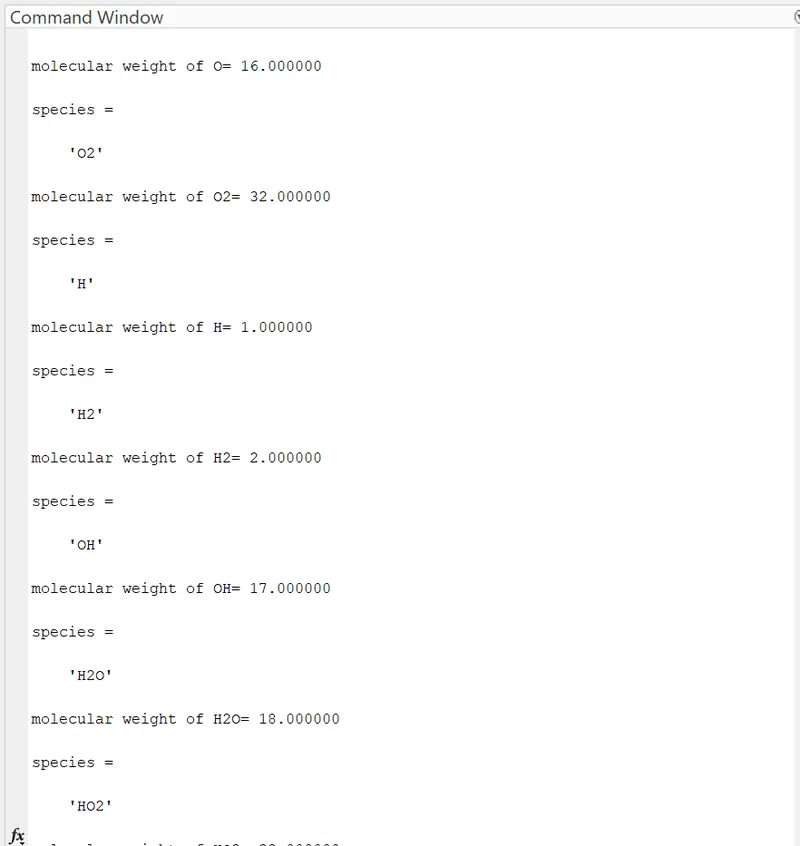
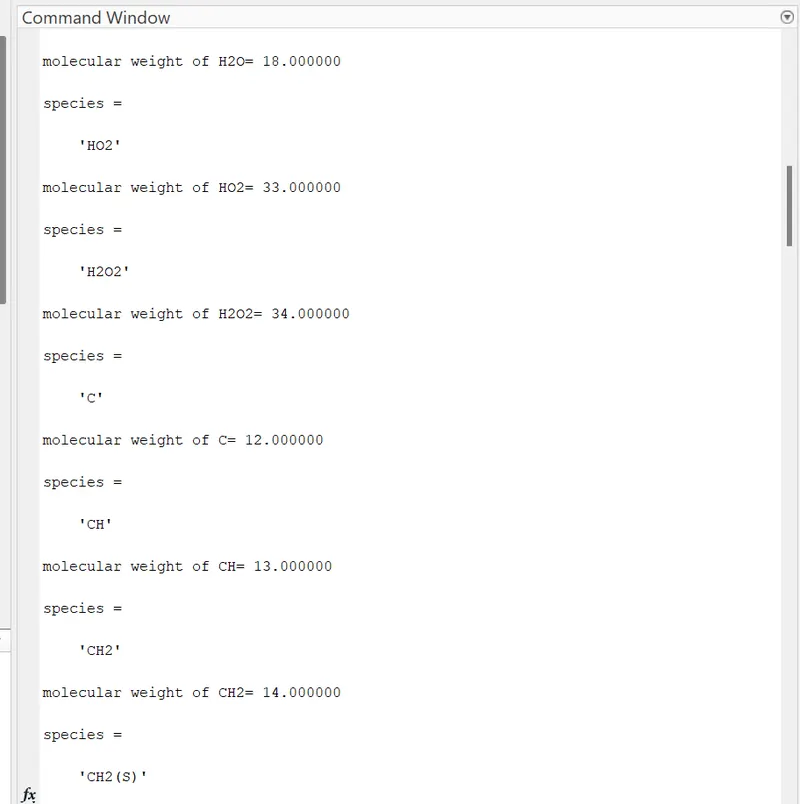
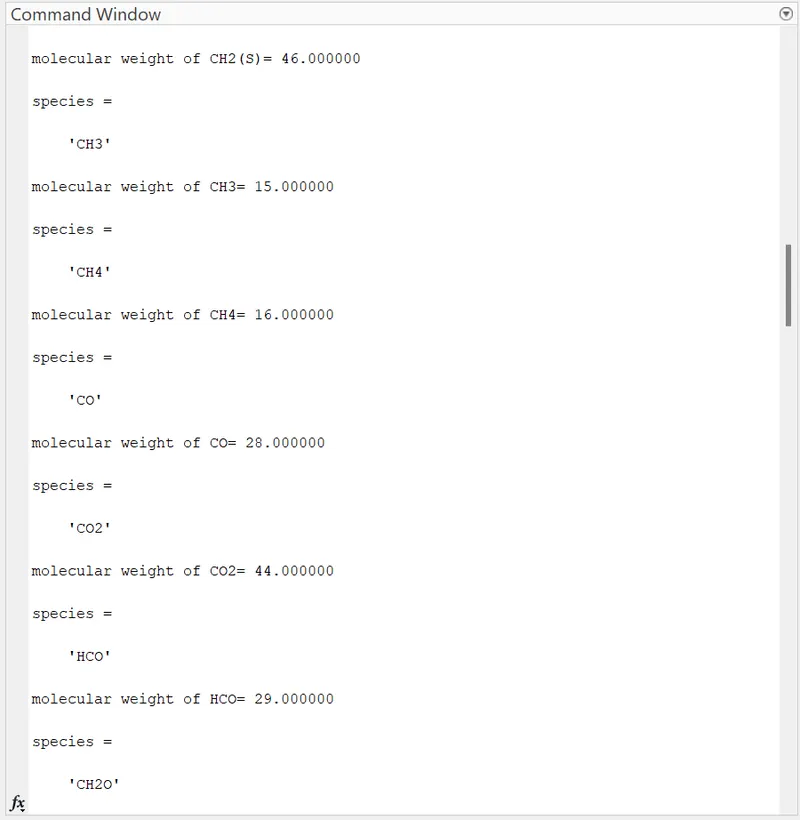
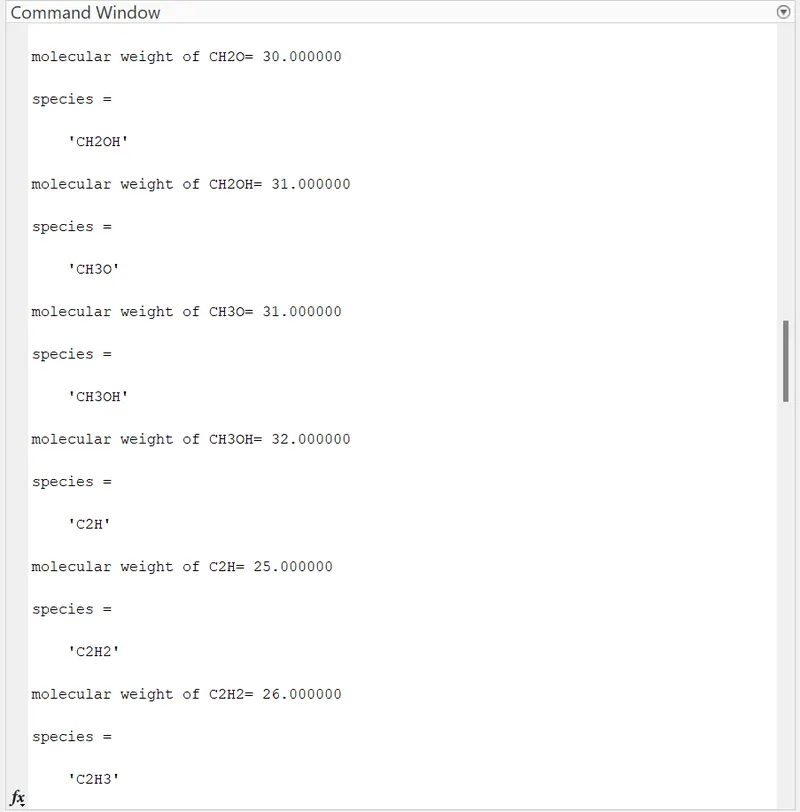
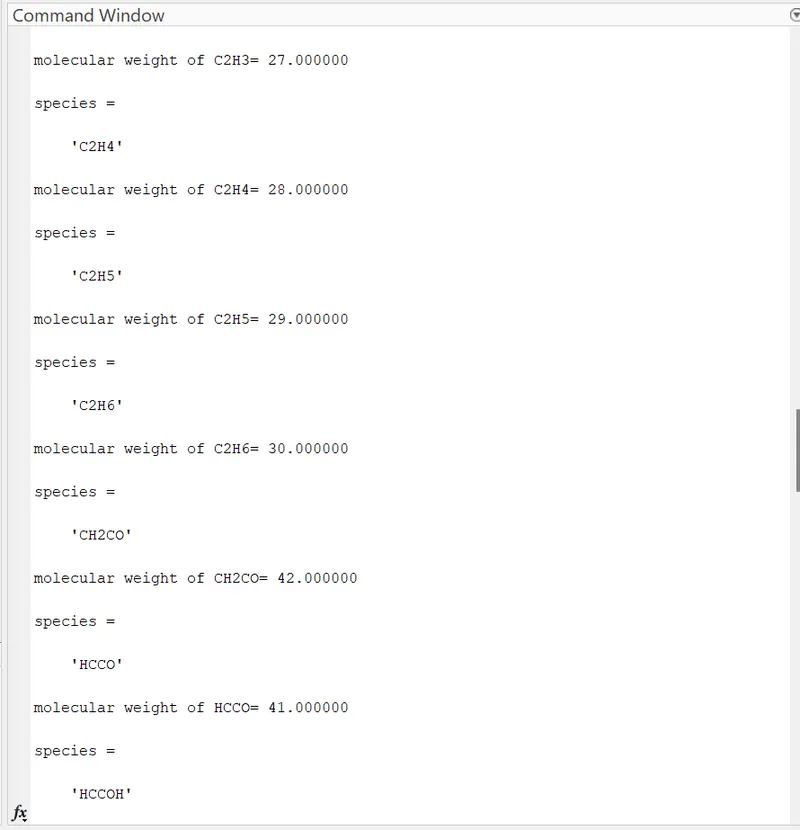
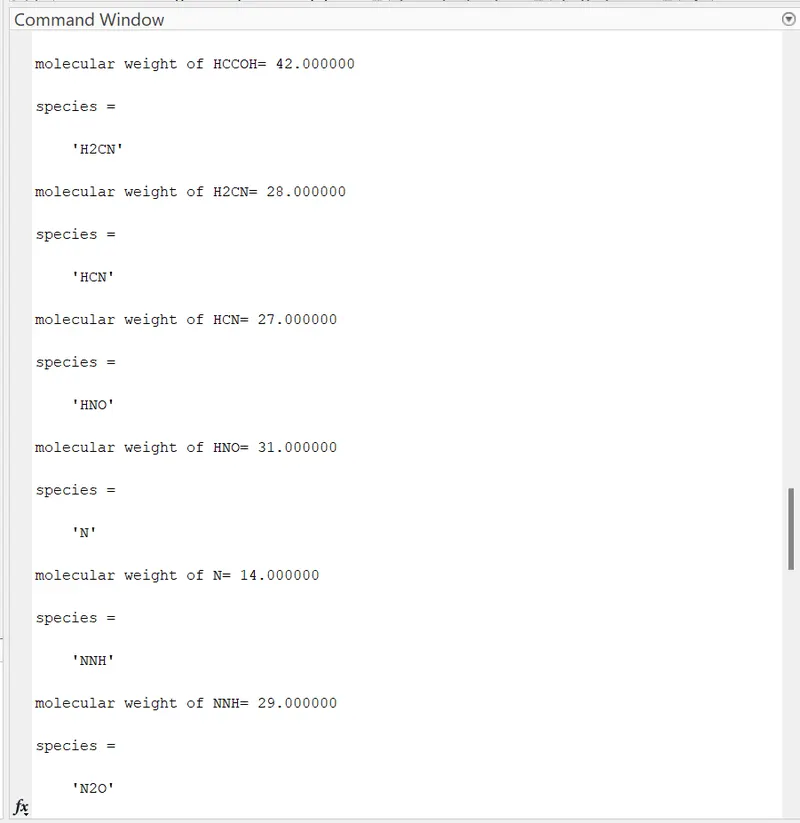
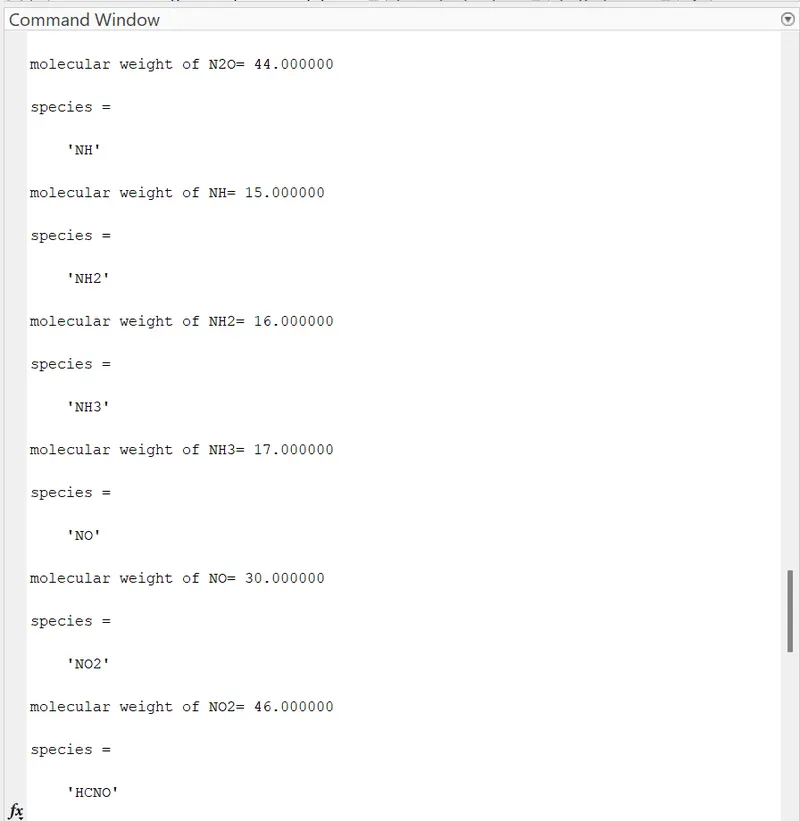
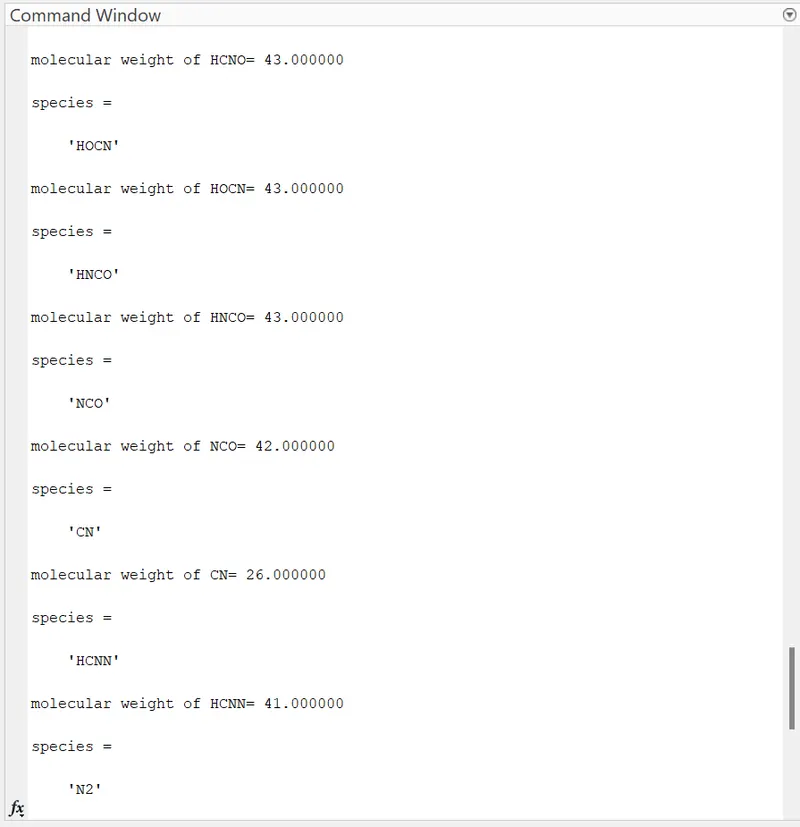
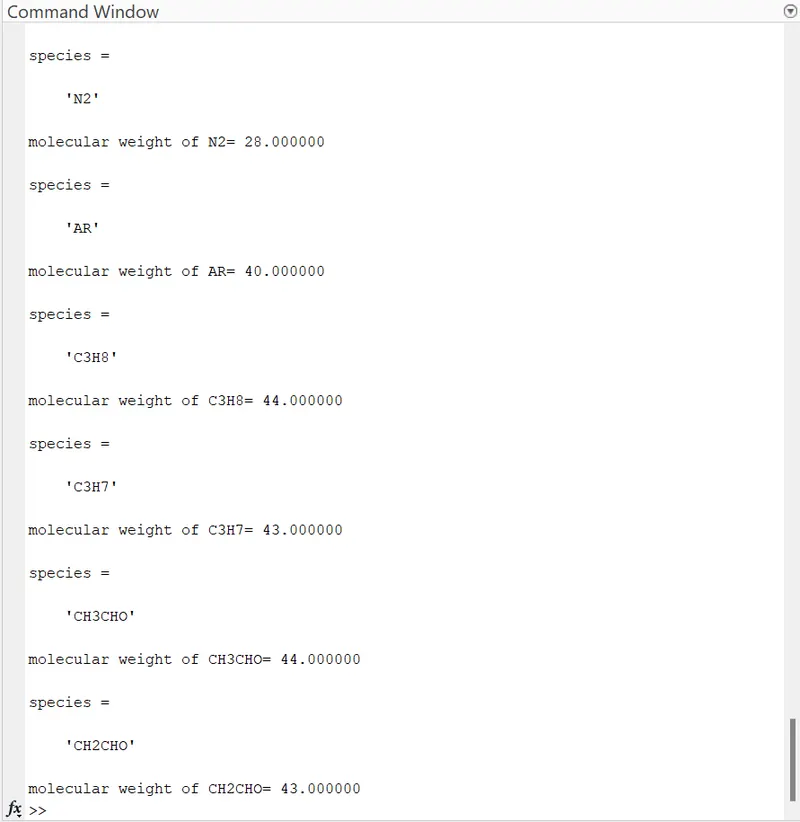
    fprintf('molecular weight of %s= %f\n',name_of_species,Molecular_weight);

%PLOTTING CP,H,T

cd('C:\Users\HP\Documents\MATLAB\nasa_files')
%creating the folder
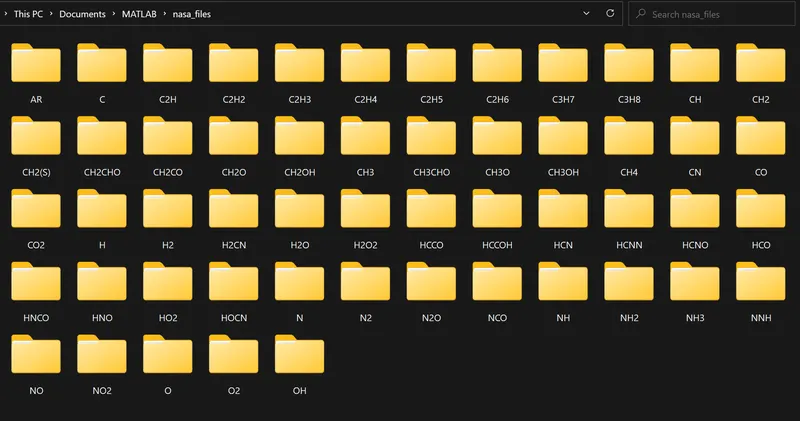
mkdir(name_of_species);
cd(name_of_species);


%plotting T vs cp
figure(1)
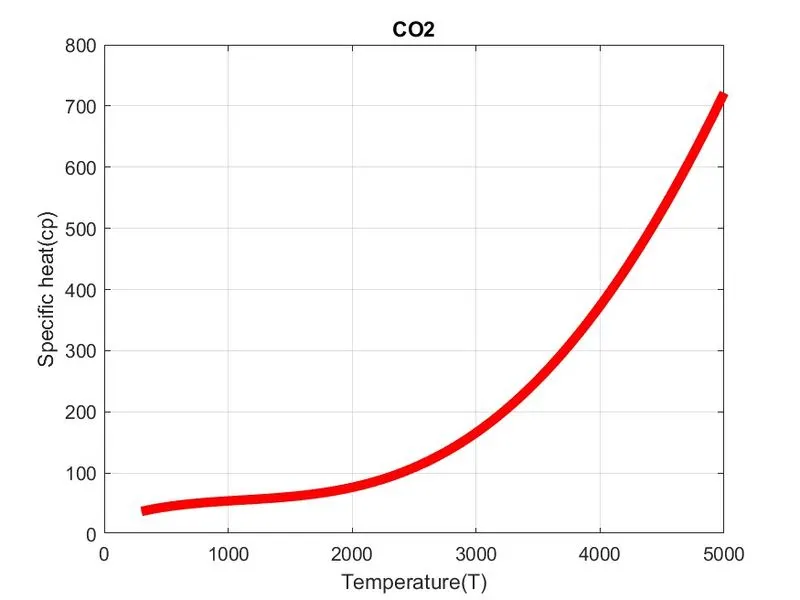
plot(T,Cp,'linewidth',5,'color','r')
xlabel('Temperature(T)')
ylabel('Specific heat(cp)')
grid on
title(name_of_species)
saveas(figure(1),'specific heat.jpg');


%Plotting T vs H
figure(2)
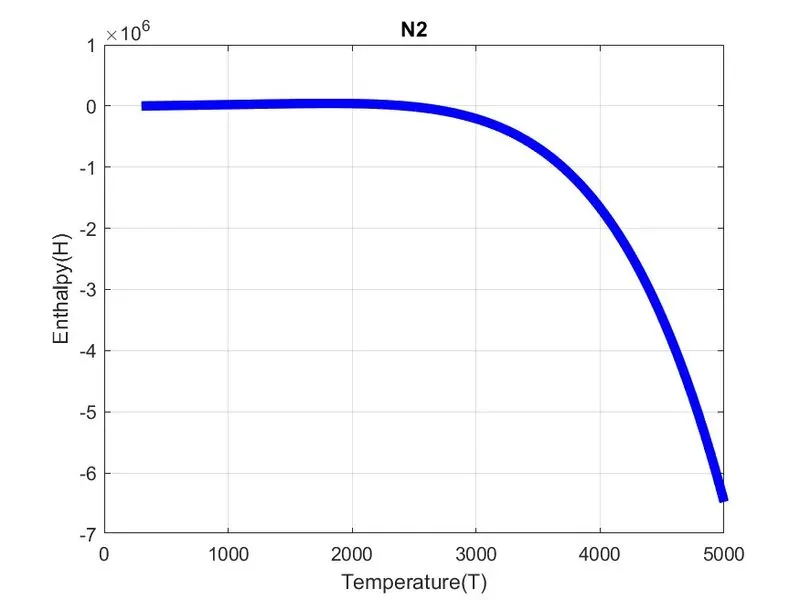
plot(T,H,'linewidth',5,'color','b')
xlabel('Temperature(T)')
ylabel('Enthalpy(H)')
grid on
title(name_of_species)
saveas(figure(2),'Enthalpy.jpg');


%Plotting T vs S
figure(3)
plot(T,S,'linewidth',5,'color','y')
xlabel('Temperature(T)')
ylabel('Entropy(S)')
grid on
title(name_of_species)
saveas(figure(3),'Entropy.jpg');

cd('C:\Users\HP\Documents\MATLAB\nasa_files')


end
Code explanation:
- We use the ‘fopen’ command to open the ‘THERMO.dat’ file.
- Here 'r' indicates the ‘read only’ command.
- We use the ‘fgetl’ command to read the data file line by line.
- Different temperature values are assigned to read the 53 gases mentioned in the data file we use for the loop then we further read the lines in the file using fgetl command.
- When all the global and local temperatures are read we call functions that are written to calculate molecular weight, specific heat(Cp), enthalpy(H), and Entropy(s).
- Calculating the value of Cp, H & S for the local temperature range. Initial values of Cp, H & S are defined as zero, Plotting the graphs & saving them in the folder.
- It is standard procedure to store the file in a specific location, by using many commands (pwd, mkdir, cd, saveas) written in this program.
Output:
Plots for O2:
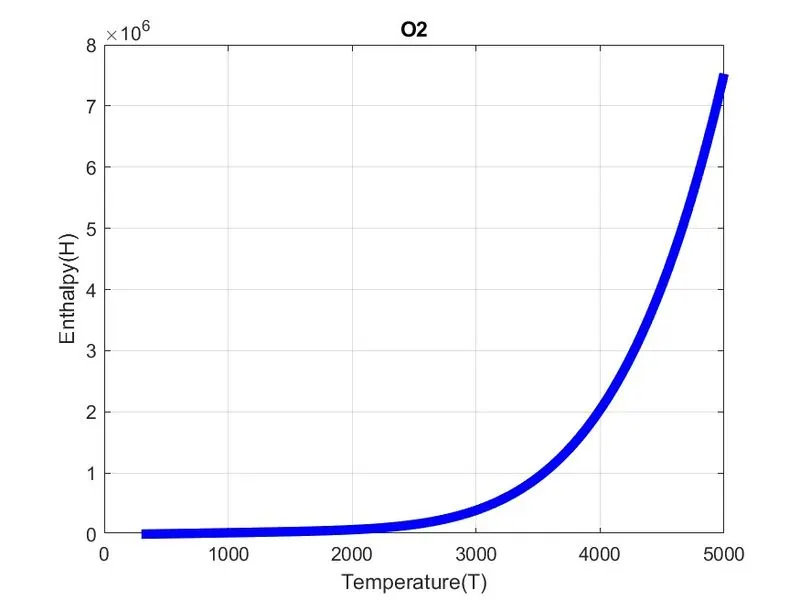
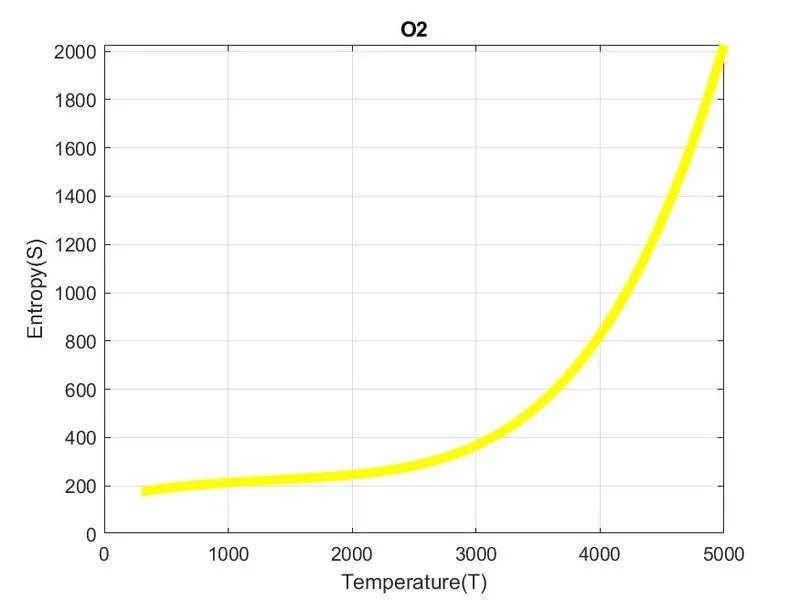
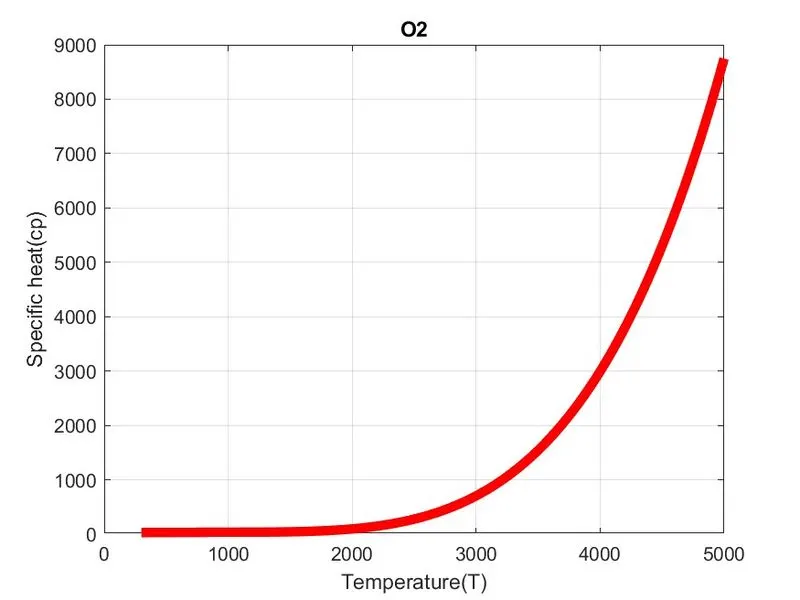
Plots for N2:
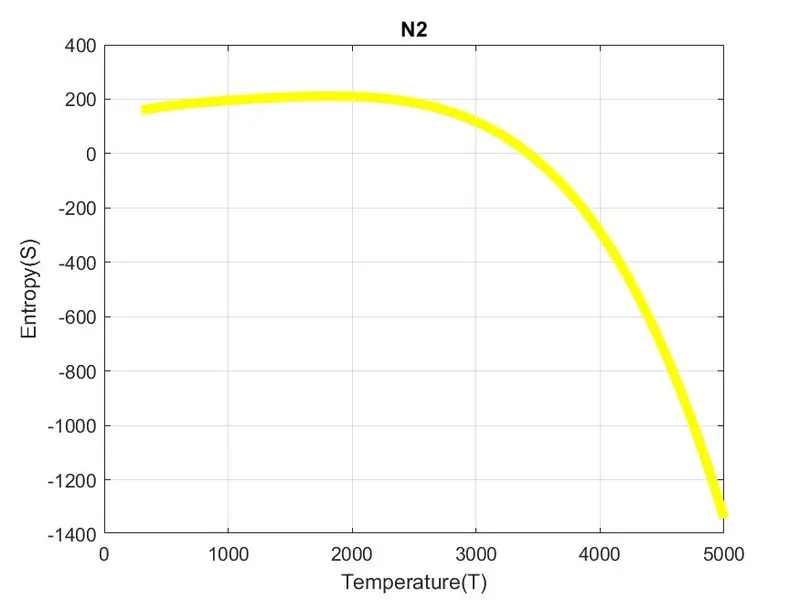
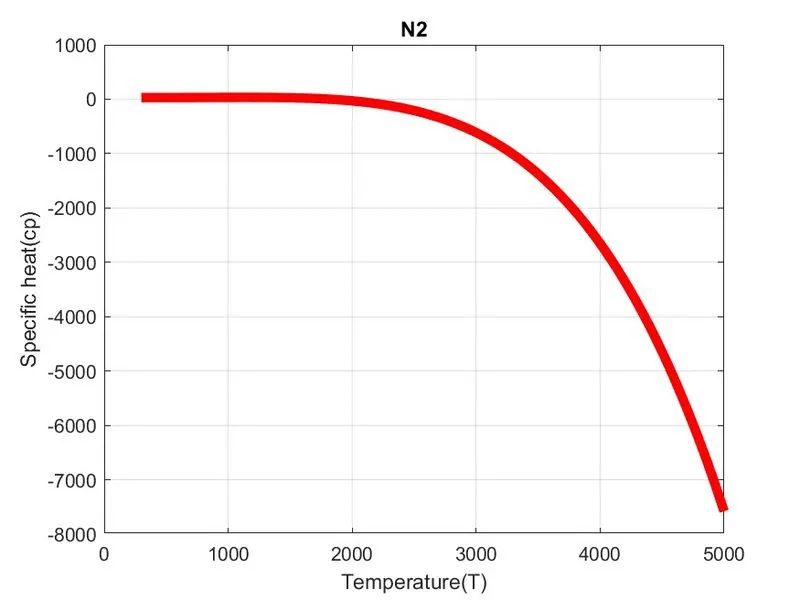
Plots for CO2:
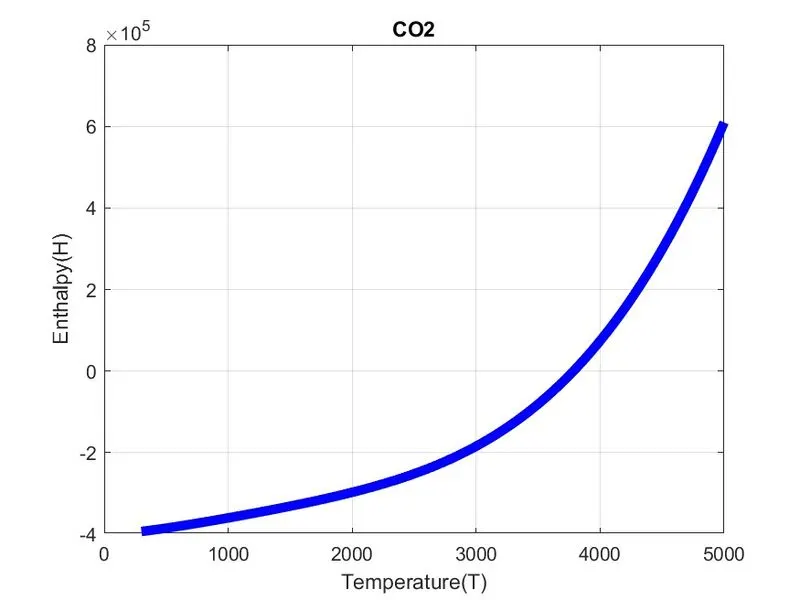
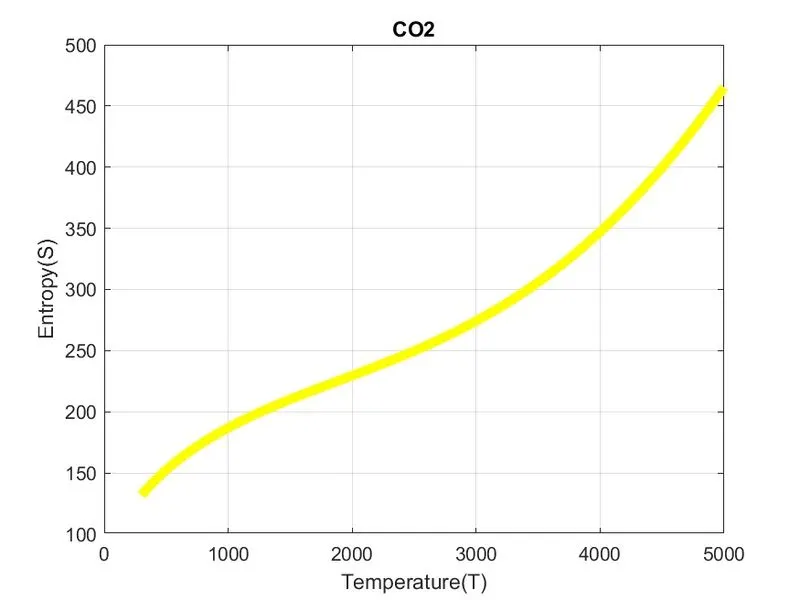
Folders created:
Molecular weight:
Result:
We have written a program in MatLab to parse the NASA thermodynamic data file and then calculate the thermodynamic properties of various gas species.