Project 1 - Parsing NASA thermodynamic data
AIM: To write a program in MATLAB to parse the NASA thermodynamic data file and then calculate the thermodynamic properties of various gas species.
OBJECTIVES:
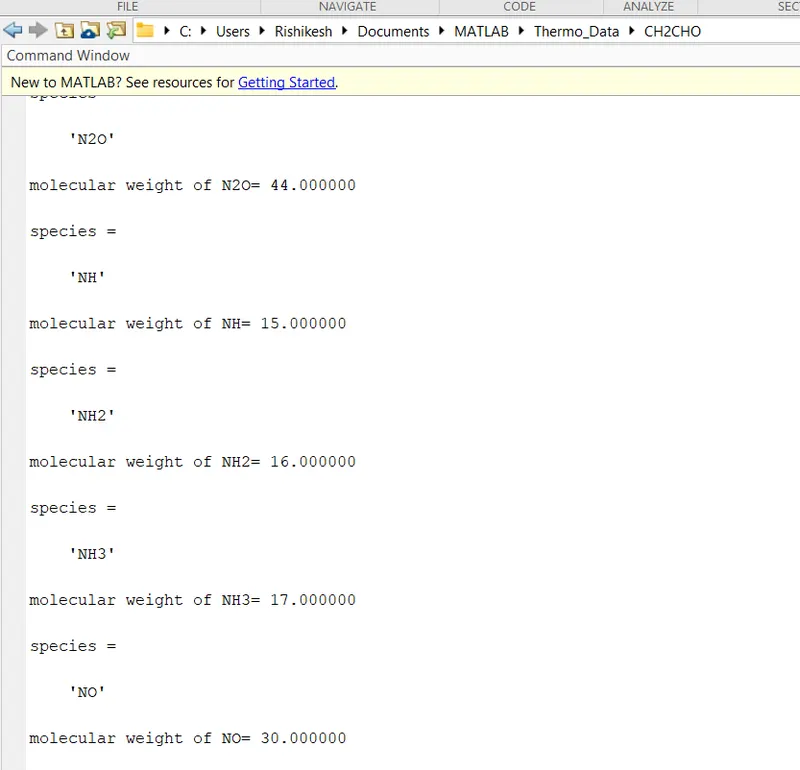
1. Calculate the molecular weight of each species and display it in the command window.
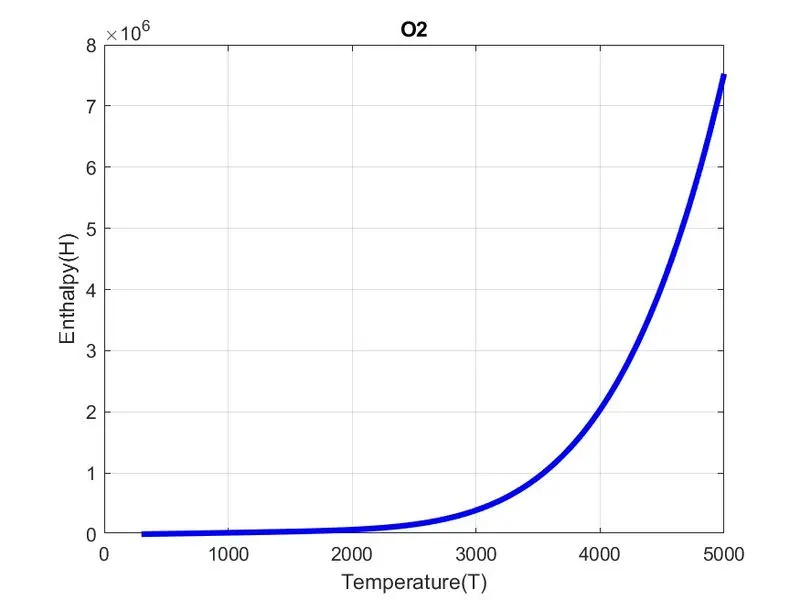
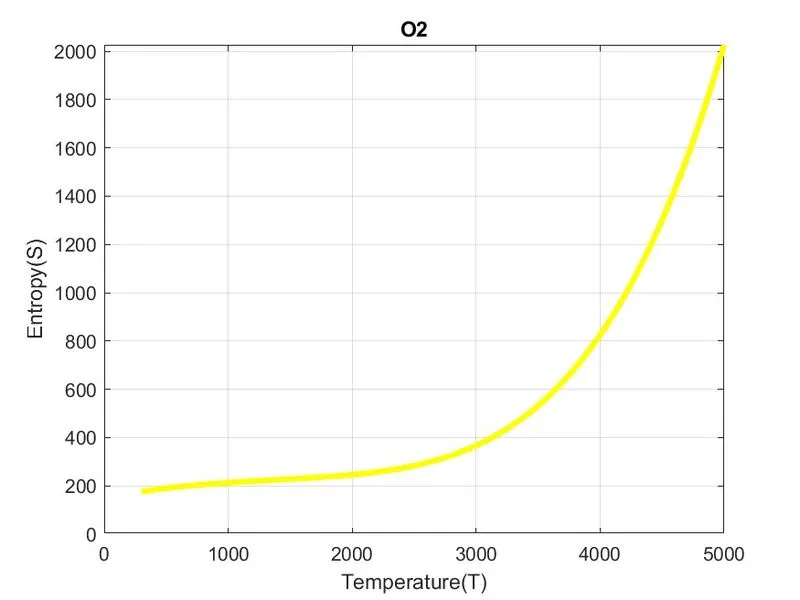
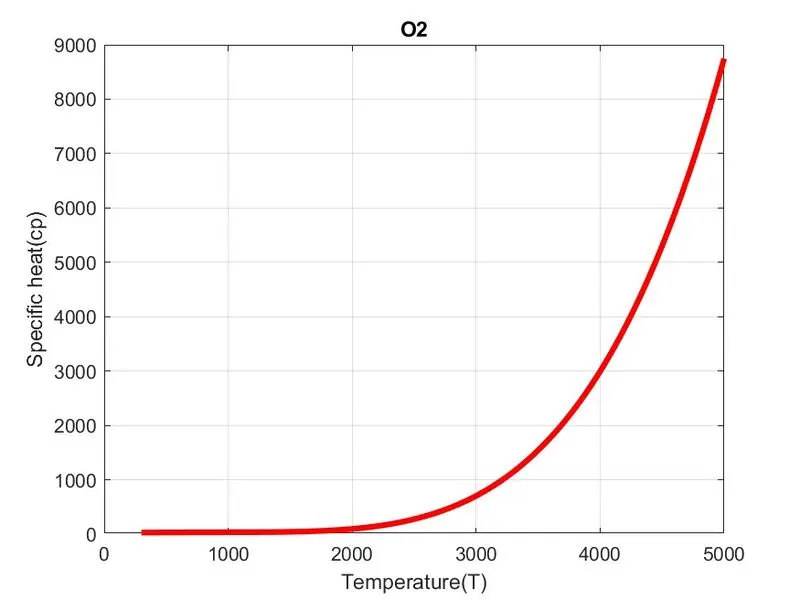
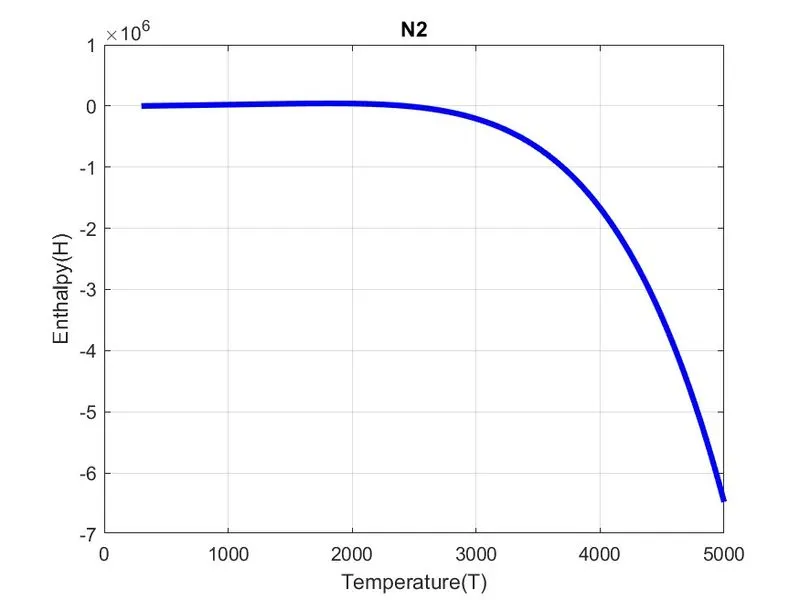
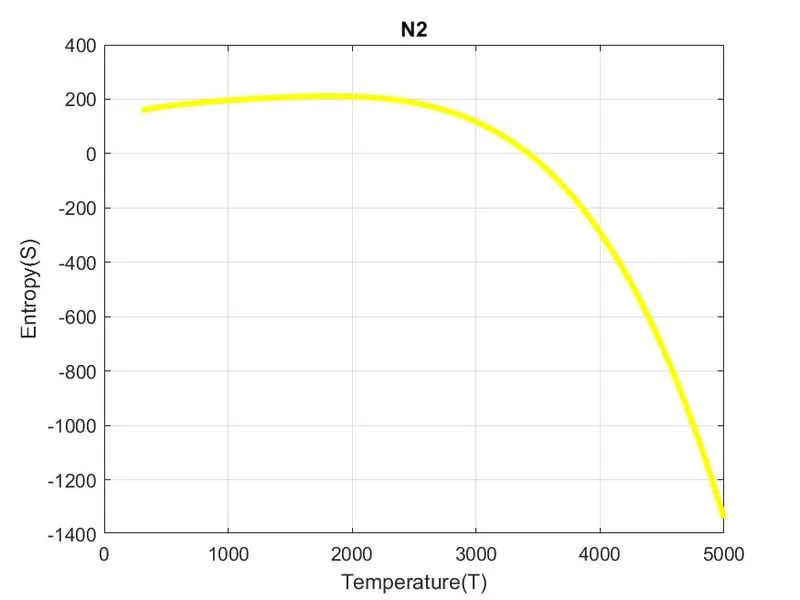
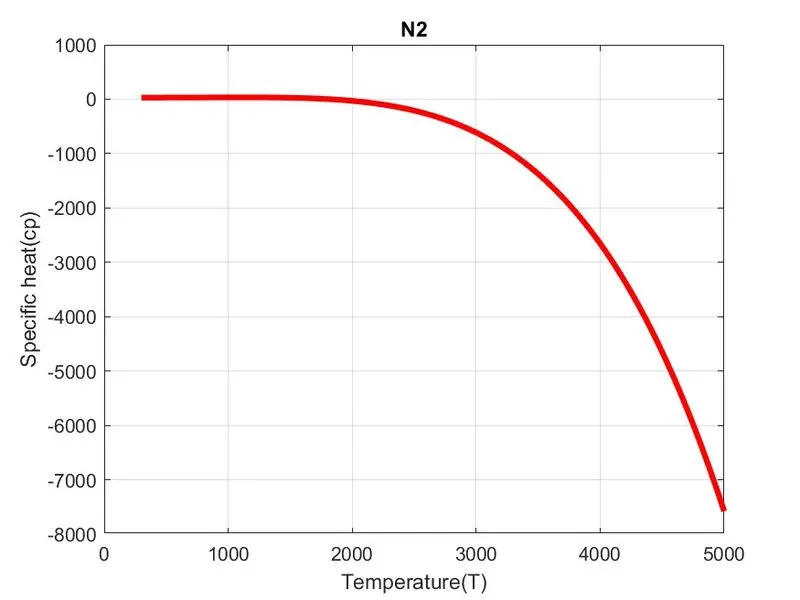
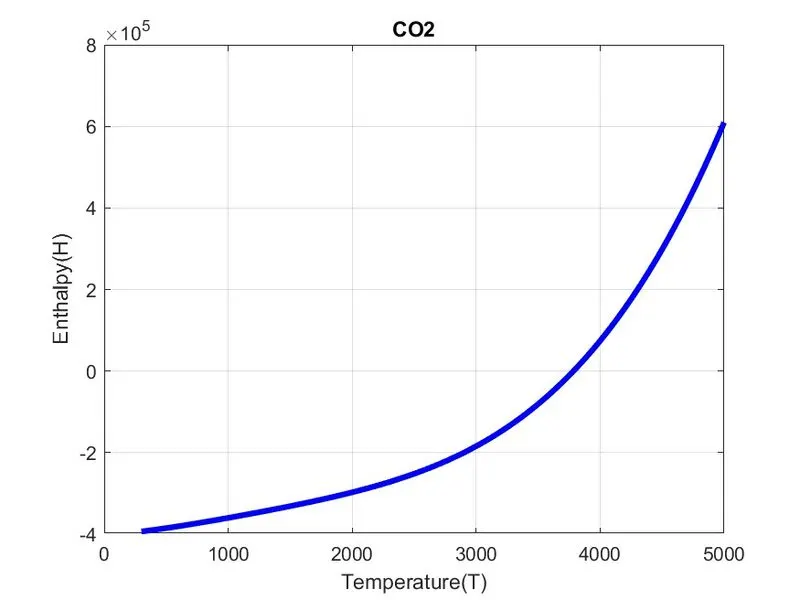
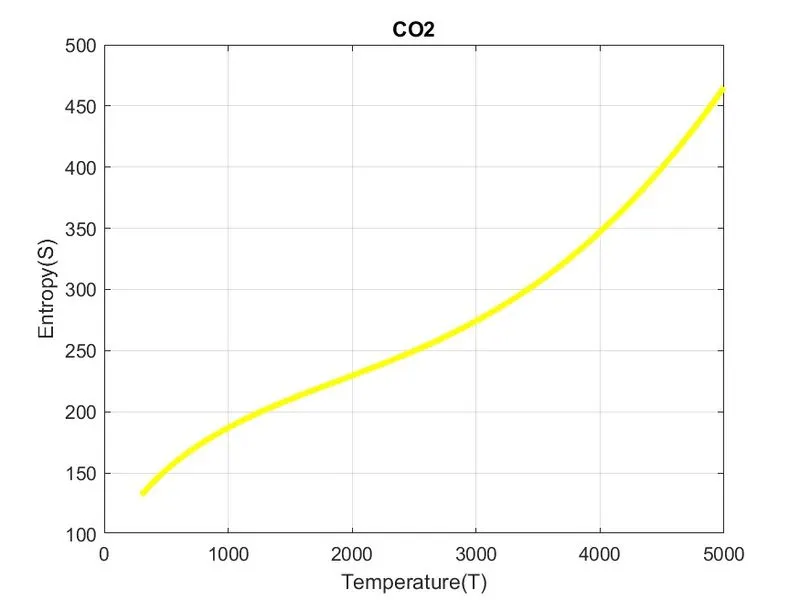
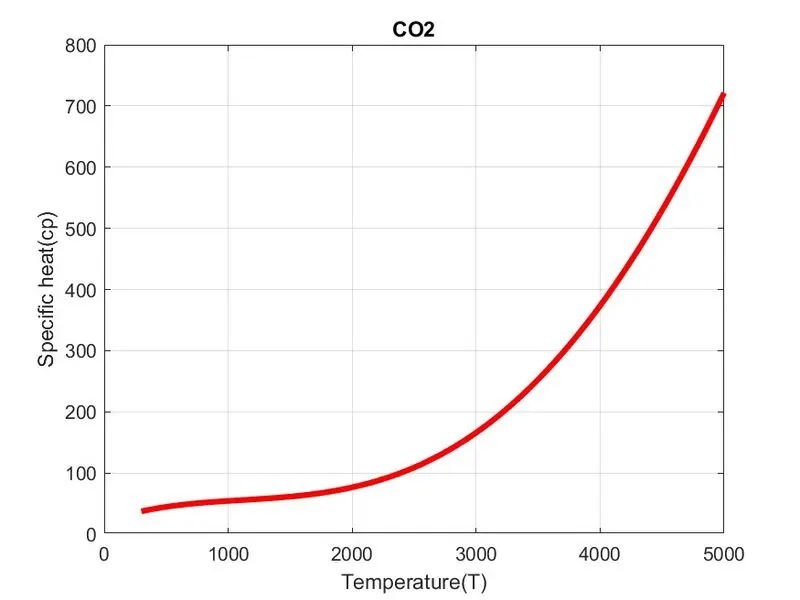
2. Plot the Cp, Enthalpy and Entropy for the local temperature range (low temperature : high temperature) specific for each species.
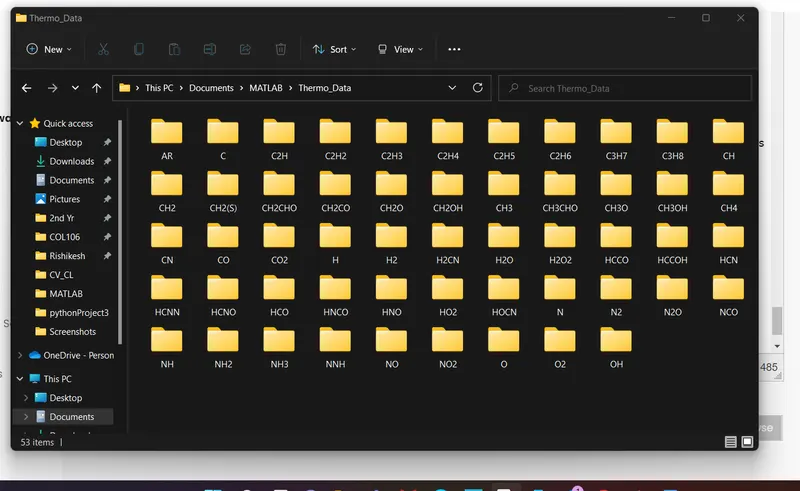
3. Save the plots as images with appropriate names and dump them in separate folders for each species with suitable name. All these should be generated automatically.
THEORY:
- What is Data Parsing?
Data parsing is a process in which a string of data is converted from one format to another. If you are reading data in raw HTML, a data parser will help you convert it into a more readable format such as plain text. Not all the information is converted during the parsing process and programs have their own sets of rules when it comes to parsing information.
In short, a data parse program is used for converting unstructured data into JSON, CSV, and other file formats and adds structure to said information.
- Parsing Definition
In the field of computer programming, the definition of parsing is to analyze a string of symbols, special characters, and data structures using Natural Language Processing (NLP). When you define extracting in parsing, it refers to structuring information from data sets and giving it meaning by organizing it, based on user-defined rules.
EQUATIONS:
The equations that we are going to use to calculate C_p, H,S are:
Where,
Cp=Specific Heat
R =Molar gas constant
S=Entropy
H=Enthalpy
T=Temperature
ai=Coefficients
CODE:
%Parsing Data
clear all
close all
clc

%R=molar gas constant
R=8.314;

%syntax to open the  file THERMO.dat
f1=fopen('THERMO.dat','r');

%To read lines
l1=fgetl(f1);
l2=fgetl(f1);
value=strsplit(l2,' ');

%To get global temperatures from file in number form
global_lowtemp=str2num(value{2});
global_midtemp=str2num(value{3});
global_hightemp=str2num(value{4});

%temperature range
T=linspace(global_lowtemp,global_hightemp,1000);

%skipping 3 lines
l3=fgetl(f1);
l4=fgetl(f1);
l5=fgetl(f1);

%Reading species, calcuating Cp, H, S and plotting
for i=1:53
    tline=fgetl(f1);

    A=strsplit(tline,' ');
    name_of_species=(A{1});
    lowtemp= str2num(A{end-3});
    midtemp=str2num(A{end-2});
    hightemp=str2num(A{end-1});

    %Finding 7 higher coefficients and 7 lower coefficients

    tline1=fgetl(f1);
    a=findstr(tline1,'E');

    a1=tline1(1:a(1)+3);
    a1=str2num(a1);
    a2=tline1(a(1)+4:a(2)+3);
    a2=str2num(a2);
    a3=tline1(a(2)+4:a(3)+3);
    a3=str2num(a3);
    a4=tline1(a(3)+4:a(4)+3);
    a4=str2num(a4);
    a5=tline1(a(4)+4:a(5)+3);
    a5=str2num(a5);

    tline2=fgetl(f1);
    a=findstr(tline2,'E');

    a6=tline2(1:a(1)+3);
    a6=str2num(a6);
    a7=tline2(a(1)+4:a(2)+3);
    a7=str2num(a7);
    a8=tline2(a(2)+4:a(3)+3);
    a8=str2num(a8);
    a9=tline2(a(3)+4:a(4)+3);
    a9=str2num(a9);
    a10=tline2(a(4)+4:a(5)+3);
    a10=str2num(a10);


    tline3=fgetl(f1);
    a=findstr(tline3,'E');
    a11=tline3(1:a(1)+3);
    a11=str2num(a11);
    a12=tline3(a(1)+4:a(2)+3);
    a12=str2num(a12);
    a13=tline3(a(2)+4:a(3)+3);
    a13=str2num(a13);
    a14=tline3(a(3)+4:a(4)+3);
    a14=str2num(a14);

    %calculate specific heat(cp),Enthalpy(H),Entropy(S)
    Cp=Specific_heat(a1,a2,a3,a4,a5,a8,a9,a10,a11,a12,T,R,global_midtemp);
    H=Enthalpy(a1,a2,a3,a4,a5,a6,a8,a9,a10,a11,a12,a13,T,R,global_midtemp);
    S=Entropy(a1,a2,a3,a4,a5,a7,a8,a9,a10,a11,a12,a14,T,R,global_midtemp);


    %calculating molecular weight and printing it.
    Molecular_weight=wt(name_of_species);
    fprintf('molecular weight of %s= %f\n',name_of_species,Molecular_weight);

%Plotting Cp, H, T

cd('C:\Users\Rishikesh\Documents\MATLAB\Thermo_Data')
%creating the folder
mkdir(name_of_species);
cd(name_of_species);


%plotting T vs cp
figure(1)
plot(T,Cp,'linewidth',3,'color','r')
xlabel('Temperature(T)')
ylabel('Specific heat(cp)')
grid on
title(name_of_species)
saveas(figure(1),'specific heat.jpg');


%Plotting T vs H
figure(2)
plot(T,H,'linewidth',3,'color','b')
xlabel('Temperature(T)')
ylabel('Enthalpy(H)')
grid on
title(name_of_species)
saveas(figure(2),'Enthalpy.jpg');


%Plotting T vs S
figure(3)
plot(T,S,'linewidth',3,'color','y')
xlabel('Temperature(T)')
ylabel('Entropy(S)')
grid on
title(name_of_species)
saveas(figure(3),'Entropy.jpg');


end

function Cp = Specific_heat(a1,a2,a3,a4,a5,a8,a9,a10,a11,a12,T,R,global_midtemp)

%calculating specific_heat
if(T>= global_midtemp)
    Cp=R*(a1+(a2*T)+(a3*(T).^2)+(a4*(T).^3)+(a5*(T).^4));
else
    Cp=R*(a8+(a9*T)+(a10*(T).^2)+(a11*(T).^3)+(a12*(T).^4));
end
end

function H = Enthalpy(a1,a2,a3,a4,a5,a6,a8,a9,a10,a11,a12,a13,T,R,global_midtemp)

%calculating enthalpy
if(T>=global_midtemp)

    H=R*((a1*T)+((a2*(T).^2)/2)+((a3*(T).^3)/3)+((a4*(T).^4)/4)+((a5*(T).^5)/5)+a6);

else
    H=R*((a8*T)+((a9*(T).^2)/2)+((a10*(T).^3)/3)+((a11*(T).^4)/4)+((a12*(T).^5)/5)+a13);
end
end

function S=Entropy(a1,a2,a3,a4,a5,a7,a8,a9,a10,a11,a12,a14,T,R,global_midtemp)

%calculating entropy
if(T>= global_midtemp)
    S=R*(a1.*log(T)+(a2*T)+((a3*(T).^2)/2)+((a4*(T).^3)/3)+((a5*(T).^4)/5)+a7);
else
    S=R*(a8.*log(T)+(a9*T)+((a10*(T).^2)/2)+((a11*(T).^3)/3)+((a12*(T).^4)/4));
end
end

function Molecular_weight=wt(species_name)

Elements=['H' 'C' 'O' 'N' 'A' 'S'];
Atomic_weight =[1 12 16 14 40 32];
species=upper(species_name)

Molecular_weight=0;

for i=1:length(species)
  for    j=1:length(Elements)

    if strcmp(species(i),Elements(j))

        Molecular_weight=Molecular_weight+Atomic_weight(j);
        k=j;

    else
        n=str2double(species(i));
        if (n>1)
            Molecular_weight=Molecular_weight+Atomic_weight(k)*(n-1);
            break
        end
    end
  end
end
end
EXPLANATION:
1. First, we saved the THERMO.dat file in the same directory where the MATLAB code is saved.
2. To open/access the file in the program, we use the command fopen, with the name and mode in parenthesis.
3. To access the first line of the file, we use the command fgetl. After executing this command, the assigned variable then contains the entire first line in string format. On using the command again, the next line gets stored in string format and so on.
4. To store each word seperately in an array of strings, we use the command strsplit, specifying the delimiter.
5. Using the array above, we then access each data and then if required, convert it into numerical form using str2num command.
This is the basic idea of accessing and converting the data in required form. Now, from line 6 onwards, we start encountering the coefficients.
6. The first line contains the following information:
-Name of the element/compound
-Local temp. ranges
Each next line(s) contain min. 5 coeff. values. All 53 elements/compounds store information in similar mannar, thus, we'll run a for loop 53 times.
7. Inside for we to store the coeff., we will take the help of findstr, which scans an array of string and stores the array index of the letter or word mentioned in the paranthesis. Inside the for loop, we will be storing the index of Es.
8. To get the first coeff., we will store it in string format from 1st index to a(1)+3 index, where a() stores the indexes of E, and then use str2num command.
9. Similarly, we will store other variables using the above logic.
10. Once we have all the variables, we'll use them to calculate their thermodynamic properties by passing them as parameters in their respective functions.
11. Next, we'll create a file using the command mkdir, open it using cd command and save all the plots one by one using saveas command.
OUTPUTS:
1.File Screenshot:
2. Molecular wt.:
3. O2
4. N2
5. CO2
REFERENCES: