Project 1 - Parsing NASA thermodynamic data
Aim: Write a function that extract the 14 coefficient and calculates the enthalpy,entropy and specific heats for all the species in the data file.
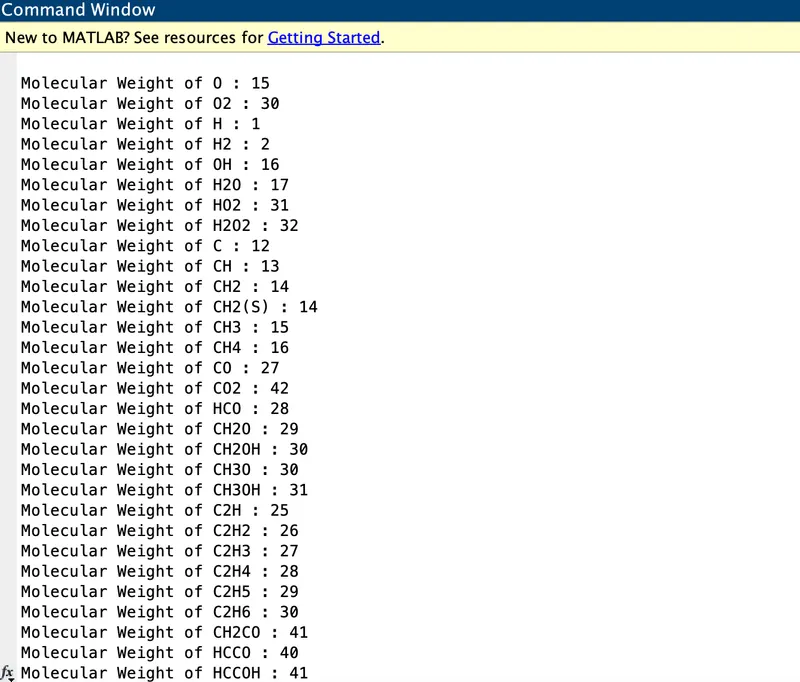
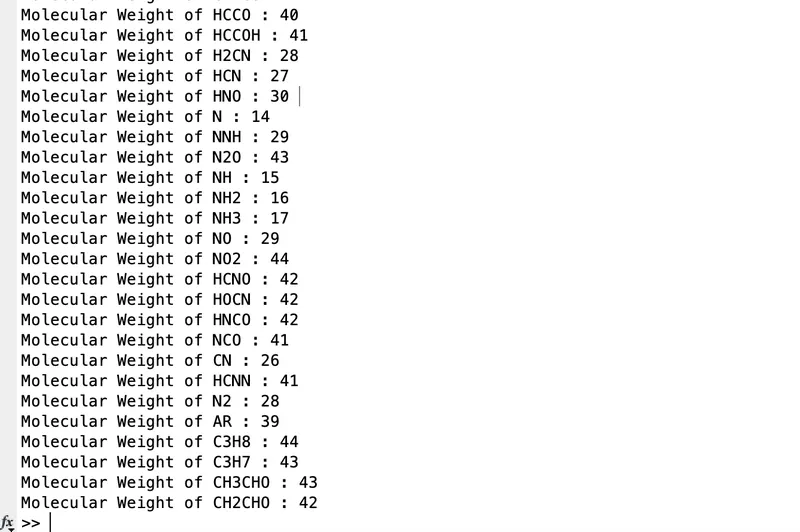
1. Calculate the molecular weight of each species and display it in the command window.
2. Plot the Cp,Enthalpy,Entropy for the local temperature range specific for each species.
3. Save the plots as images with appropriate names and dump them in separate folder for each species with suitable name. All these should be generated automatically.
4. The main program that you will submit will just take the "THERMO.dat" file as an input and generate Cp,H and S plots.
5. Write a detailed report to describe your logic.
Governing Equation:
Enthalpy
H = U +P*V KJ/mol
U = Internal Energy
P = Pressure
V = volume
Entropy
G = H - T*S J/Kmol
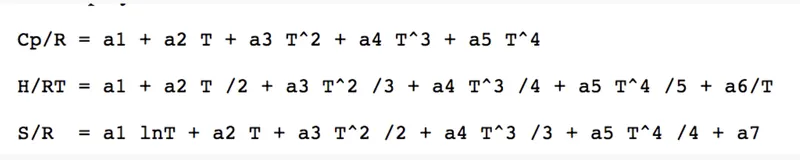
Body of the content:
1.Specific Heat Function Code:
function cp = specific_heat(a1,a2,a3,a4,a5,a8,a9,a10,a11,a12,T,R,global_med_temp)


if T > global_med_temp
    cp = R.*(a1+a2.*T+a3.*T.^2+a4.*T.^3+a5.*T.^4);

else
    cp = R.*(a8+a9.*T+a10.*T.^2+a11.*T.^3+a12.*T.^4);
end
2. Enthalpy Function Code:
function h = enthalpy(a1,a2,a3,a4,a5,a6,a8,a9,a10,a11,a12,a13,T,R,global_med_temp)
if T > global_med_temp
    h = R.*(a1.*T+(a2.*T.^2)./2+(a3.*T.^3)./3+(a4.*T.^4)./4+(a5.*T.^5)./5+a6./T);
else
    h = R.*(a8.*T+(a9.*T.^2)./2+(a10.*T.^3)./3+(a11.*T.^4)./4+(a12.*T.^5)./5+a13./T);

end
3. Entropy Function Code:
function s = entropy(a1,a2,a3,a4,a5,a7,a8,a9,a10,a11,a12,a14,T,R,global_med_temp)
if T<=global_med_temp
    s =  R*(a1.*log(T)+a2.*(T)+a3.*(T.^2)./2+a4.*(T.^3)./3+a5.*(T.^4)./4+a7);
else
    s = R*(a8.*log(T)+a9.*(T)+a10.*(T.^2)./2+a11.*(T.^3)./3+a12.*(T.^4)./4+a14);
end
4. Molecular Weight Function Code:
function MW =molecular_weight(element_name)
atoms = ['H','C','N','O','Ar'];
     fprintf('Molecular Weight of ');
    fprintf(element_name);
    fprintf(' : ');
    atomic_weight = [1 12 14 15 39];
    MW = 0;
    for i = 1:length(element_name)
        for j = 1:length(atoms)
            if strcmp(element_name(i),atoms(j))
                MW = MW +atomic_weight(j);
                position = j;
            end
        end
        n = str2num(element_name(i));
        if n>1
            MW = MW + atomic_weight(position)*(n-1);
        end
    end
    fprintf('%d',MW);
    disp(' ');
    end
Main Code:
clear all
close all
clc


f1 = fopen('THERMO.dat','r');
first_line = fgetl(f1);  % reading the 1st line from data


%  global max, min, and medium temperatures

global_temp = fgetl(f1)  %reading 2nd line from data
temp_range = strsplit(global_temp,' ') %splitting 2nd line using blank space as delimiter

%obtaining temperature values from splitted data
global_min_temp = str2num(temp_range{2})
global_med_temp = str2num(temp_range{3})
global_max_temp = str2num(temp_range{4})

%Create a vector of 500 evenly spaced temperature points
T = linspace(global_min_temp,global_max_temp,500);
R = 8.314; % Universal gas constant

comments1 = fgetl(f1);  %reading 3rd line from data
comments2 = fgetl(f1);  %reading 4th line from data
comments3 = fgetl(f1);  %reading 5th line from data

for i = 1:53


line1 = fgetl(f1);
element_name = strtok(line1);

line2 = fgetl(f1);
A = strfind(line2,'E');

line3 = fgetl(f1);
B = strfind(line3,'E');

line4 = fgetl(f1);
C = strfind(line4,'E');

a1 = str2num(line2(1:A(1)+3));
a2 = str2num(line2(A(1)+4:A(2)+3));
a3 = str2num(line2(A(2)+4:A(3)+3));
a4 = str2num(line2(A(3)+4:A(4)+3));
a5 = str2num(line2(A(4)+4:A(5)+3));

a6 = str2num(line3(1:B(1)+3));
a7 = str2num(line3(B(1)+4:B(2)+3));

a8 = str2num(line3(B(2)+4:B(3)+3));
a9 = str2num(line3(B(3)+4:B(4)+3));
a10 = str2num(line3(B(4)+4:B(5)+3));
a11 = str2num(line4(1:C(1)+3));
a12 = str2num(line4(C(1)+4:C(2)+3));
a13 = str2num(line4(C(2)+4:C(3)+3));
a14 = str2num(line4(C(3)+4:C(4)+3));


%specific heat
cp = specific_heat(a1,a2,a3,a4,a5,a8,a9,a10,a11,a12,T,R,global_med_temp);

% Enthalpy
h = enthalpy(a1,a2,a3,a4,a5,a6,a8,a9,a10,a11,a12,a13,T,R,global_med_temp);

% Entropy
s = entropy(a1,a2,a3,a4,a5,a7,a8,a9,a10,a11,a12,a14,T,R,global_med_temp);

% Calculating molecular weight of species
Molecular_wt(i) = molecular_weight(element_name);

%saving and plotting the data

cd('/Users/omkarkhot/Documents/Project1')
dir_name = element_name;
mkdir(dir_name);

figure(1)
plot(T,cp,'linewidth',5,'color','b')
title(sprintf('Specific heat Vs Temperature for %s',element_name))
xlabel('TEMPERATURE')
ylabel('SPECIFIC HEAT')
grid on

figure(2)
plot(T,h,'linewidth',5,'color','r')
title(sprintf('Enthalpy Vs Temperature for %s',element_name))
xlabel('TEMPERATURE')
ylabel('ENTHALPY')
grid on

figure(3)
plot(T,s,'linewidth',5,'color','g')
title(sprintf('Entropy Vs Temperature for %s',element_name))
xlabel('TEMPERATURE')
ylabel('ENTROPY')
grid on


  pause(0.0001)

   cd(dir_name);
saveas(1,'Specific heat.png');
saveas(2,'Enthalpy.png');
saveas(3,'Entropy.png');


end

fclose(f1);
Explanation of the Code:
1. First step is to download THERMO.dat file and save in the current directory.
2. After that use fopen command these will open the file and 'r' read command will read the entire file.
3. Then use fgetl command to read the file and especially first line.
4. Again use fgetl command to read the 2nd line i:e Global temperature range.
5. T o split the 2nd line using strsplit command using blank space as delimeter and obtaining temperature value from splitted data and use str2num command.
6. Then create a vector of 500 evenly spaced temperature points using linspace command.
7. Use for loop command.
8. Elements name use strtok command passes str from left to right using white space character as delimeter and return parts or all the text is token.
9. for line 2,3,4 use strfind command and define all the coefficients,once we done with the coefficients.
10. After that generate calling function for specific heat,enthalpy and entropy in that function use if else condition for Global_med_temp and lastly use end.
11. Save the function file with the same name mention in the function and then run in command window require function is generated.
12. In the case of Molecular Weight function code is differ than cp,E and S.
13. After assign the Molecular Weight and then mention the element name and their atomic weight.
14. Then we use twice for loop command and if else condition.
15. Then use str2num function and mention the range of n.
16. Define the molecular weight formula and use fprintf command and display command and close the function using end and run the function in command window and require output is generated.
17. For saving and plotting the data use cd command to mention the current directory,dir_name command to mention the element name and lastly use mkdir command.
18. i) After that plot Temperature vs Specific heat.
ii) Plot Temperature vs Enthalpy.
iii) Plot Temperature vs Entropy.
19. Label the graph and use grid on command.
20. Use pause command to see loop of each species plot in real time.
21. Then use saveas function to save Cp,E and S in png format and use end
22. Lastly use fclose(f1) command and run the main code require output will generated of Nasa Thermodynamic file.
Results: Output
Temperature:
global_temp =

    '   300.000  1000.000  5000.000'


temp_range =

  1×4 cell array

    {0×0 char}    {'300.000'}    {'1000.000'}    {'5000.000'}


global_min_temp =

   300


global_med_temp =

        1000


global_max_temp =

        5000
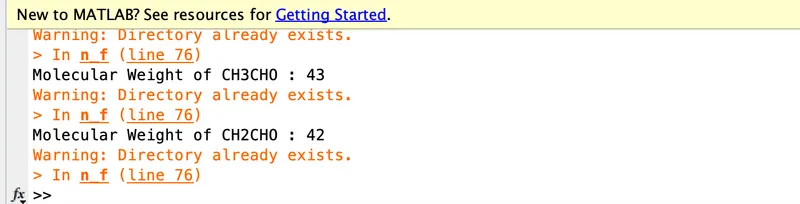
Molecular Weight: Screenshot
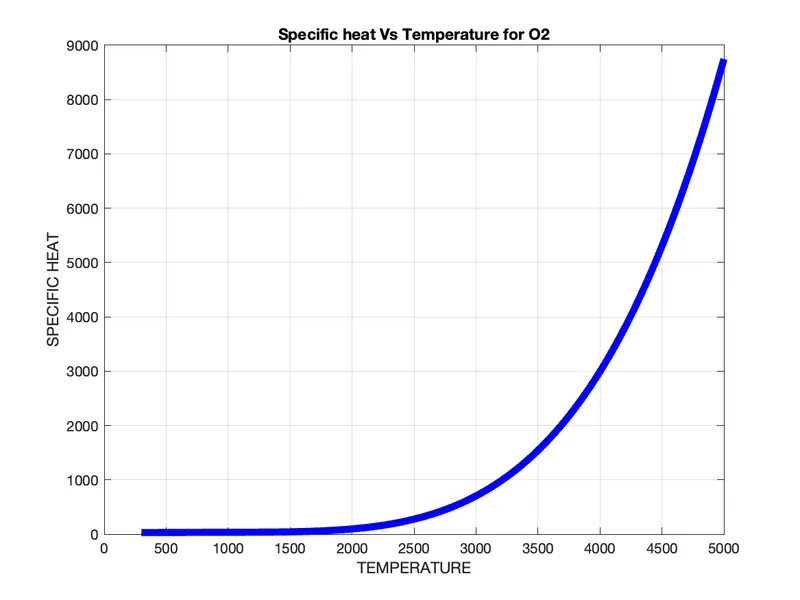
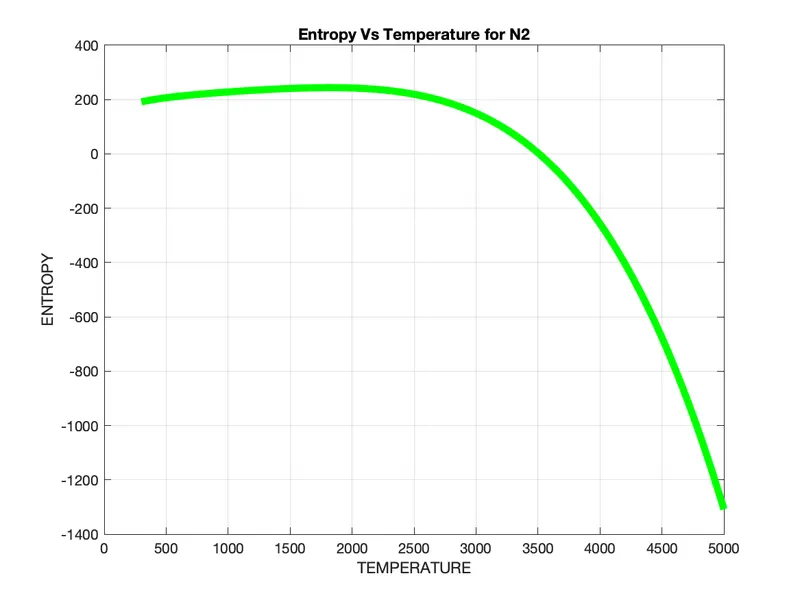
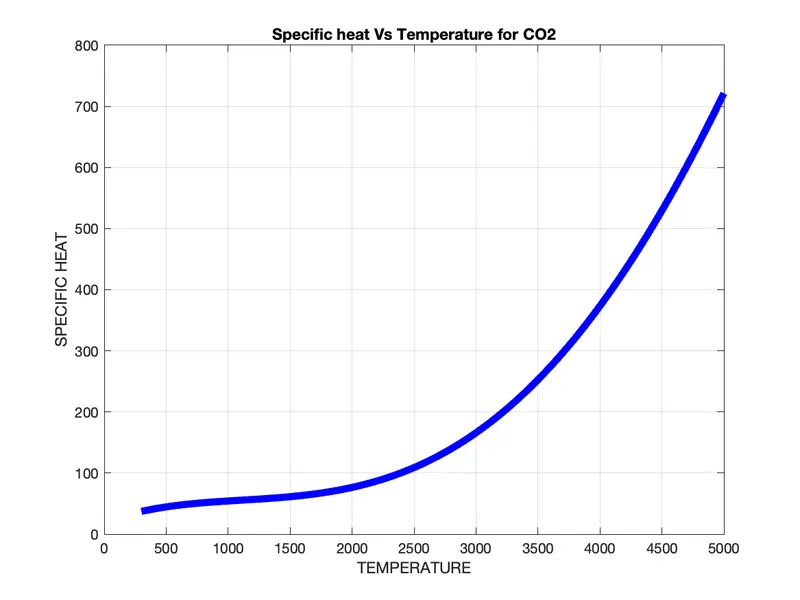
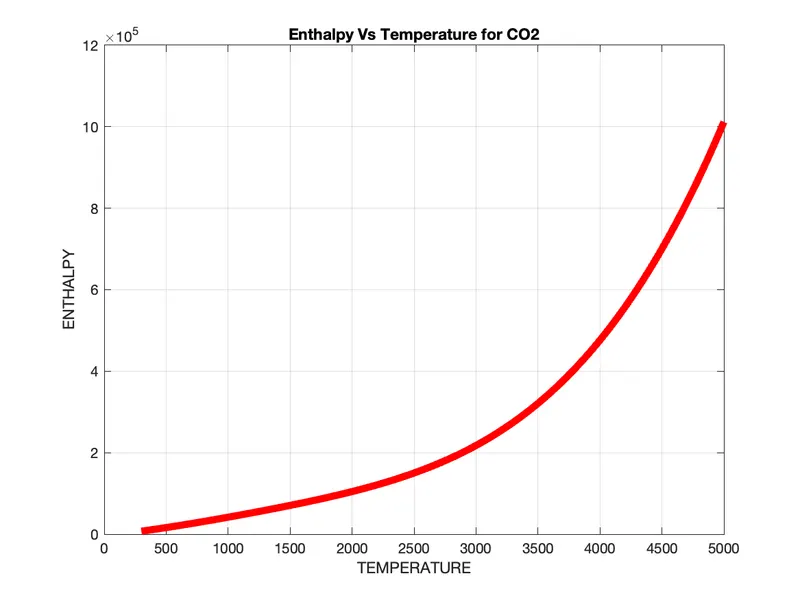
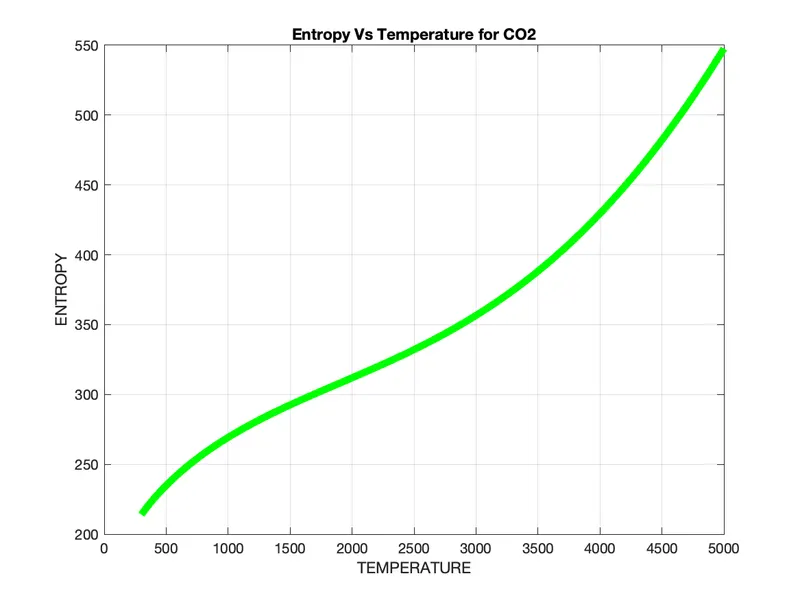
Plot of O2,N2 and CO2 :
i) Specific heat vs Temperature
ii) Enthalpy vs Temperature
iii) Entropy vs Temperature
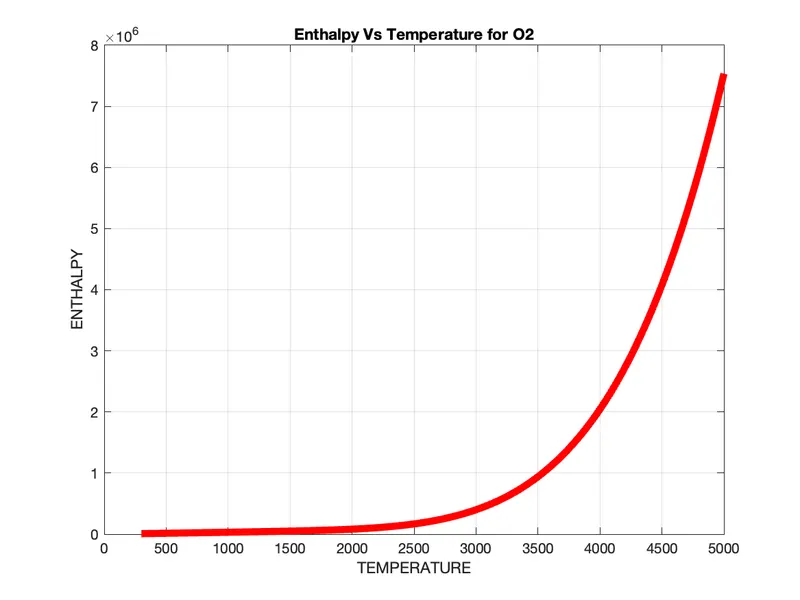
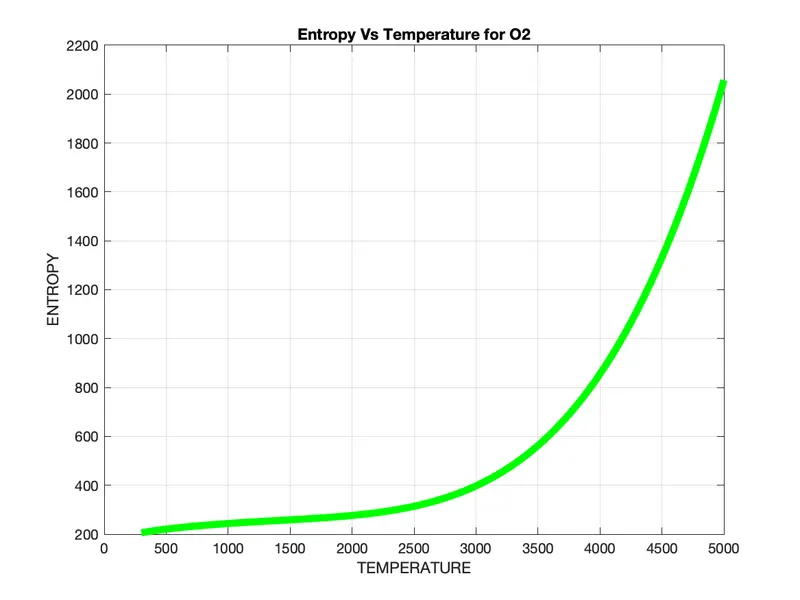
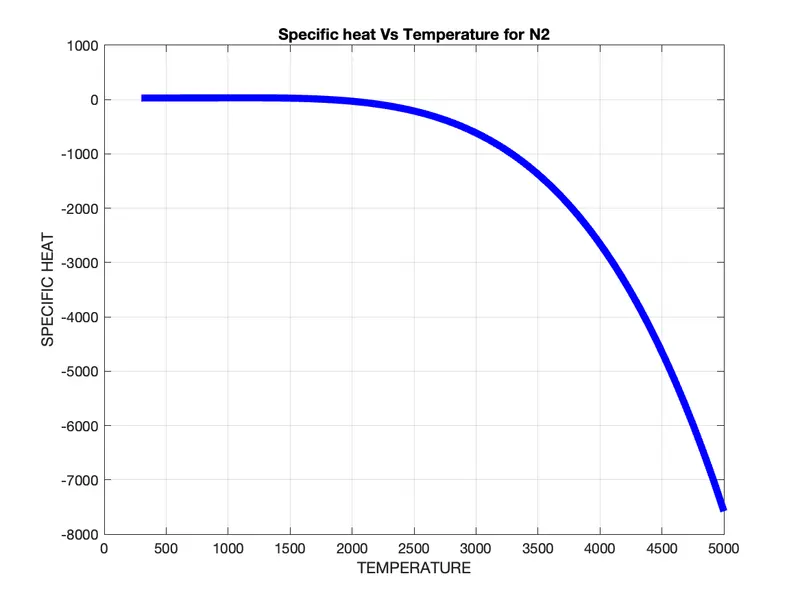
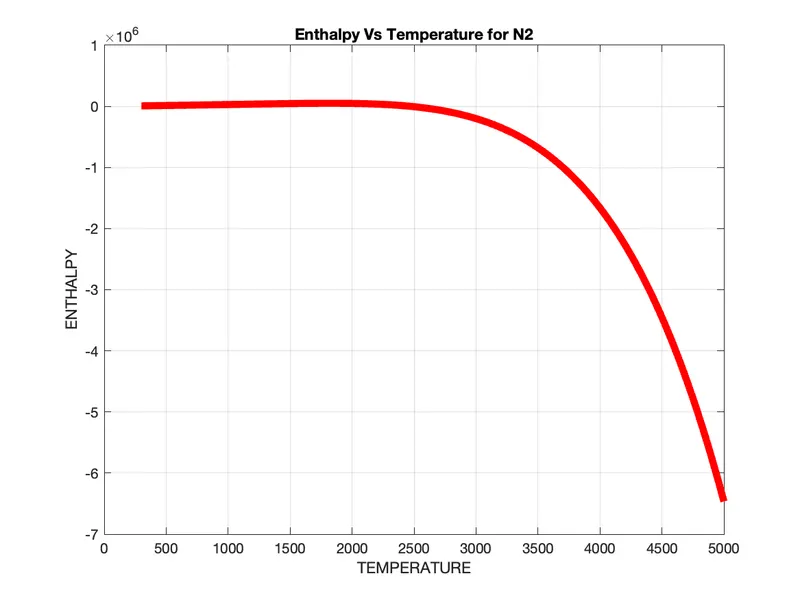
Warning sign


Conclusion:
1. As we see that we can easily parse any data file using Matlab and generate our require output very easily.
2. Also we plot all the graph of all elements mention in the Nasa thermodynamic file.