Project 1 - Parsing NASA thermodynamic data
Parsing NASA thermodynamic data
Introduction
This program is used to parse the thermodynamic data given by NASA for 53 molecules in a file “THERMO.dat” and give the plot details and molecular weight of the species required. This program consists of multiple sub functions and it is all assembled in the file name called “Input.m”. The list of the functions used is given below.
- Input.m
- Molecular_Weights_Generator.m
- Molecular_Weight_Calculator.m
- species_container_generator.m
- Number_separator.m
- Plot_Generator.m
- Species_selector.m
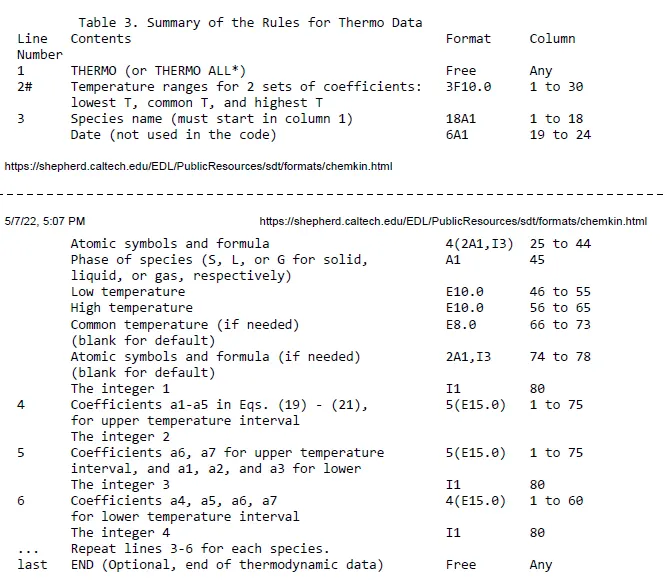
This project uses the logic based on the “chemkin.pdf” page 3 and page 4.
Molecular_Weights_Generator
% This is used to get molecular weight for the individual

%% Reading Molecular weight file
function Molecular_Container = Molecular_Weights_Generator(file_name)
file=fopen(file_name,"r");
iter_count=1;
line_dat=string(fgetl(file));
Molecular_Container=containers.Map;
while true
    line_dat=string(fgetl(file));
    data_mole=split(line_dat);
    if data_mole=="-1"
        break
    end
    Molecular_Container(upper(data_mole(1)))=str2double(data_mole(2));
    iter_count=iter_count+1;
end
end
This function parses the elemental weight from the given file and gives it as an output. The file contains the element name and elemental weight as per the periodic table. It achieves the goal with the help of container. It parses a line and takes the symbols as “key” and stores its elemental weight.

Molecular_Weights_Calculator
function Molecular_Weight = Molecular_Weight_Calculator(species_element_text,Molecular_Container)
%This Function Calculates the molecular weight of the species
%% Parsing the Moelcule's composition from the text

species_element_char=char(strtrim(species_element_text));
iter=1;
no_of_chars=1;

while no_of_chars<length(species_element_char)
    species_element_array(iter,:)=species_element_char(1,no_of_chars:no_of_chars+4);
    no_of_chars=no_of_chars+5;
    iter=iter+1;
end
%% This Section calculates the molecular data.

Molecular_element=containers.Map;
iter=1;
while iter<=height(species_element_array)
    element_data=string(species_element_array(iter,:));
    element_array=split(element_data);
    Molecular_element(element_array(1))=str2double(element_array(2));
    iter=iter+1;
end
Molecular_Weight=0;
for Element_iter=upper(string(Molecular_element.keys))
    for Element_Count_iter = 1:Molecular_element(Element_iter)
        Molecular_Weight=Molecular_Weight+Molecular_Container(Element_iter);
    end
end
end
This Function get the elemental weight container and species element text as input and gives molecular weight of that species. Based on the inference made from the given data file(THERMO.dat) and chemkin file, the elemental composition of the molecule is given in the lines 6, 10, 14…. in the column from 25 to 44.
This substring is parsed and the element symbols are made as keys(Element Iter) and number next to the element is made the number of repetition(Element Count Iter). The molecular weight is calculated by this loop.

Number_Seperator
function coef_subarray = Number_separator(line_dat,number_of_values,length_of_value_char)
%This Function is used to parse the character string into separate values
value_iter=1;
character_string=char(line_dat);
for iter=1:number_of_values
    start_val=value_iter;
    end_val=value_iter+length_of_value_char-1;
    value_string=character_string(1,start_val:end_val);
    value=str2double(value_string);
    coef_subarray(iter)=value;
    value_iter=value_iter+(length_of_value_char);
end
end
It parses a single line text into the number of coefficients present in that text. It takes the text message(line_dat), number_of_values present in the text and length of each value as input and coefficient array as output.
From the point 4,5 and 6 in chemkin each coefficient values have 15 characters each. The text is parsed using these points and the coefficients values are separated.

species_container_generator
function [species_container] = species_container_generator(dat_array)
%This Function is used to map the species in
%% Getting Molecular data
Molecular_Container = Molecular_Weights_Generator("Molecular_Weights.txt");
%% Parsing species data
species_container=containers.Map;
species=struct;
species_count=1;
for i=1:4:212
    Char_array=char(dat_array(i));
    species_name=strtrim(string(Char_array(1,1:18)));
    species.molecular_weight=Molecular_Weight_Calculator(string(Char_array(1,25:44)),Molecular_Container);
    species.low_temperature=str2double(string(Char_array(1,46:55)));
    species.high_temperature=str2double(string(Char_array(1,56:65)));
    species.common_temperature=str2double(string(Char_array(1,66:75)));
    a1_5=Number_separator(dat_array(i+1),5,15);
    a6_10=Number_separator(dat_array(i+2),5,15);
    a10_14=Number_separator(dat_array(i+3),4,15);
    species.a_coef=[a1_5,a6_10,a10_14]';
    species_container(species_name)=species;
    species_count=species_count+1;
end
%% Including C_p/R, H/RT and S/R
R=8.3144;
for key = string(species_container.keys)
    species=species_container(key);
    a=species.a_coef;
    i=1;
    for T=species.low_temperature:0.1:species.high_temperature
        if T>species.common_temperature
            species.C_p(i)=(a(1)+a(2)*T+a(3)*T^2+a(4)*T^3+a(5)*T^4)*R;
            species.H(i)=(a(1)+a(2)*T/2+a(3)*T^2/3+a(4)*T^3/3+a(5)*T^4/4+a(6)/T)*R*T;
            species.S(i)=(log(T)*a(1)+a(2)*T+a(3)*T^2/3+a(4)*T^3/4+a(5)*T^4/4+a(7))*R;
        else
            species.C_p(i)=(a(8)+a(9)*T+a(10)*T^2+a(11)*T^3+a(12)*T^4)*R;
            species.H(i)=(a(8)+a(9)*T/2+a(10)*T^2/3+a(11)*T^3/3+a(12)*T^4/4+a(13)/T)*R*T;
            species.S(i)=(log(T)*a(8)+a(9)*T+a(10)*T^2/3+a(11)*T^3/4+a(12)*T^4/4+a(14))*R;
        end
        species.Temp_data(i)=T;
        i=i+1;
    end
    species_container(key)=species;
end
This function takes the parsed string array from the function INPUT as input and gives a container with species_name has key and the value is a structure having the properties as,
|
Property |
Description |
Reason |
|
molecular_weight |
It is the molecular weight of the species |
Using the Molecular_Weights_Generator and Molecular_Weights_Calculator functions |
|
low_temperature |
It stores the lower temperature value of the species as per the dataset |
By using the chemkin point 3 the text is parsed from 46 to 55 |
|
high_temperature |
It stores the higher temperature value of the species as per the dataset |
By using the chemkin point 3 the text is parsed from 56 to 65 |
|
common_temperature |
It stores the middle temperature value of the species as per the dataset |
By using the chemkin point 3 the text is parsed from 66 to 73 |
|
a_coef |
It is matrix containing a set of 14 coefficients where 1-7 values are the for finding the Specific Heat Capacity, Enthalpy and Entropy of the function from lower temperature common temperature and the 8-14 values are find the same values from common temperature to higher temperature. |
The three lines below the species name line are individually parsed using the Number_separator function into 5 coefficients in the first two lines and 4 coefficients in the last line. Then these coefficients are merged together into a single column matrix |
|
C_p |
It is the specific Heat Capacity of the function |
It is calculated by using the formula given in the text |
|
H |
It is the Enthalpy of the species |
It is calculated by using the formula given in the text |
|
S |
It is the Entropy of the species |
It is calculated by using the formula given in the text |
|
Temp_data |
It is the temperature data for which the above values are calculated. |
It is calculated by using the matrix operations in MatLab with the range from lower temperature to higher temperature with the interval of 1 deg C |
Formula for specific heat capacity, enthalpy and entropy.

Plot_Generator
function result = Plot_Generator(species_container)
%This Function is used to generate plot and stores it in separate folder.
y_label=["Specific heat capacity";"Enthalpy";"Entropy"];
x_label="Temperature";
main_folder=pwd;
mkdir("Species_Plot_Folder")
cd Species_Plot_Folder
species_path_folder=pwd;
for key = string(species_container.keys)
    species=species_container(key);
    species_plot_data=[species.C_p;species.H;species.S];
    cd(species_path_folder)
    mkdir(key)
    cd(key)
    for i=1:1:3
        title_text=strcat(y_label(i)," vs ",x_label);
        plot_name=strcat(key,"-",title_text);
        figure("Name",plot_name,"Visible","off")
        plot(species.Temp_data,species_plot_data(i,:))
        xlabel(x_label)
        ylabel(y_label(i))
        title(title_text)
        filename=strcat(plot_name,'.jpg');
        saveas(gcf,filename)
    end
end
cd(main_folder)
result="Success";
end
As the name indicates, this function is used to generate plots between specific heat capacity, Enthalpy and Entropy of all the species and stores it in the folder “Species_Plot_Folder”. First it stores the address the main directory(the directory where the code is using the pwd command then makes a new directory “Species_Plot_Folder” using mkdir command. After this it creates a folder with species name as folder name and saves all the three plots of that species into that folder. This process is repeated for each species. After the plots are created for all the species the path is changed to the main directory and the function exits with the result as “success”.
Species_selector
function [Run_status] = Species_selector(species_container)
%Species_selector Open the plots based on the user input
main_folder=pwd;
disp("Please choose species name from the following");
for species_name_list=species_container.keys
    disp(string(species_name_list))
end
desired_species_name=upper(input("Enter the species name: ","s"));
species=species_container((desired_species_name));
cd (strcat("Species_Plot_Folder\",desired_species_name))
plot_figures=dir('*.jpg');
for i=1:1:3
    figure_id=imread(plot_figures(i).name);
    figure;
    imshow(figure_id);
end
disp(strcat("The molecular weight of the species ",desired_species_name," is ",num2str(species.molecular_weight)));

cd(main_folder)
Run_status="success";
end
This function runs at the after the directories are created. It picks the plots of the species the user request in the command prompt. It displays the species name in the command prompt and the user needs to enter the species name in the command prompt(The input from the user is convert to uppercase, the species name is case insensitive for the user). The name entered by the user is searched in the species_container container where the molecular weight of the species is taken and displayed in the command prompt. Then, it goes into the respective directory and picks the plots using the function imread and imshow.
INPUT
clear all;
close all;
clc;
%% To remove the directory if needed
% rmdir("Species_Plot",'s')

%% Reading the File
file=fopen("THERMO.dat","r");
%% Converting the file to string array
iter_count=1;
line_dat="";
inLine_Count=1;
while line_dat ~="END"
line_dat=string(fgetl(file));
    if iter_count==2
        global_Temparature_text=line_dat;
    end
    if iter_count>5
        dat_array(inLine_Count,1)=line_dat;
        inLine_Count=inLine_Count+1;
    end
    iter_count=iter_count+1;
end
clear iter_count
clear inLine_Count
%% Generating the plot

global_Temparatures=Number_separator(char(global_Temparature_text),3,10);
species_container = species_container_generator(dat_array);
result = Plot_Generator(species_container);
%% Species selection based on input
Run_status = Species_selector(species_container);
This function is the master function upon which other functions are integrated. This function reads the THERMO.dat file and parses it into string array for further calculations. The line 2 contains the global temperatures and it is stored in a text which will be parsed later using Number_separator in this code. The after the 5th line, the lines are read from the file and stored in a column string array and used as an input for species_container_generator. After the species_container is created it is then used as an input for Plot_Generator which generates the plot for the species. Finally, suing the function Species_selector with its input as species_container the function is triggered and the molecular weight and the plots of the requested species by the user is displayed.
All the code and supporting files are given in the zip file below