Project 1 - Parsing NASA thermodynamic data
Aim : To write a code that extracts the 14 coefficients to perform the required operation for all the species in the given data file.
Objectives :
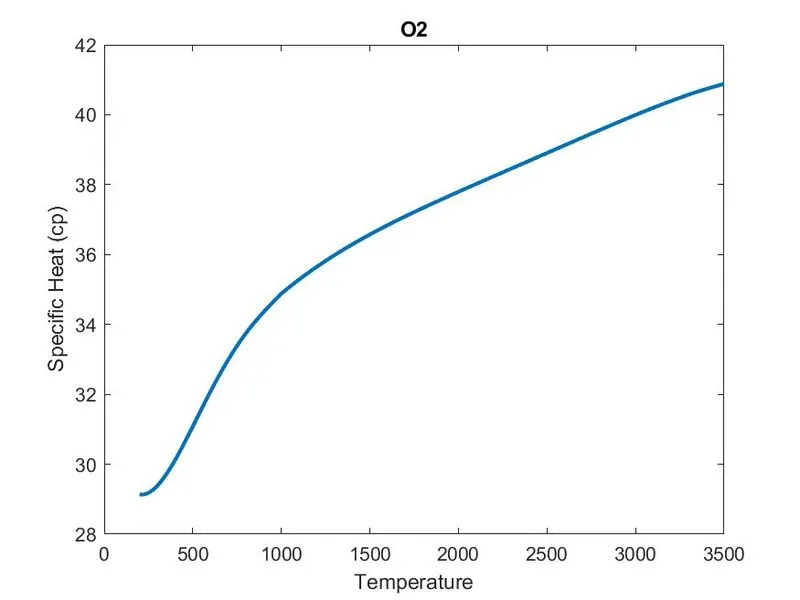
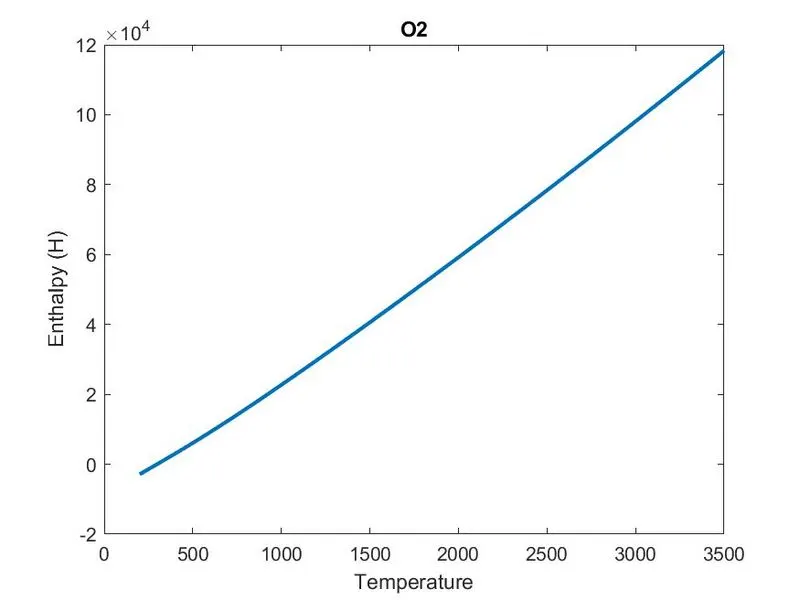
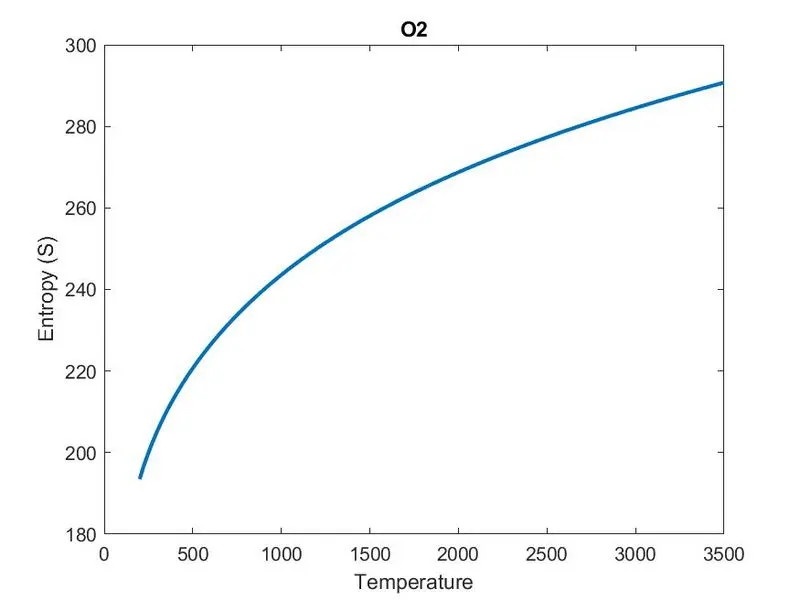
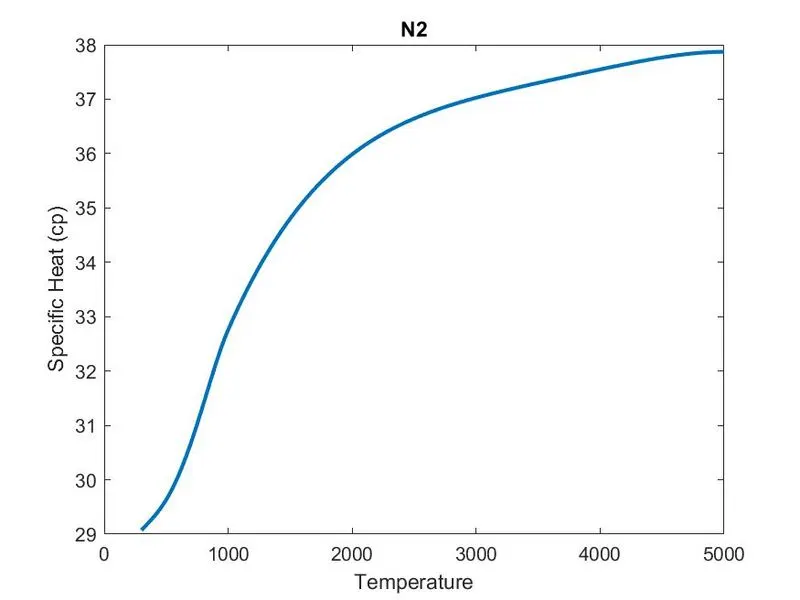
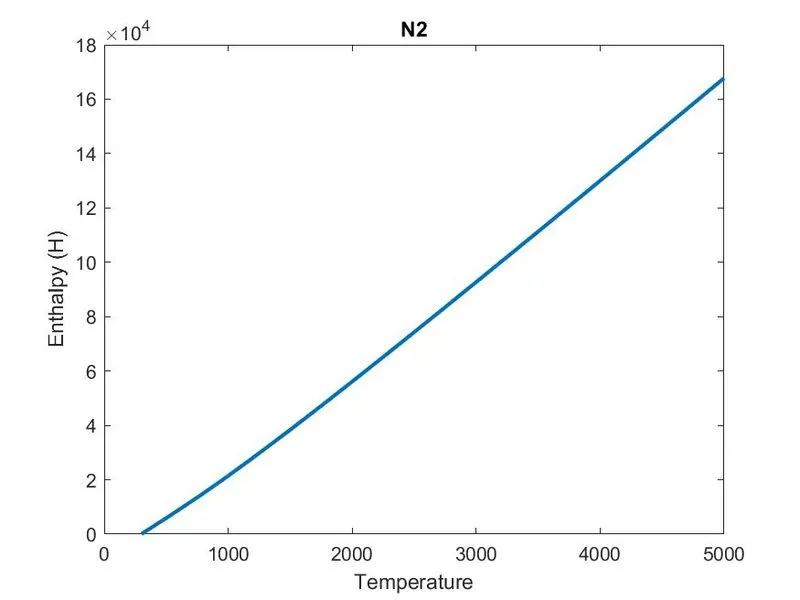
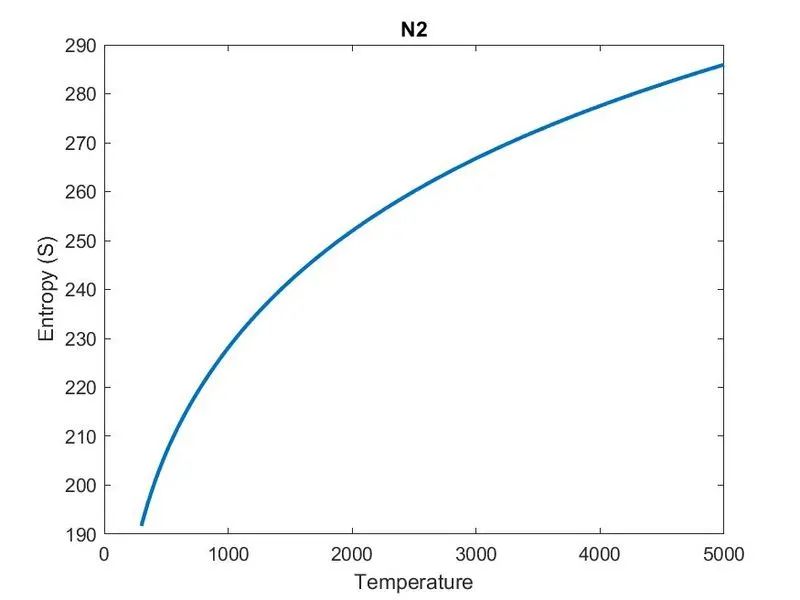
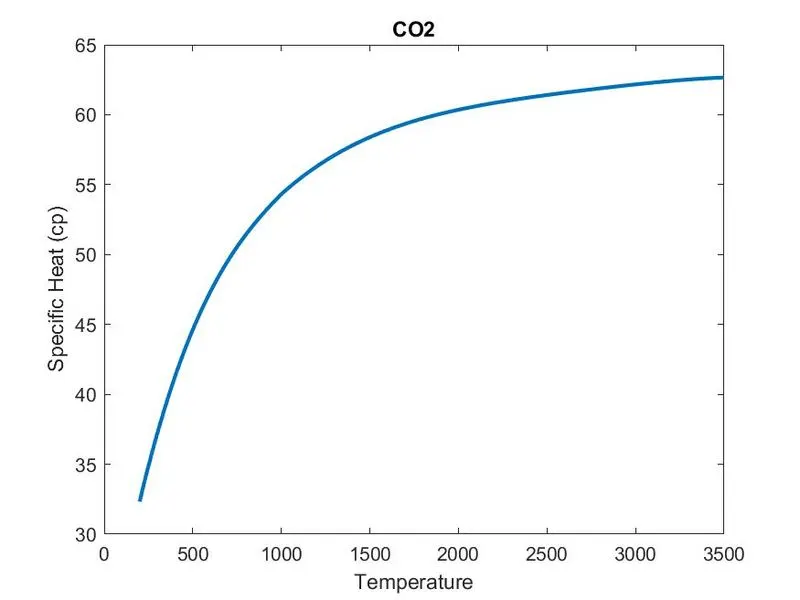
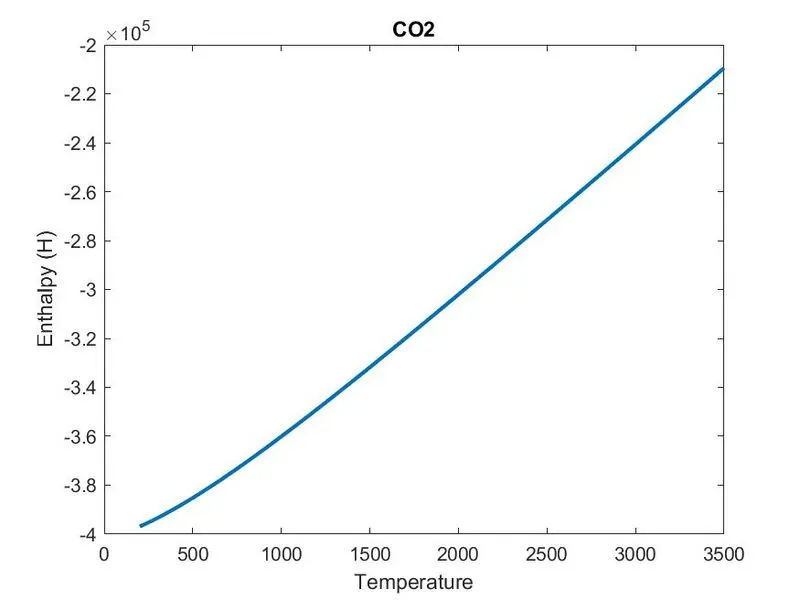
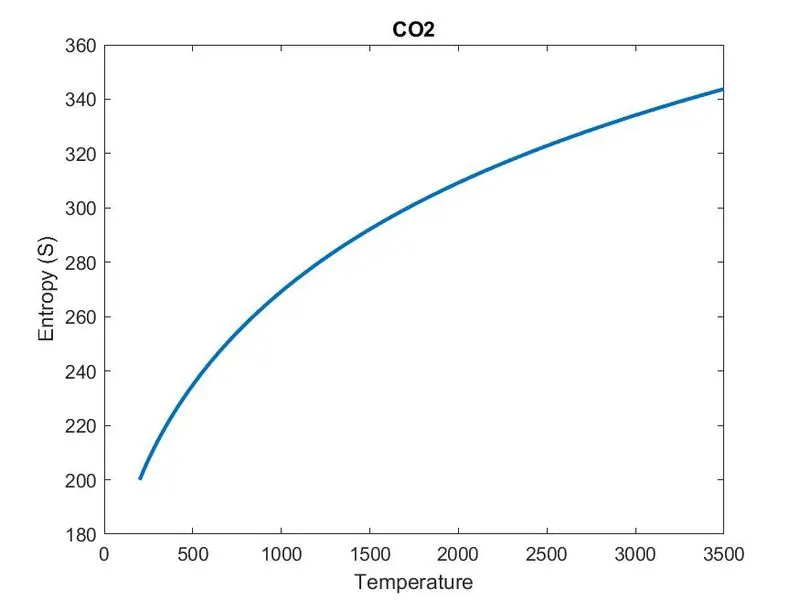
- To plot the specific heat (cp), Enthalpy(H) and Entropy(S) for the specific local temperature range form low-temperature to high-temprature for each species.
- To save the plots as images with appropriate names and put them in separate folders for each species with a suitabel name which will generate automatically.
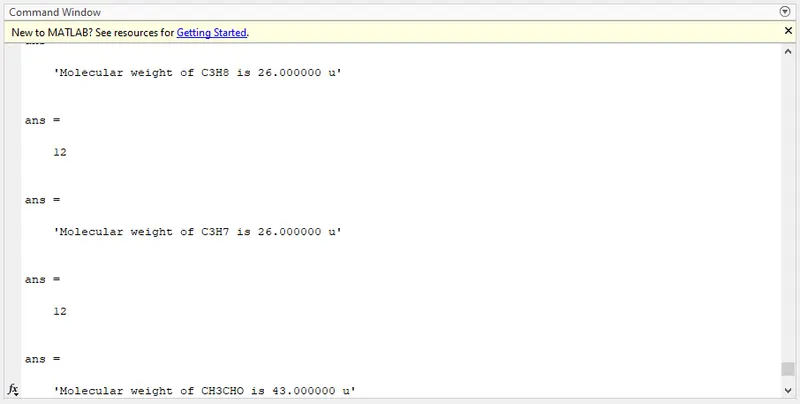
- To calculate the molecular weight of each species and to display it in the command window.
Govering Equation :
The following equation will be used to calculate the values for Cp,H and S.
`Cp/R = a1 + a2 T+ a3 T^2 + a4 T^3+ a5 T^4`
`H/RT = a1 + a2 T/2 +a3 T^2/3+ a4 T^3/4 + a5 T^4/5 + a6 /T`
`S/R = a1 lnT + a2 T + a3 T^2/2 + a4 T^3/3 + a5 T^4/4 +a7`
Where,
R is the universal gas constant
&
T is the temperature
The first 7 coefficients from (a1 to a7 ) are high-temperature coefficients and the second 7 coefficients from (a8 to a14 ) are low-temperature coefficients. The above equation will be the same for low-temperature coefficients.Just replace the a1 to a7 coefficient with the a8 to a14.
Theory :
To parse data or information means to break it down into component parts so that its syntax can be analyzed, categorized and understood to perform the required operation. In this topic, coefficients of the different species will be read to calculate values of specific heat, enthalpy and entropy with its molecular weight.
Hear we are reading all the data from the 'THERMO.date' file which is NASA Thermodynamic Data.
Programming Code :
clear all
close all
clc

Date = fopen('THERMO.dat','r');
fgetl(DATA);

temperature_line = fgetl(DATA);

tem_split = strsplit(temperature_line,' ');

Global_low_temp = str2double(temp_split{2});
Global_med_temp = str2double(temp_split{3});
Global_high_temp = str2double(temp_split{4});

%Skipping the 3 lines

  for s = 2:4
      tline = fgetl(DATA);
  end

  for g = 1:53

a = strsplit(first_ele_line,' ');
l = length(a); % length of string

element_name = (a{1});

loc_lo_temp = str2double(a{l-3});
loc_hi_temp = str2double(a{l-2});
loc_med_temp = str2double(a{l-1});

t1 = loc_lo_temp;
t2 = loc_hi_temp;
t3 = loc_med_temp;

  first_line = fgetl(DATA); % 1st line og coefficient for 0

  % for first line
  loction_E = strfind(first_line,'E'); % Location the E in co efficient of 1st line
  E1 = location_E;

   E1(1); % Individual position number

  % Getting whole value of co efficient

  a1 = first_line(1:E1(1)+3);
  a1 = str2double(a1);

  a2 = first_line(E1(1)+4:E1(2)+3);
  a2 = str2double(a2);

  a3 = first_line(E1(2)+4:E1(3)+3);
  a3 = str2double(a3);

  a4 = first_line(E1(3)+4:E1(4)+3);
  a4 = str2double(a4);

  a5 = first_line(E1(4)+4:E1(5)+3);
  a5 = str2double(a5);

  %for second line

  second_line = fgetl(DATA); %second line of coefficient for 0

  location_E2 = strfind(second_line,'E'); %locating the E in coefficient of first line

  E2 = location_E2;

   E2(1); % Individual position number

  % Getting whole value of coefficient

  a6 = second_line(1:E2(1)+3;
  a6 = str2double(a6);

  a7 = sencod_line(E2(1)+4:E2(2)+3);
  a7 = str2double(a7);

  a8 = second_line(E2(2)+4:E2(3)+3);
  a8 = str2double(a8);

  a9 = second_line(E2(3)+4:E2(4)+3);
  a9 = str2double(a9);

  a10 = second_line(E2(4)+4:E2(5)+3);
  a10 = str2double(a10);

  % For third line

  third_line = fgetl(DATA); third line of coefficientfoe 0

  location_E3 = findstr(third_line,'E'); % location the E in coefficient of first line

  E3 = location_E3;

   E3(1); % Individual position number

  % Getting whol value of coefficient

  a11 = third_line(E3(1)+3);
  a11 = str2double(a11);

  a12 = third_line(E3(1)+4:E3(2)+3);
  a12 = str2double(a12);

  a13 = third_line(E3(2)+4:E3(3)+3;
  a13 = str2doulbe(a13);

  a14 = third_lineE3(3)+4:E3(4)+3;
  a14 = str2doulbe(a14);

  % Enthalpy

  T = linspace(t1,t2,1000);
  R = 8.314 ;

  for m = 1:length(T)
  if T(m) <= t3

     Cp(m) = (a8 + a9*T(m) + a10*T(m)^2 + a11*T(m)^3 + a12*T(m)^4)*R;
     H(m) = (a8+a9*T(m)/2+a10*T(m)^2/3+a11*T(m)^3/4+a12*T(m)^4/5+a13*T(m))*R*T(m);
     S(m) = (a8*log(T(m))+a9*T(m)+a10*T(m)^2/2+a11*T(m)^3/3+a12*T(m)^4/4+a14)*R;


  else

     Cp(m) = (a1 + a2*T(m) + a3*T(m)^2 + a4*T(m)^3 +a5*T(m)^4)*R;
     H(m) = (a1 + a2*T(m)/2 + a3*T(m)^2/3 + a4*T(m)^3/4 + a5*T(m) + a6/T(m))*R*T(m);
     S(m) = (a1*log(T(m))+a2*T(m)+a3*T(m)^2/2+a4*T(m)^3/3+a5*T(m)^4/4+a7)*R;

  end
end

% Creating

mkdir(element_name)
cd(element_name)

% Plotting

figure(1)
plot(T,Cp,'linewidth',2)
xlabel('Temperature');
ylabel('Specific Heat (Cp)');
title(element_name)

saveas(1,'Cpval.jpg')

figure(2)
plot(iT,H,'linewidth',2)
xlabel('Temperature');
ylabelI'Enthalpy (H)');
title(element_name)

saveas(2,'Hval.jpg')

figure(3)
plot(T,S,'linwidth',2)
xlabel('Temperature');
ylabel('Entropy (S)');
title(element_name)

saveas(3,'Sval.jpg')


%finding molecular weight
element =['H','O','C','N','A','S'];
atomic_weight = [1 16 12 14 40 32];
Mo_wt = 0;
for i = 1:length(element_name);
     for j = 1:length(element);
        if strcmp(element_name(i),element(j));
           Mo_wt = Mo_wt + atomic_weight(j);
           position = j;
         end
      end
         n = str2double(element_name(i));
         if n>1
            Mo_wt = Mo_wt + atomic_weight(position);
         end
  end
  sprintf('Molecular weight of %s is %f u',element_name,Mo_wt)
end

 fclose(DATA);
Code Explanation :
- fopen command is used to open and read the data file which is stored in DATA
- fgetl command is used to extract the 1st line of DATA as it contains global temp. The data we get herein terms of combin string, so we use str2double command is used to getinter value from string. This command will give digit converting character property. (Now from here onwards fgetl, strsplit, str2double commands will be used for respe purpose in the code.)
- for loop is use to skip further 3 command line.
- Now for loop is stated for number of iteration from 1 to 53 as there are 53 elements in THRMO.dat file, Which will end after all the execution are don with respective data for every element.
- After the start of the above for loop:- 1st line for each element is called using fgetl command and splitted them with separate string using strsplit command. Length of whole string is defind which will help to local temperature values automatically with use of str2double.
- Again fgetl command is use to get 1st coefficient for respective elements and located the position of E. The purpose of locating the position of E is that with the help of defind position of E, all the coefficient can be extracted using simple formulation. So in the first line of coefficient all 5 coefficient will be call. Now same concept will be use for second coefficient line to extract 5 values an for 3ed line to extract remaining 4 values. In this way all 14 coefficient will be extracted for each specie.
- Now to calculate Cp, H,& S all formulas are specified in the separate for loop, which if-else command is used according to situation mention the problem about the local temperature. If T(m)<=t3 (local medium temperature) them 'if' condition will execute or condition is not satisfy them'else' command will execute automatically in loop for each temperature value for every element.
- Now 'mkdir' command is used to create the folder in the current directiry. Next to that cd command is used to change current folder to new folder to store the plots of graph of every element in separate folder. There will separate folder for every.
- To find the molecular weight of the elements for lopp is executed in which strcmp command is used to compare the logic of string mention in the i and j, If value is match then it returns the values of atomic weight of that particular element will be added, sprintf command is used to display the molecular weight of each element and fclose command is used to close the file.
Output :
- Screenshot of location where folders are saved :

- Plots of Cp, H and S for O2 :
- Plots of Cp, H and S for N2 :
- Plots of Cp, H and S for CO2 :
- Display of 'Molecular Weights' of elements in the ' Command Window' :
CONCLUSION :
Here the data is read and extracted successfully faararom NASA Thermodynamic DATA file for different species and all the values of Cp, H and S are calculated along with plots which are stored in a separate respctive folder for each element. From this, we can conclude that the file can parse in MATLAB to perform the various required operation using the data contained in te files.