Project 1 - Parsing NASA thermodynamic data
Aim
Write a function that extracts the 14 co-efficients and calculates the enthalpy, entropy and specific heats for all the species in the data file. You will be reading this file NASA thermodynamic data
Introduction
PARSING DATA:
Parsing means to make something understandable. For programming this means to convert information represented in one form into another form that's easier to work with. This is done by partially analysing the data, understanding its underlying structure (by making some assumptions based on what you're expecting to see), and then explicitly representing that structure in the code.
• Parsing a file means reading in a data stream of some sort and building an in memory model of the semantic content of that data. This aims at facilitating perfoming some kind of transformation on the data.
Equesions
Final Code
function of Enthalpy
function h_val = enthalpy(a1, a2, a3,a4,a5, a6, a8, a9, a10, al1, a12, a13, midlt, TRange, R)
if (TRange>midlt)
h_val = ( al+ ((a2.*TRange)./2) + ((a3.*(TRange.^2))./3) +((a4 (TRange.^3))./4)+ ((a5.*(TRange.^4))./5) + (a6./TRange)).*(R.*TRange);
else
h_val = ( a8+ ((a9.*TRange)./2) + ((a10.*(TRange.^2))./3) +((a11 .*(TRange.^3))./4)+ ((a12.*(TRange.^4))./5) + (a13./TRange)).*(R.*TRange);
end
end
Function of Entropy
function s_val = entropy (a1, a2, a3, a4, a5, a7, a8, a9, a10, a11, a12, a14, midlt, TRange, R)
if (TRange>midlt)
s_val= ((a1*log(TRange)) + (a2*TRange)+ ((a3*(TRange.^2))/2) + ((a4*(TRange.^3))/3) + ((a5*(TRange.^4))/4) +(a7))*R;
else
s_val= ((a8*log(TRange))+ (a9 *TRange)+ ((a10*(TRange.^2))/2)+((a11*(TRange.^3))/3) +((a12*(TRange.^4))/4) + (a14))*R;
end
end
Function of Specific Heat
function cp_val = specific_heat(a1, a2, a3, a4,a5, a8, a9, a10, a11, a12, midlt, TRange,R)
if (TRange>midlt)
cp_val = (a1+ (a2*TRange) + (a3*(TRange.^2)) + (a4*(TRange.^3)) + (a5*(TRange.^4)))*R;
else
cp_val =(a8+(a9*TRange) + (a10*(TRange.^2)) + (a11*(TRange.^3)) + (a12*(TRange.^4)))*R;
end
end
Function Of Moleculer Weight
function Mol_Weight = MW(get)
Weight = 0;
% input as molecule name
% atoms dealt with H C N g O Ar
% atomic mass 1 12 14 16 40 respectively
%to find molecular weight, we have to compare the atomsbfrom input
atoms = ['H','C', 'N', '0', 'A'];
%Only A taken for Ar since A&R will be contained two positions in get
mass = [1,12,14,16, 40];
%Since we have to compare each characters for mass, using 2 for loop
for i = 1:length(get)
for j = 1:length(atoms)
if strcmpi(get(i), atoms (j))
weight= weight + mass(j);
y= j ;
end
end
%for more number of same atoms in the molecule
number = str2num(get(i));
if (number>1)
% for c2 we have to add mass of c 2 times
%initially since for C, mass is added to mol_weight
% for extra molecule we use (number -1) so adding one more weight Weight = Weight (mass (y)* (number - 1));
end
end
Mol_Weight = Weight;
end
Main Code
clear all
close all
clc
%reading data from the file
thermo = fopen('THERMO.dat','r')
fgetl(thermo);
tempdat=fget1(thermo);
A = strsplit(tempdat,' ');
%Extracting the global temperature range
LowGt = str2num(A{2});
MidGt=str2num (A{3});
HighGt=str2num(A{4});
%Defining variable to store the input from end-user
get=input( 'Enter Species Name', 's');
while~feof(thermo)
data = fget1 (thermo);
a = strsplit(data,' ');
b = a(1);
%Comparing input and data of molecule
match = strcmpi(b, get)
if match == 1
disp('Species Data Available')
%Extracting coefficients of desired moecule
Linel = fgetl(thermo);
SL1= findstr(Line1, 'E');
Coef1 = Line1 (1:SL1(1)+3);
Coef2 = Line1 (SL1(1)+4: SL1 (2)+3);
Coef3=Line1 (SL1 (2)+4: SL1 (3)+3);
Coef4=Line1 (SL1 (3)+4: SL1 (4)+3);
Coef5=Line1 (SL1 (4)+4: SL1 (5)+3);
a1 = str2num(Coef1);
a2 = str2num(Coef2);
a3 = str2num(Coef3);
a4 = str2num(Coef4);
a5= str2num(Coef5);
Line2=fgetl(thermo);
SL2=findstr(Line2, 'E');
Coef6 = Line2 (1: SL2(1)+3);
Coef7 = Line2 (SL2 (1)+4: SL2 (2)+3); Coef8 = Line2 (SL2 (2)+4: SL2 (3)+3);
Coef9=Line2 (SL2 (3)+4: SL2(4)+3);
Coef10 = Line2 (SL2 (4)+4: SL2 (5)+3);
a6= str2num(Coef6);
a7 = str2num(Coef7);
a8 = str2num (Coef8);
a9 = str2num (Coef9);
a10= str2num (Coef10);
Line3 =fgetl(thermo);
str= findstr(Line3, 'E');
SL3= findstr(Line3, 'E');
Coef11 = Line3 (1: SL3 (1)+3);
Coef12= Line3 (SL3 (1)+4: SL3(2)+3);
Coef13=Line3 (SL3 (2)+4: SL3(3)+3);
Coef14= Line3 (SL3 (3)+4: SL3(4)+3);
a11=str2num (Coef11);
a12= str2num(Coef12);
a13=str2num (Coef13);
a14=str2num(Coef14);
%Extracting the local temperature range of the input molecule
mlt= a(end-1);
midlt=str2double(mlt);
hlt = a(end-2);
highlt=str2double(hlt);
11t= a(end-3);
lowlt = str2double (llt);
break
elseif match == 0
disp('Species Data Not Available')
else
continue
end
end
f = upper (get);
%Displaying Molecular Weight of the input molecule.
moleweight=MW(get);
disp('Molecule Entered')
disp(f)
disp('Molecular weight')
disp(moleweight)
TRange = linspace(100, 10000, 9000);
R = 8.314;
%Obtaining value of SPECIFIC HEAT
cp = specific_heat (a1, a2, a3, a4, a5, a8, a9, a10, all, a12,midlt, TRange, R);
%Obtaining value of ENTROPY
s = entropy (a1, a2, a3,a4, a5, a7, a8, a9, ale, all, a12, a14, midlt, TRange, R);
%Obtaining value of ENTHALPY
h = enthalpy (a1, a2, a3, a4, a5, a6, a8, a9, a10, a11, a12, a13, midlt, TRange, R);
%creating directory to store the plots
mkdir (f)
%Plotting Cp v T
figure(1)
plot(TRange, cp, 'linewidth', 3, 'color', 'r')
grid on
xlabel('Temperature')
ylabel('Specific Heat (J/K)')
title(f)
%Plotting S VT
figure(2)
plot (TRange, s, 'linewidth', 3, 'color', 'b')
grid on
xlabel('Temperature')
ylabel('Entropy (J/K)')
title(f)
%Plotting hv T
figure(3)
plot(TRange, h, 'linewidth', 3, 'color','g')
grid on
xlabel('Temperature')
ylabel('Enthalpy (J/kg)')
title(f)
%Defining current folder
cd(f)
%Saving the images to current folder in specified formats
saveas (figure(1), 'Cp vs T.jpg')
saveas (figure (2), 'S vs T.jpg')
saveas (figure(3), 'h vs T.jpg')
%Defining current folder back as parent folder
cd('E:')
%Closing the open files
fclose('all');
Explaination
Initially the value of 'R' is being defined. • Then we use a command to open the file 'THERMO.dat.
• Further we use the 'fget!' to start reading the lines and after reading the first two lines, from the second line converting the strings to numbers and assigning global (low,mid and high) temperatures.
• Then we have written a command to get the temperature range for calculation and plotting purpose. Then again using the fgetl command to go to thel next 3 lines and skipping it.
• Then we use a for loop to get 53 species and their temperatures (low, mid, high) and the 14 coefficients.
• In the for loop we again use the fgetl command and then the next line is read and from that line the species name, the three local temperatures are read and stored.
Then we use fgetl command to go to further line and get the first 7 coefficients and store them. Similarly
using the fgetl command we move to the next two lines and get the remaining coefficients.
Then after getting the 14 coefficients, we use these coefficients and by calling the functions we calculate
Further we use the Molecular weight function and calculate molecular weight for that species.
. Further I have used a command to change the directory so that I can save the files at a particular location.After changing the directory I have used 'mkdir' to create a new folder with the name of the current species and then a 'cd' command to make mkdir as the current directory.
Then further we use plot command to plot temperature vs (cp,enthalpy entropy). In this plotting we use the figure command to get the three different plots and saveas command to save the figures in the
• Then again we change our directory to again start the loop. So the loop continues to function till we get all
the 53 species and then gets terminated.
Output
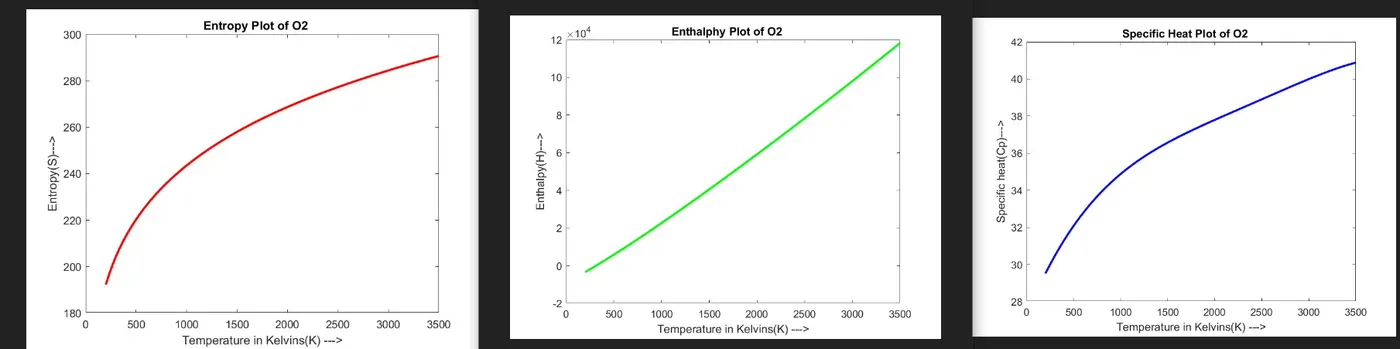
- O2 plot
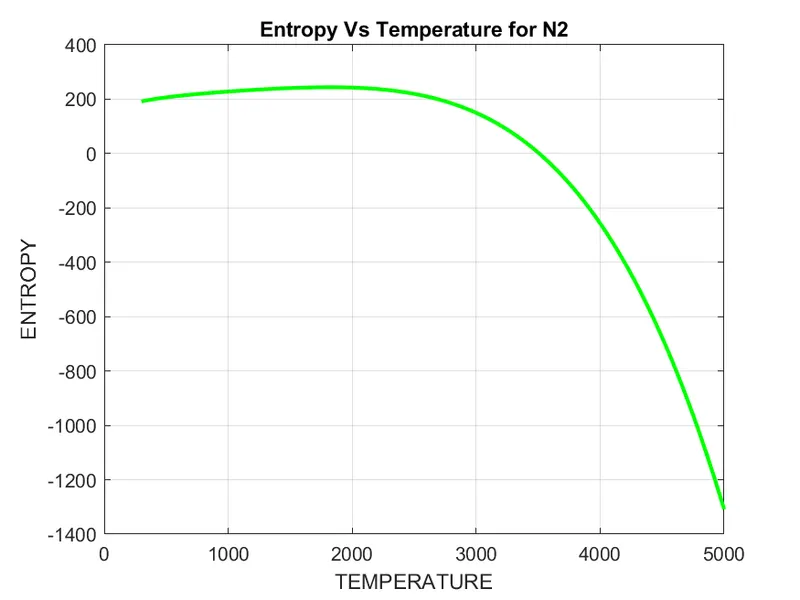
N2(Entropy vs temperature)
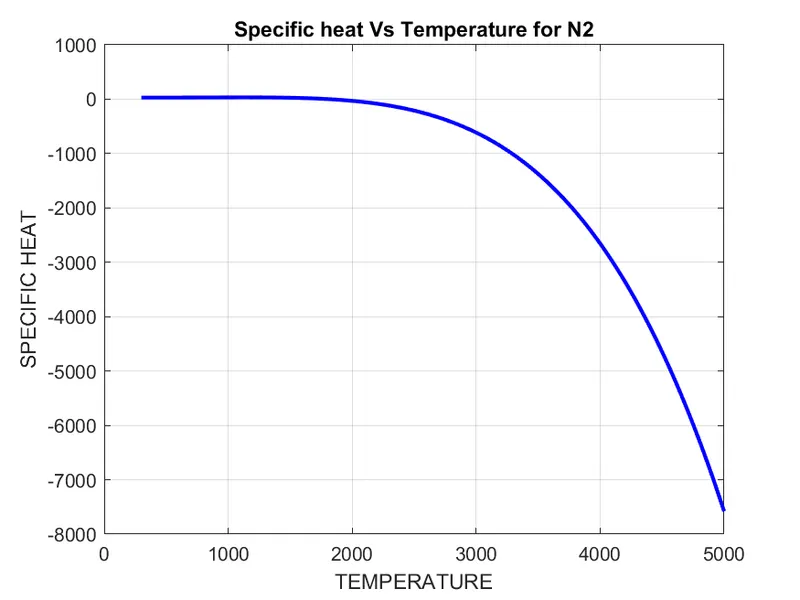
N2(Specific Heat vs temperature)
N2(Entropy vs Temperature)
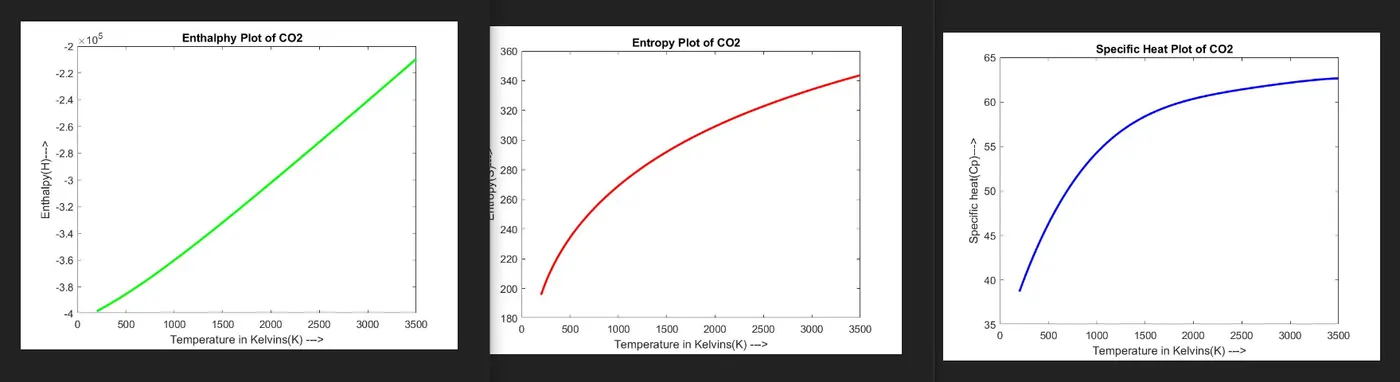
CO2 Plot