Project 1 - Parsing NASA thermodynamic data
PROJECT 1 - PARSING NASA THERMODYNAMIC DATA
AIM:To write a code in matlab to parse the NASA thermodynamic data file and then calculate the thermodynamic properties of various gas species.
OBJECTIVES:
* Write a function that extracts the 14 coefficients and calculates the enthalpy,entropy,and specific in the data file.
* Calculate the molecular weight of each species and display it in the command window.
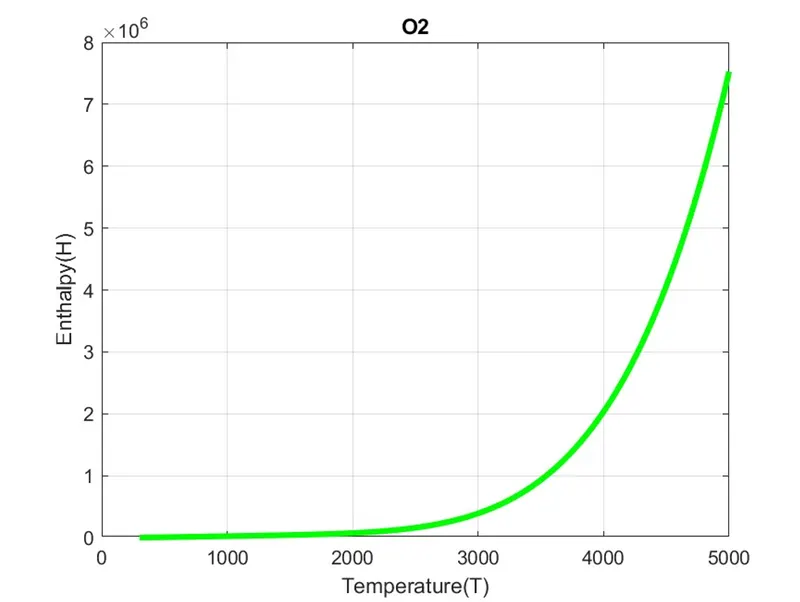
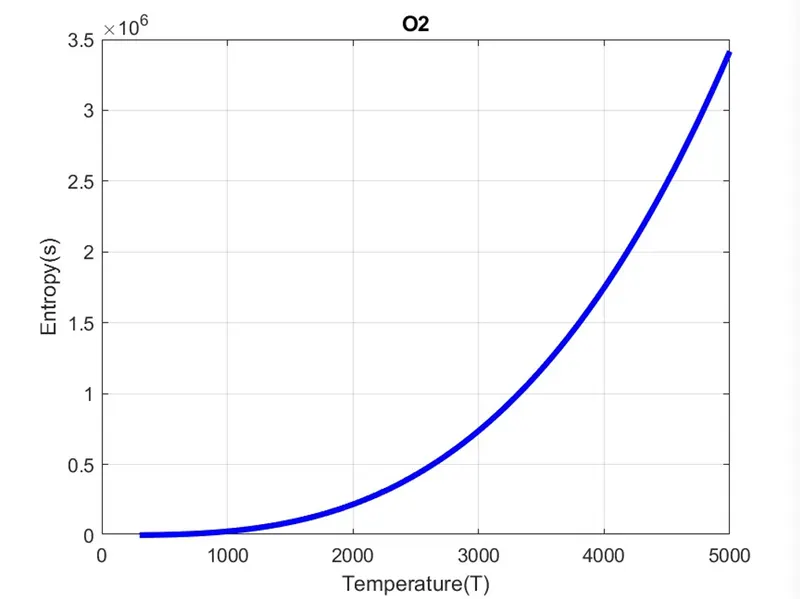
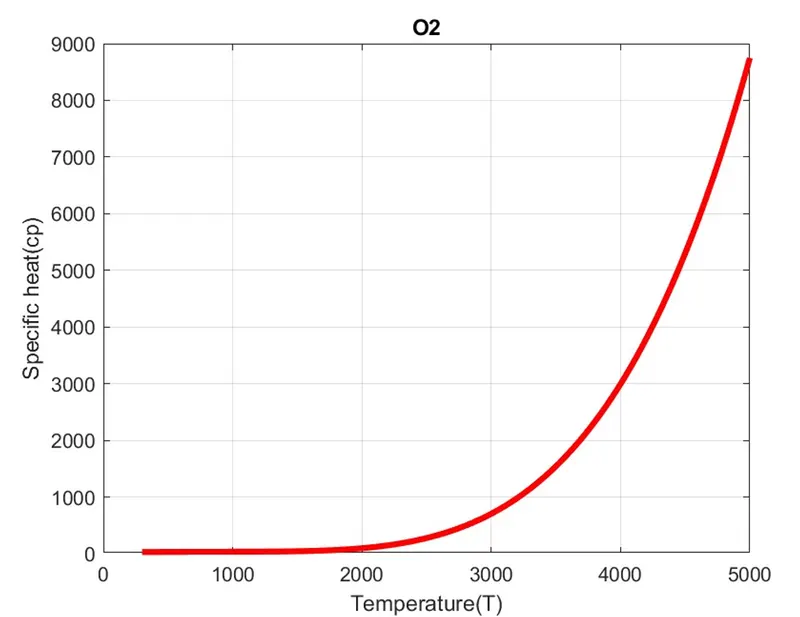
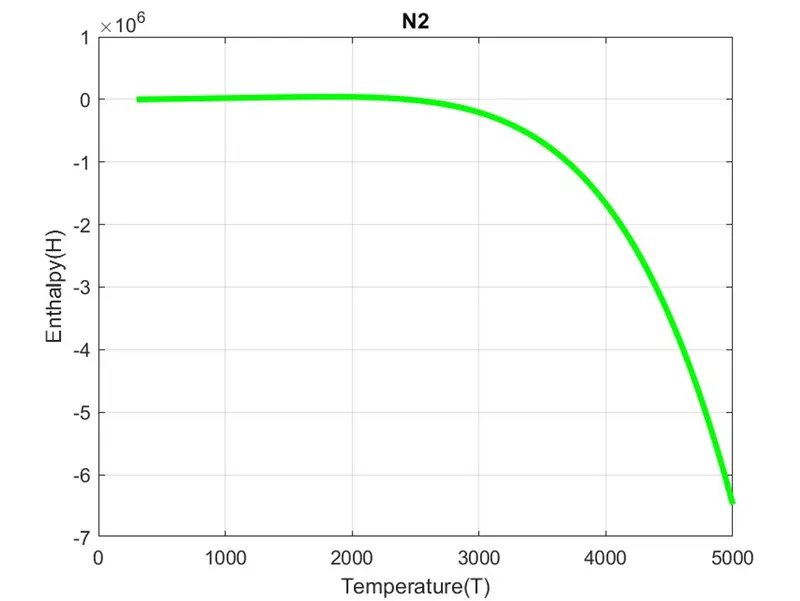
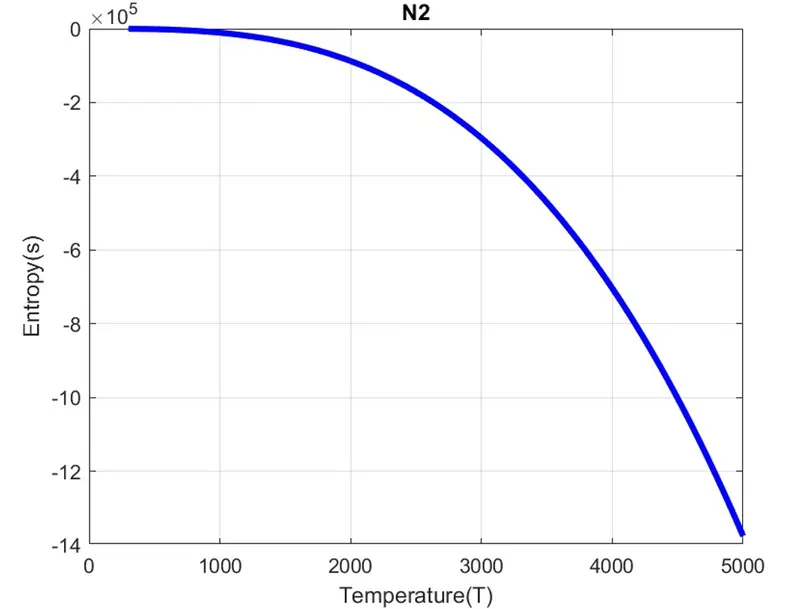
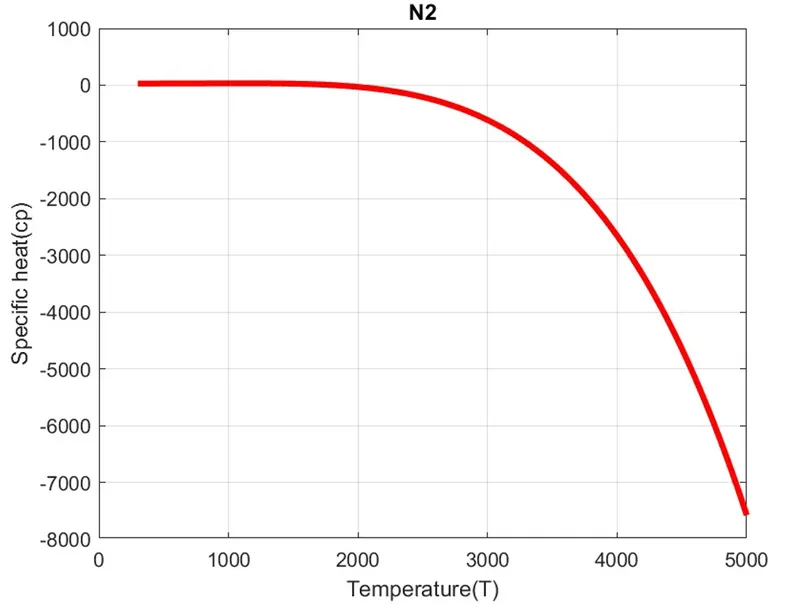
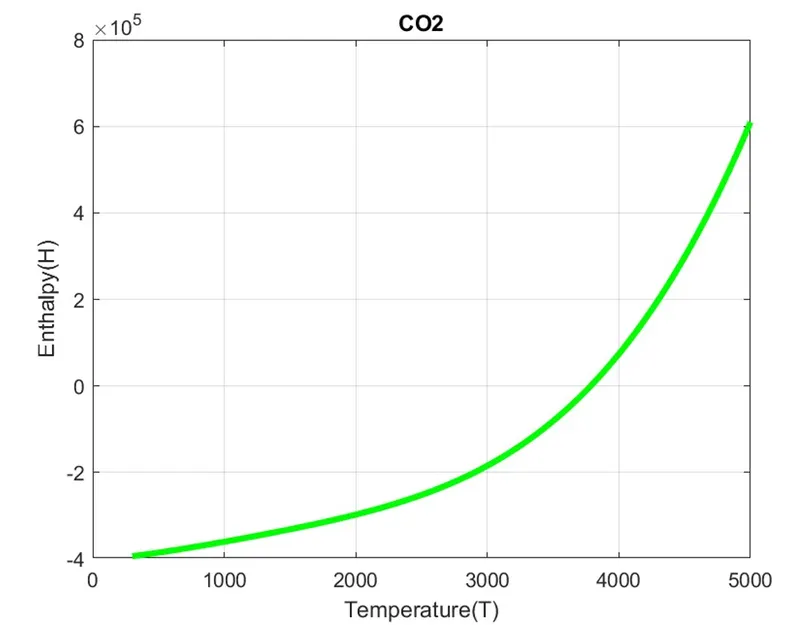
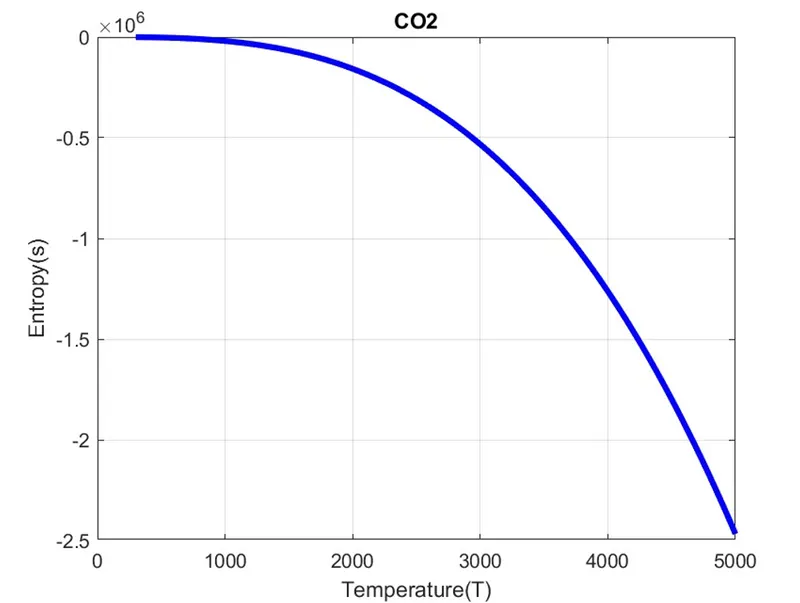
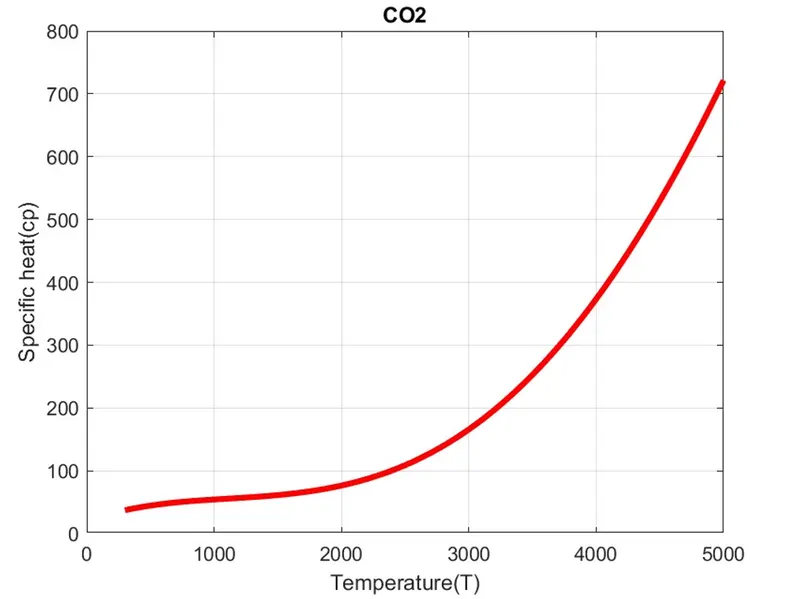
* Plot the cp,Enthalpy,and Entropy for the local temperature range (low temperature:high temperature)specific for each species.
* Save the plot as images with appropiate names and dump them in separate folders for each species with a suitable name.All these should be generated automatically.
* The main program that you will submit will just take the "THERMO.dat"file as an input and generate CP,H,and S plots.
* Screenshot of the window where all the folders are saved.
* plots for O2,N2,and CO2 species.
THEORY:
FILE PARSING : File parsing is the process of analyzing a string symbol in natural language computer languages or data structures,conforming to the rules of formal grammar.The term parsing comes from latin pars(orationis),meaning part (of speech).Within computational linguistics the term is used to refer to the formal analysis by a computer of a sentence or other sring of words into its consitituents,resulting in a parse tree showing their syntactic relation to each other , which may also contian sematic and other inforamtion.
* Some parsing algorithms may generate a parse forest or list of parse trees for a syntactically ambiguous input.
* parsing a file means reading in a data stream of some sort and building an in memory model of the sematics contect of the data.
* This aims at facilitating performing some kind of transforamtion on the data.
ENTHALPY : Enthalpy is a thermodynamic proprty of a system.It is the sum of the interal energy added to the product of the pressure and volume of the system.It reflects the capacity to do non-mechanical work and the capacity to release heat.
H/RT = a1+a2 T/2 + a3 T^2/3 + a4 T^3/4 + a5 T^4/5 +a6/T
ENTROPY : Enthalpy,a property of a thermodynamic system, is equal to the system's thermal energy per unit temperature that is unavailable for doing useful work.Because work is obtained from ordered molecular motion,the amount of entropy is also a measure of the molucular disorder ,(or)randomness of a system.
S/R = a1 1nT + a2 T + a3 T^2/2 + a4 T^3/3 + a5 T^4/4 +a7
SPECIFIC HEAT (Cp) : It is the quality of heat required to raise the temperature of a boby by 1 degree to that required raise the temperature of an equal mass of water by one degree.
CP/R = a1 + a2 T + a3 T^2 + a4 T^3 +a5 T^4
MAIN CODE EXPLANATION :
* I have used 'fopen'command to open nasa's experimental data.
* If you open experimental data and analyze what's happening ,we can easily code it according to our requiredments.
* 1st line consists of text (THERMO).I gave 'fgetl'command to read the 1st.
* Second-line consist of 3 temperature values.Like 1st line use 'fgetl'to read the 2nd line and store it in variable global_temp.
* Second-line consists of 3 temperature values.Like 1st line use 'fgetl'to read the 2nd line,I have used 'strplit'command using 'bland space'as a delimiter.'strsplit'splits the data using the given delimiter.Therefore,temp_range consists of all 3 temperature values in a vector.
* Now,obtain the global minimum,medium,and maximum temperatures from the split data, use 'str2num'as this converts character array to numeric array.
* Then create a vector of 400 evenly spaced temperature points using 'linspace'command and provide universal gas constant value.
* 3rd,4th & 5th lines in the data are comments. Use 'fgetl'again for reading those 3 lines.
* From line '6'to line '281',there are a set of 4 lines.1st line consists of the name of species 2nd,3rd,4th lines consist of experimental data.
* Now,I Will explain the code for these 4 lines of data.
* LINE1-I have read line '6'using 'fget'and stored it in line 1 variable.
* I have used'6'using 'strtok'command to get the selected parts of the string (i.e,species name 'O')
* LINE2-I have read line '7'using 'fgetl'and stored it in line 2 varible.
* Use 'strfind'command to find place of 'E'in line 7,'strfind'is used to find strings within other strings.Now store them in array named'A'.
* Similary,follow these steps for the next 2 lines.Then ,you will get A,B,C array respectively.
* Now,extract all the coeefficient(a1,a2,a3,a4,a5,a6,a7,b1,b2,b3,b4,b5,b6,b7)using 'STR2NUM'command.
* All this process should be done again for be done again for line 7 to line 212.Therefore,I have created a 'for-loop' for all the 53 species.
* Now ,create function for calculating specific heat,enthalpy,and entropy.
* For entropy function,if the temperature is less than or equal to global medium temperature it will take 1st six high-temperature values,otherwise,it will take the next six vales.
* Similarly,create function for specific heat and enthalpy use the respective formula to create function.

OUTPUT:
Molecular Weight of O:15
Molecular Weight of O2:30
Molecular Weight of H:1
Molecular Weight of H2:2
Molecular Weight of OH:16
Molecular Weight of H2O:17
Molecular Weight of HO2:31
Molecular Weight of H2O2:32
Molecular Weight of C:12
Molecular Weight of CH:13
Molecular Weight of CH2:14
Molecular Weight of CH2(S):14
Molecular Weight of CH3:15
Molecular Weight of CH4:16
Molecular Weight of CO:27
Molecular Weight of CO2:42
Molecular Weight of HCO:28
Molecular Weight of CH2OH:30
Molecular Weight of CH3O:30
Molecular Weight of CH3OH:31
Molecular Weight of C2H:25
Molecular Weight of C2H2:26
Molecular Weight of C2H3:27
Molecular Weight of C2H4:28
Molecular Weight of C2H5:29
Molecular Weight of C2H6:30
Molecular Weight of CH2CO:41
Molecular Weight of HCCO:40
Molecular Weight of HCCOH:41
Molecular Weight of H2CN:28
Molecular Weight of HCN:27
Molecular Weight of HNO:30
Molecular Weight of N:14
Molecular Weight of NNH:29
Molecular Weight of N2O:43
Molecular Weight of NH:15
Molecular Weight of NH2:16
Molecular Weight of NH3:17
Molecular Weight of NO:29
Molecular Weight of NO2:44
Molecular Weight of HCNO:42
Molecular Weight of HOCN:42
Molecular Weight of HNCO:42
Molecular Weight of NCO:41
Molecular Weight of CN:26
Molecular Weight of HCNN:41
Molecular Weight of N2:28
Molecular Weight of AR:39
Molecular Weight of C3H8:44
Molecular Weight of C3H7:43
Molecular Weight of CH3CHO:43
Molecular Weight of CH2CHO:42