Project 1 - Parsing NASA thermodynamic data
The aim of this project is to read the NASA thermodynamic data file and extract the given details and to find out enthalpy, entropy, specific heats and molecular weight of each molecules with plots for the local temperature range.
In order to do the project this is split as follows,
- A function that extracts the 14 coefficients and calculates the enthalpy, entropy and specific heats for all the species by reading the NASA thermodynamic data file.
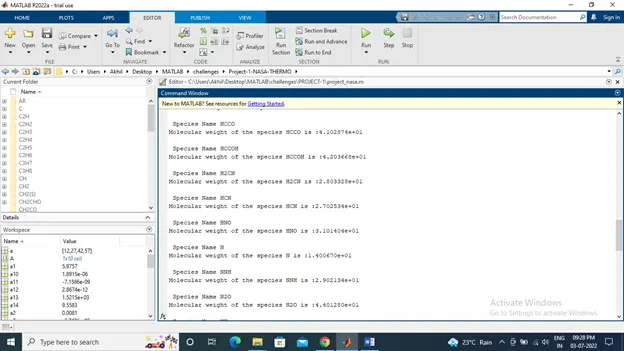
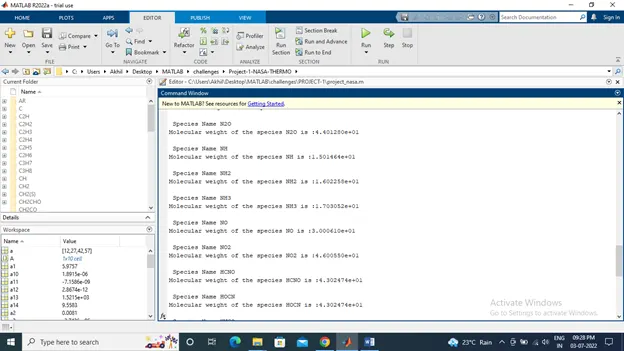
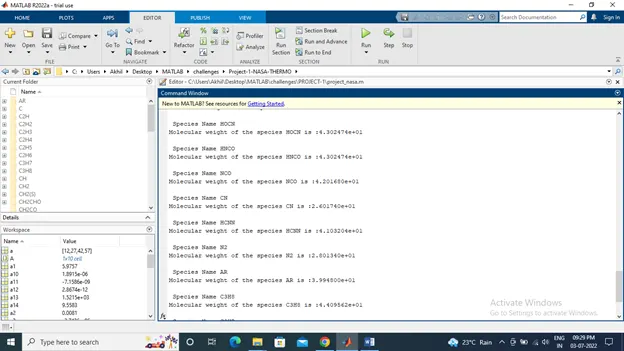
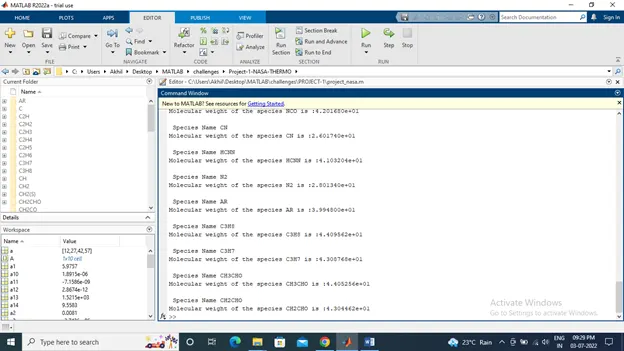
- Calculate the molecular weight of each species and display it in the command window.
- Plot the Cp, Enthalpy and Entropy for the local temperature range (low temperature : high temperature) specific for each species.
- Save the plots as images with appropriate names and dump them in separate folders for each species with suitable name. All these should be generated automatically.
- The main program will just take the "THERMO.dat" file as an input and generate Cp, H and S plots.
- Write a detailed report to describe the logic.
Before starting the coding we have to look into the brief explanation of the below topics.
Enthalpy (H)
In thermodynamics, enthalpy is the measure of energy in a thermodynamic system. It is the thermodynamic quantity equivalent to the total heat content of a system or Enthalpy(H) is the sum of the internal energy(U) and the product of pressure(P) and volume(V).
Enthalpy H can be written as, H = U + pV
`H/RT=a1+a2T/2+(a3T^2)/3+(a4T^3)/4+(a5T^4)/5+a6/T`
Entropy(S)
Entropy, the measure of a system's thermal energy per unit temperature that is unavailable for doing useful work. In terms of thermodynamic work, entropy is defined as proportional to the amount of work done in the system and surroundings.
S=Q/T
`S/R=a1 logT+a2T+(a3T^2)/2+(a4T^3)/3+(a5T^4)/4+a7`
Specific heat capacity(Cp)
specific heat, the quantity of heat required to raise the temperature of one gram of a substance by one Celsius degree.
Q= mcΔT
`Cp/R=a1+a2T+a3T^2+a4T^3+a5T^4`
Molecular weight (m)
Molecular weight, also called molecular mass is a measure of the sum of the atomic weight values of the atoms in a molecule: it is measured in daltons (Da or u).
Atomic mass (ma or m)
The atomic mass (ma or m) is the mass of an atom. Although the SI unit of mass is the kilogram (kg).
Universal gas constant (R)
The gas constant is a physical constant denoted by R and is expressed in terms of units of energy per temperature increment per mole. It is also known as Ideal gas constant or molar gas constant or universal gas constant.
R=8.315
By using the below equations we can calculate the Enthalpy, Entropy and specific heat capacity respectively.
`H/RT=a1+a2T/2+(a3T^2)/3+(a4T^3)/4+(a5T^4)/5+a6/T`
`S/R=a1 logT+a2T+(a3T^2)/2+(a4T^3)/3+(a5T^4)/4+a7`
`Cp/R=a1+a2T+a3T^2+a4T^3+a5T^4`
1) Main code for read and extracts the 14 coefficients and calculates the enthalpy, entropy and specific heats for all the species and plots for the local temperature range.
% project-1 NASA Thermodynamic data
clear all
close all
clc
% Opening the data file
f1=fopen('THERMO.dat','r');
% reading the first line
fgetl(f1);
% reading the details in the header
Global_Temp=fgetl(f1);
Temp=strsplit(Global_Temp);

% splitting the temp range
Global_low_Temp=str2double(Temp{2});
Global_mid_Temp=str2double(Temp{3});
Global_high_Temp=str2double(Temp{4});

% Assigning the value of universal gas constant R
R=8.3145;

% skipping the command lines
for i=1:3
    fgetl(f1);
end

% Reading the entire species
for i=1:53
SP=fgetl(f1);
A=strsplit(SP,' ');
species=(A{1});

% To find the Local temperature range
Local_low_Temp=str2double(A(end-3));
Local_mid_Temp=str2double(A(end-1));
Local_high_Temp=str2double(A(end-2));

% Initiating the Local temp range
T=linspace(Local_low_Temp,Local_high_Temp,Local_mid_Temp);

% reading the coefficient of species
line_7=fgetl(f1);
% identify the position of expontentional E in the coefficient
a=strfind(line_7,'E');

% Extracting the temperature coefficients of species
% and converting the string value in to numbers
a1=line_7(1:a(1)+3);
a1=str2double(a1);
a2=line_7(a(1)+4:a(2)+3);
a2=str2double(a2);
a3=line_7(a(2)+4:a(3)+3);
a3=str2double(a3);
a4=line_7(a(3)+4:a(4)+3);
a4=str2double(a4);
a5=line_7(a(4)+4:a(5)+3);
a5=str2double(a5);

line_8=fgetl(f1);
a=strfind(line_8,'E');
a6=line_8(1:a(1)+3);
a6=str2double(a6);
a7=line_8(a(1)+4:a(2)+3);
a7=str2double(a7);
a8=line_8(a(2)+4:a(3)+3);
a8=str2double(a8);
a9=line_8(a(3)+4:a(4)+3);
a9=str2double(a9);
a10=line_8(a(4)+4:a(5)+3);
a10=str2double(a10);

line_9=fgetl(f1);
a=strfind(line_9,'E');
a11=line_9(1:a(1)+3);
a11=str2double(a11);
a12=line_9(a(1)+4:a(2)+3);
a12=str2double(a12);
a13=line_9(a(2)+4:a(3)+3);
a13=str2double(a13);
a14=line_9(a(3)+4:a(4)+3);
a14=str2double(a14);

% To find the Enthalpy
H=Enthalpy(a1,a2,a3,a4,a5,a6,a7,a8,a9,a10,a11,a12,a13,T,R,Local_mid_Temp);

% To find the Entropy
S=Entropy(a1,a2,a3,a4,a5,a6,a7,a8,a9,a10,a11,a12,a13,a14,T,R,Local_mid_Temp);

% To find the Specific heat capacity
cp=Specific_heat_capacity(a1,a2,a3,a4,a5,a6,a7,a8,a9,a10,a11,a12,T,R,Local_mid_Temp);

% To find the molecular weight of the species and writing the same
Molecular_wt(i)=molecular_weight(species);

% creating a list of species with it's molecular weight
M_List=fopen('Molecular weight.txt','w');
fprintf(M_List,'Molecular weight of the species %s is %f \n',species,Molecular_wt);
fclose(M_List);

% To create a directory
% Creating a folder for each species
current_dir=pwd;
mkdir(species);
cd(species);

% Plotting and saving
% Plot-1 Enthalpy vs Temperature
figure(1)
plot(T,H,'linewidth',3,'Color','r');
xlabel('Temperature [K]');
ylabel('Enthalpy [KJ/mol]');
title(sprintf('Enthalpy vs Temperature of %s',species));
grid on;
saveas(figure(1),'Enthalpy.jpg');

% Plot-2 Entropy vs Temperature
figure(2)
plot(T,S,'linewidth',3,'color','g');
xlabel('Temperature [k]');
ylabel('Entropy [KJ/mol-k]');
title(sprintf('Entropy vs Temperature of %s',species));
grid on;
saveas(figure(2),'Entropy.jpg');

% plot-3 Specific heat vs Temperature
figure(3)
plot(T,cp,'linewidth',3,'color','b');
xlabel('Temperature [K]');
ylabel('Specific heat capacity [KJ]');
title(sprintf('Specific Heat Capacity vs Temperature of %s',species));
grid on;
saveas(figure(3),'specific heat capacity.jpg');

cd(current_dir);
end- File parsing can be done by using the commands 'fopen' to open the file and 'fgetl' to read the file.
- By using 'fgetl' command we can read the first line in the data file and if we repeat the 'fgetl' command it will goes to the next line and read the data. by repeating the same command we can read the entire data in the file.
- The second line reads the global temperature range and which is not using in any part of this coding as we are using local temperature range for calculating enthalpy, entropy, specific heat capacity of the species.
- Next step is to enter universal gas constant value.
- Skipping the command lines 3,4,5 in the data file by using for loop and 'fgetl'.
- The sixth line will give us the species name and the local temperature range of that particular species, these data can be further separated by using the 'strsplit' command.
- We can easily identify the position of species in the string and by assigning it to a variable we can read the species name and by using the same method we can find out the local temperature range.
- The local temperature range are in strings in the data file which cannot be used for mathematical calculations and thus we convert this into numbers by using 'str2double' or by using 'str2num'.
- By using for loop this process is repeated for all the 53 species in the data file and thus we can obtain the species name and individual local temperature range.
- Now the next three lines will give us the temperature coefficients, the first seven are higher and the next seven are lower temperature coefficients.We can read the same on each line by identifing the position of exponential 'E' by using 'strfind'.
- Then we will assigning all the 14 equivalent values to the variables and converting it into numbers by using 'str2double'.
- Thus by obtaining all the 14 coefficients we can calculate the enthalpy, entropy, specific heat capacity, molecular weight by using calling the functions.
- Now we are writing the executed molecular weight of all the species in to a data file by using 'fopen' command.
- The next step is to create a directory by using and save plots of each species in a separate folder.
- 'pwd' command will identify the current directory.
- 'mkdir' will create a new directory.
- 'cd' to change the working directory.
2) The function code to calculate the Enthalpy of the species
function H=Enthalpy(a1,a2,a3,a4,a5,a6,a7,a8,a9,a10,a11,a12,a13,T,R,Local_mid_Temp)

% Enthalpy calculation H/RT=a1+a2T/2+a3T^2/3+a4T^3/4+a5T^4/5+a6/T
% enthalpy for low temperature coefficients
if T<=Local_mid_Temp
    H=(a8+((a9*T)/2)+((a10*((T).^2))/3)+((a11*((T).^3))/4)+((a12*((T).^4))/5)+(a13./T))*R.*T;

else
    % enthalpy for high temperature coefficients
    H=(a1+((a2*T)/2)+((a3*((T).^2))/3)+((a4*((T).^3))/4)+((a5*((T).^4))/5)+(a6./T))*R.*T;
end
end
By using the given formula we are calculating the Enthalpy for high and low temperature coefficients.
It is mandatory that the function name and the folder name should be same and while calling the function all the variables should match to enable work the program properly.
3) The function code to calculate the Entropy of the species
function S=Entropy(a1,a2,a3,a4,a5,a6,a7,a8,a9,a10,a11,a12,a13,a14,T,R,Local_mid_Temp)

% Entropy calculation S/R=a1*lnT+a2*T+a3*T^2/2+a4*T^3/3+a5*T^4/4+a7
% entropy for low temperature coefficients
if T<=Local_mid_Temp
    S=R.*((a8.*log(T))+(a9.*T)+((a10*(T).^2)/2)+(a11*((T).^3)/3)+((a12*(T).^4)/4)+a14);
else
    % Entropy for high temperature coefficients
    S=R.*((a1.*log(T))+(a2.*T)+((a3*(T).^2)/2)+(a4*((T).^3)/3)+((a5*(T).^4)/4)+a7);
end
From the above coding we can obtain the Entropy of all the species for their repective high and low temperature coefficients.
4) The function code to calculate the Specific heat capacity of the species.
function cp=Specific_heat_capacity(a1,a2,a3,a4,a5,a6,a7,a8,a9,a10,a11,a12,T,R,Local_mid_Temp)

% To calculate specific heat capacity (cp/R)=a1+a2*T+a3*T^2+a4*T^3+a5*T^4
% specific heat capacity for low temperature coefficients
if T<=Local_mid_Temp
    cp=R*(a8+(a9*T)+(a10*((T).^2))+(a11*((T).^3))+(a12*((T).^4)));
else
    % specific heat capacity for high temperature coefficients
    cp=R*(a1+(a2*T)+(a3*((T).^2))+(a4*((T).^3))+(a5*((T).^4)));
end
The specific heat capacity of all the high and low temperature coefficients of all the species can be find out using the above coding.
5) Function code to calculate the molecular weight of the species
function Molecular_wt=molecular_weight(species)

% To find the molecular weight of species intiating the standard elements
elements=['H','C','N','O','A'];
% standard atomic weight of the respective elements
atomic_wt=[1.00794,12.0107,14.0067,15.9994,39.948];

% Displaying the species name
fprintf('\n Species Name %s \n',species);
% for intial condition assign molecular weight as 0
Molecular_wt=0;

for i=1:length(species)
    for j=1:length(elements)
        if strcmpi(species(i),elements(j))
            Molecular_wt=Molecular_wt+atomic_wt(j);
            position=j;
        end
    end
    n=str2double(species(i));
    if n>1
        Molecular_wt=Molecular_wt+atomic_wt(position)*(n-1)
    end
end
fprintf('Molecular weight of the species %s',species);
fprintf(' is :%d',Molecular_wt);
disp(' ');
end
In order to find out the molecular weight we have to give the atomic weight of the standard elements
molecular mass is a measure of the sum of the atomic weight values of the atom in a molecule.
'fprintf' command is used to read the name of the species in the command window.
'strcmpi' is used to compare the strings.
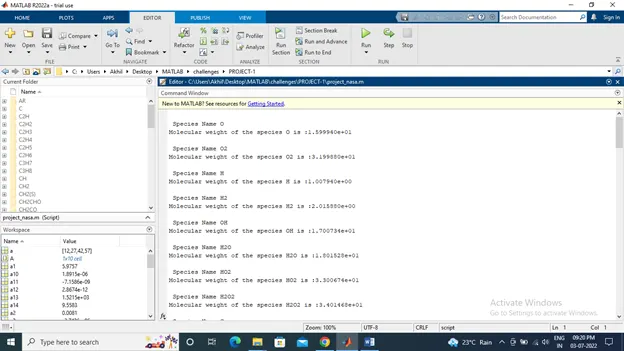
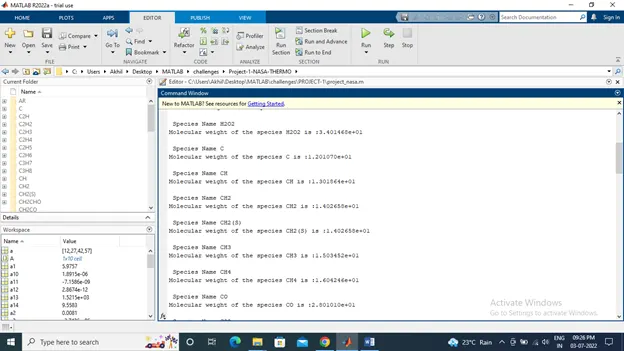
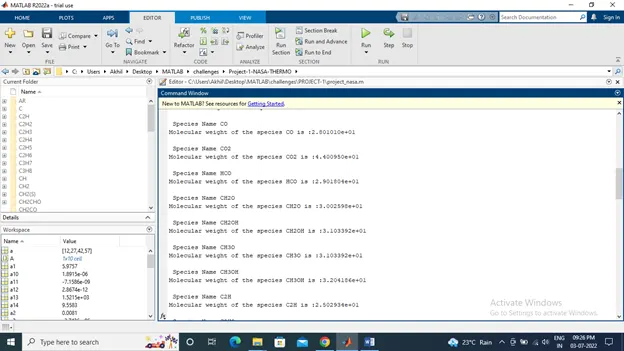
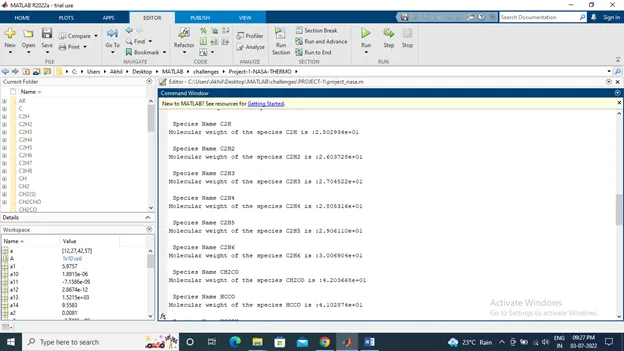
Then by using the 'fprintf' we are displaying the name of species with their molecular weight.
RESULT-1
Below is the output window which shows the molecular weight of species in the command window.
RESULT-2
screenshot of the window which shows the plots as images with appropriate names and in separate folders for each species with suitable name generated automatically.

RESULT-3
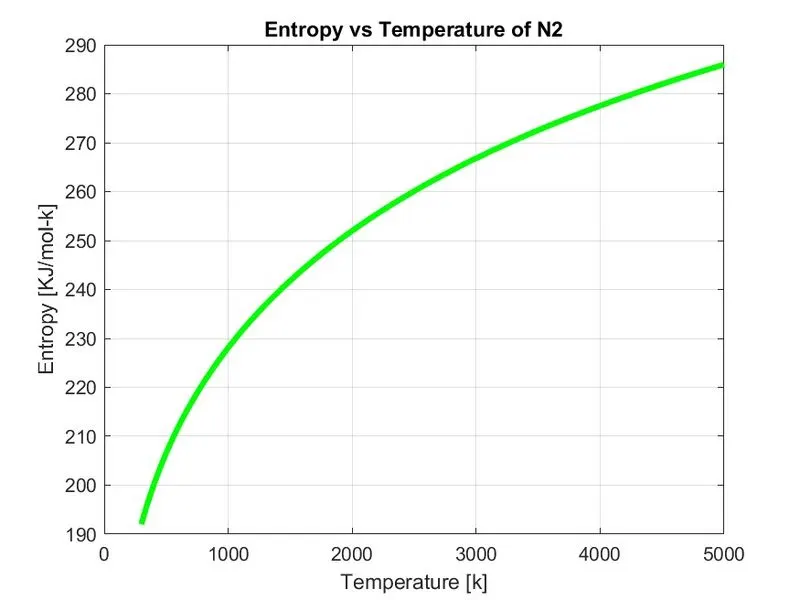
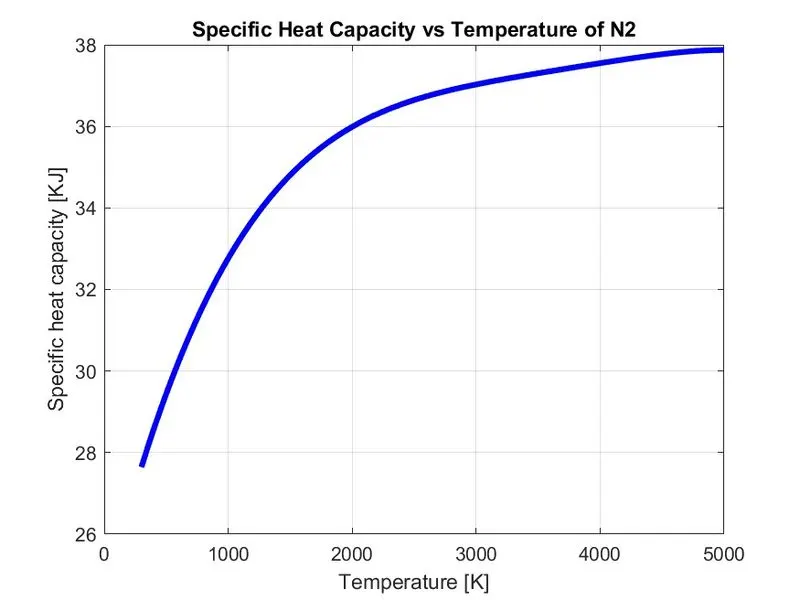
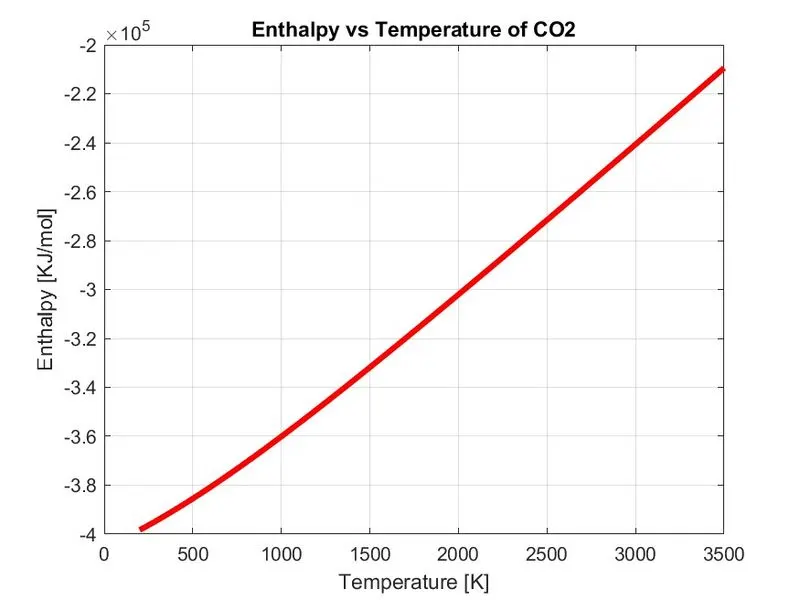
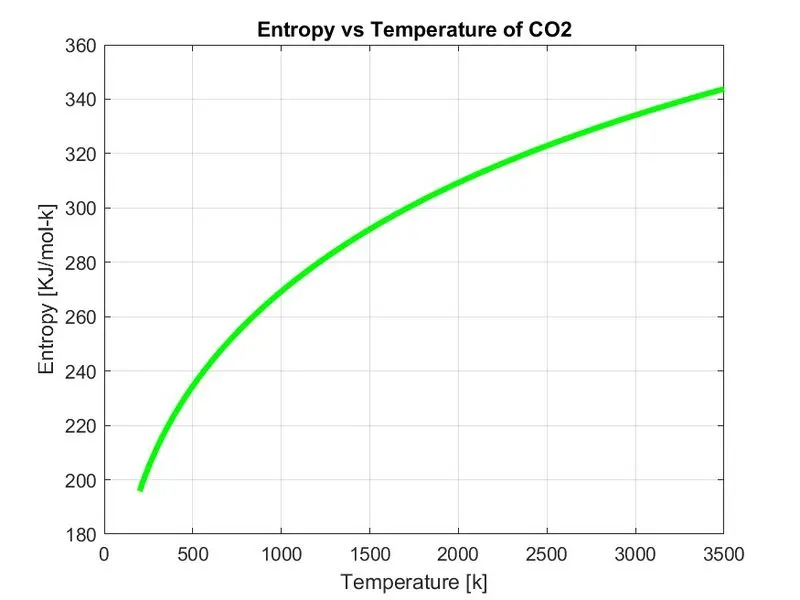
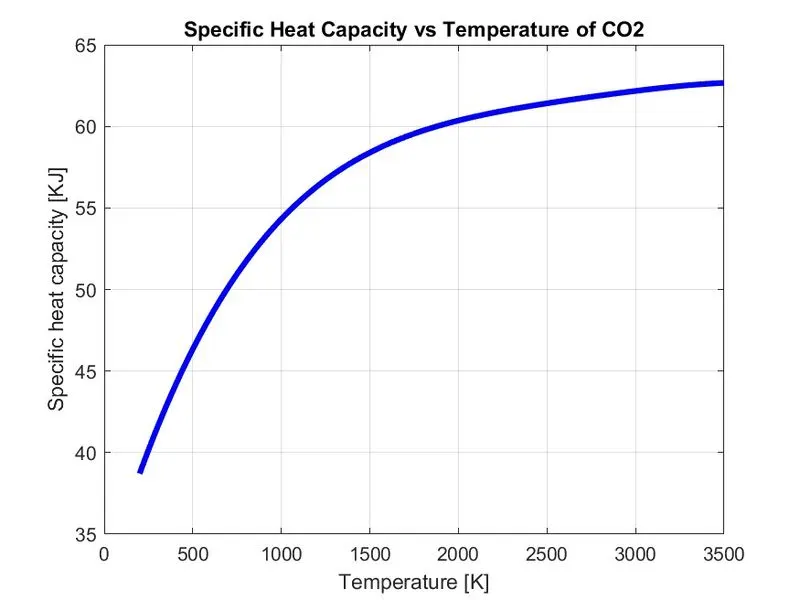
Output plots of three species O2,N2 and CO2
1) Output Plots of species O2
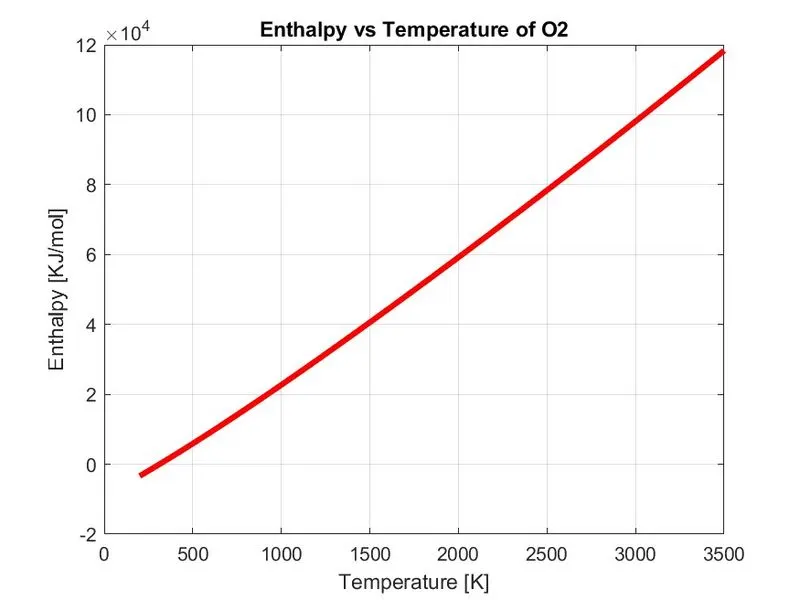
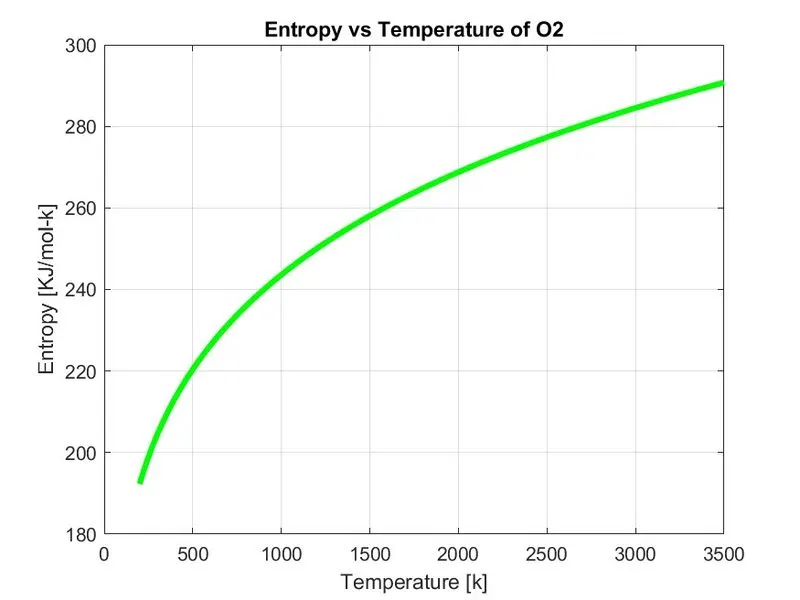
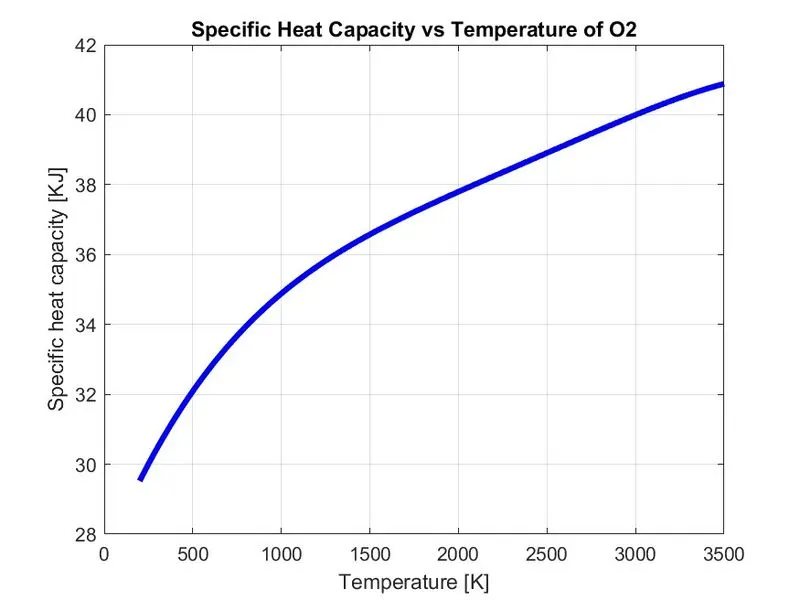
2) OUTPUT PLOT OF SPECIES N2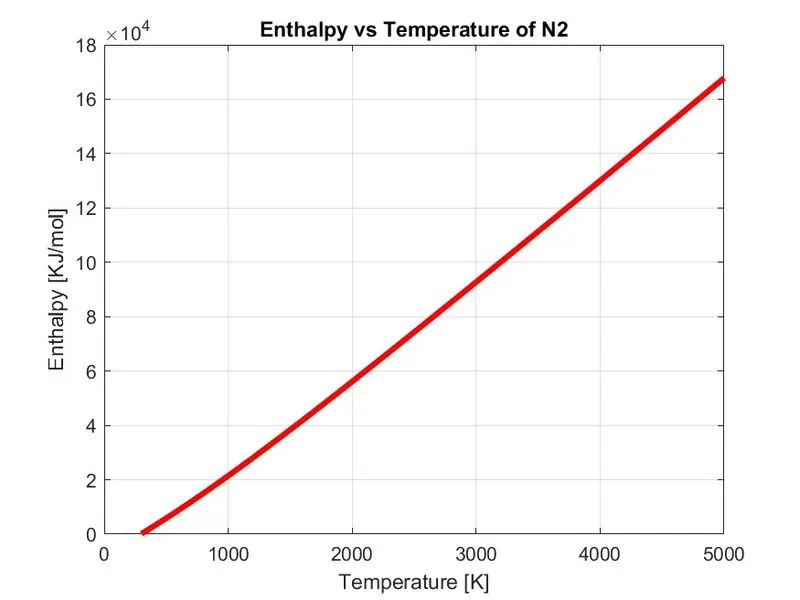
3) OUTPUT PLOT OF SPECIES CO2
- Error occured during the development of program.
Incorrect dimension for matrix multiplication.
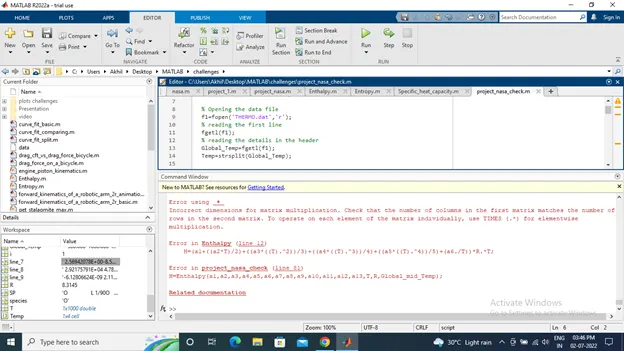
First i have checked the function which calculates the enthalpy of the species, try to do lot of modification in the equation in elementwise operator but it doesn't work at all. Then I go to the main program and review the coding and workspace, in the workspace i have noticed that the value assigned to the coefficients are character 'ch' not a number so it will not do the operations in the function.
By using 'str2double' I have converted the string to number and assign it into the variables (a1 to a14) thus the code is perfectly worked and executed my code as well.
conclusion
By using various inbuilt command in MATLAB we can read, write and extract the data in the file and do the various operations successfully without copy and pasting the same data in the program. Thus we can save our time and do working a bulk or huge file in a short time with high accuracy.
References:
https://in.mathworks.com/products/matlab/programming-with-matlab.html
https://skill-lync.com/premium/coursevideos/74154/en/34
https://byjus.com/chemistry/atomic-mass-molecular-mass/
https://www.grc.nasa.gov/www/k-12/airplane/enthalpy.html
https://www.vedantu.com/chemistry/entropy-change
https://testbook.com/learn/thermodynamics-entropy/
https://www.engineeringtoolbox.com/individual-universal-gas-constant-d_588.html
https://in.mathworks.com/search.html?c%5B%5D=entire_site&q=create%20directory&page=1