Project 1 - Parsing NASA thermodynamic data
FILE PARSING
AIM:
To write a MATLAB code for file parsing the NASA thermodynamic data file and to extract fifty-three coefficients thermodynamic properties like Cp, H and S, for all the species in the data file. And then to find out the molecular mass of each species and finally to plot a graph for enthalpy, entropy and Cp with respect to temperature.
THEORY:
FILE PARSING: File parsing is defined to deals with the field of computational linguistics where it commonly defines the natural language processing.
Natural language processing (NLP) is nothing but concerned with programming the computers to process and analyse the human written language.
Parser helps to split the large input data into smaller data and will process the data. The main use of file parsing is to split the file or other input
into pieces or data which can be easily stored or manipulated. Here we will be splitting string into parts then recognise the parts to convert it into something simpler than string.
ENTHALPY (H): Enthalpy is a kind of energy. It is the sum of internal energy and flows energy. It is denoted by
symbol H.
ENTROPY (S): Entropy is a property and it is the measurement of the randomness of molecules. It is denoted by symbol S.
SPECIFIC HEAT (CP): Specific heat is nothing but it is the amount of heat per unit mass required to raise the temperature by one degree Celsius.
MOLECULAR WEIGHT: molecular weight, also called molecular mass, mass of a molecule of a substance based on 12 as the atomic weight of carbon-12.
It is calculated in practice by summing the atomic weights of the atoms making up the substance's molecular formula.
Molecular weight = (Number of atoms) * (Atomic weight), where we calculate the molecular weight of all species.
FORMULAS USED:
To calculate enthalpy, entropy and specific heat the below formulas are used:
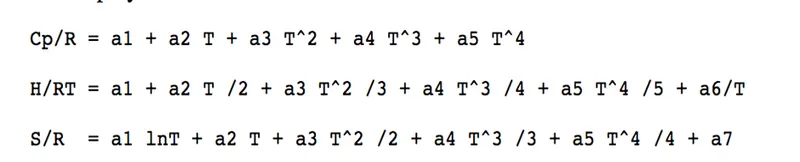
ENTHAPY FUNCTION CODE:
% NASA file parsing Enthalpy Function calculation
% Function Code


function [H] = enthalpy(x1,x2,x3,x4,x5,x6,x8,x9,x10,x11,x12,x13,temp,lmt,const_R)
if temp<=lmt
    H = (x8+(x9*(temp/2))+(x10*(temp.^2/3))+(x11*(temp.^3/4))+(x12*(temp.^4/5))+(x13./temp)).*temp*const_R;
else
    H =   (x1+(x2*(temp/2))+(x3*(temp.^2/3))+(x4*(temp.^3/4))+(x5*(temp.^4/5))+(x6./temp)).*temp*const_R;
Code explained:
This function code is used to calculate the enthalpy will be calculated and here we make use of for loop to calculate for each species. Also, here
we make use of If and else command to calculate high temperature and low temperature.
ENTROPY FUNCTION CODE:
% NASA file parsing Entropy Function calculation
% Function Code


function [S] = entropy(x1,x2,x3,x4,x5,x7,x8,x9,x10,x11,x12,x14,temp,lmt,const_R)
if temp>=lmt
    S = (x1*log(temp)+x2*temp+x3*(temp.^2/2)+x4*(temp.^3/3)+x5*(temp.^4/4)+x7)*const_R;
else
    S =   (x8*log(temp)+x9*temp+(x10*(temp.^2)/2)+(x11*(temp.^3)/3)+(x12*(temp.^4)/4)+x14)*const_R;
end
end
Code explained:
This function code is used to calculate the entropy will be calculated and here we make use of for loop to calculate for each species. Also, here
we make use of If and else command to calculate high temperature and low temperature.
SPECIFIC HEAT FUNCTION CODE:
% NASA file parsing Specific Heat Function calculation
% Function Code


function [cp] = specific_heat(x1,x2,x3,x4,x5,x8,x9,x10,x11,x12,temp,lmt,const_R)
if temp<=lmt
    cp = (x8+(x9*temp)+(x10*temp.^2)+(x11*temp.^3)+(x12*temp.^4))*const_R;
else
    cp =   (x1+(x2*temp)+(x3*temp.^2)+(x4*temp.^3)+(x5*temp.^4))*const_R;
end
end
Code explained:
This function code is used to calculate the specific heat will be calculated and here we make use of for loop to calculate for each species. Also, here
we make use of If and else command to calculate high temperature and low temperature.
MOLECULAR WEIGHT FUNCTION CODE:
% NASA file parsing molecular weight Function calculation
% Function Code

function Mole_wt = mol_wt(species_name)
weight = 0;
elements = ['H','C','N','O','Ar'];
mass = [1.0,29.36,52.37,14.008,15.78,45.63];

for i = 1:length(species_name)
    for j = 1:length(elements)
        if strcmpi(species_name(i),elements(j))
            weight = weight+mass(j);
            y = j;
        end
    end

    number = str2double(species_name(i));
    if(number>1)
        weight = weight+(mass(y)*(number-1));
    end
    Mole_wt = weight;
end
Code explained: -
- In this program we are using the above function code, we can calculate the molecular weight of all the species. Here we give atomic weight and atomic name as input to the species.
- Then we use of for loop to calculate the molecular weight of each species individually.
- Next, we use command called strcmp to compare the species with the elements and calculate their molecular weight.
- Finally, the string is converted to number by using str2num command
MAIN CODE FOR PARSING :
% PROJECT - 1 PARSING NASA THERMODYNAMIC DATA USING IN MATLAB
clear all
close all
clc

% Opening the file
f1 = fopen('THERMO.dat','r');
% using for loop to read first 5 lines
for i = 1:5
    %fgetl reads each 5 line from a file
   a = fgetl(f1);
end

for i = 1:53
    % Getting first header line which is a character with different data's
   header_line =  fgetl(f1);
   % Splitting the string based on delimiter
   % Our delimiter is space
   a = strsplit(header_line,' ');

   % We use curly brackets because it is character
   % 1st cell represents the species_name
   species_name = a{1};
   % Local lower, medium, higher temperatures, we are converting string to number
   llt = str2double(a{end-3});
   lmt = str2double(a{end-1});
   lht = str2double(a{end-2});
   T = linspace(llt,lht,500);

   % Getting species with exponential coeifficent
   line1 = fgetl(f1);
   % Finding the location of exponent(E) for line 1
   e1 = strfind(line1,'E');
   % We are converting string to number
   a1 = str2double(line1(1:e1(1)+3));
   a2 = str2double(line1(e1(1)+4:e1(2)+3));
   a3 = str2double(line1(e1(2)+4:e1(3)+3));
   a4 = str2double(line1(e1(3)+4:e1(4)+3));
   a5 = str2double(line1(e1(4)+4:e1(5)+3));

   % Getting species with exponential coeifficent
   line2 = fgetl(f1);
    % Finding the location of exponent(E) for line 2
   e2 = strfind(line2,'E');
    % We are converting string to number
   a6 = str2double(line2(1:e2(1)+3));
   a7 = str2double(line2(e2(1)+4:e2(2)+3));
   a8 = str2double(line2(e2(2)+4:e2(3)+3));
   a9 = str2double(line2(e2(3)+4:e2(4)+3));
   a10 = str2double(line2(e2(4)+4:e2(5)+3));

   % Getting species with exponential coeifficent
   line3 = fgetl(f1);
   % Finding the location of exponent(E) for line 3
   e3 = strfind(line3,'E');
   % We are converting string to number
   a11 = str2double(line3(1:e3(1)+3));
   a12 = str2double(line3(e3(1)+4:e3(2)+3));
   a13 = str2double(line3(e3(2)+4:e3(3)+3));
   a14 = str2double(line3(e3(3)+4:e3(4)+3));

   % Defining Universal Gas Constant 'r'
   r = 8.314;

   % Calling functions in main body: specific_heat,enthalpy,entropy
   [cp] = specific_heat(a1,a2,a3,a4,a5,a8,a9,a10,a11,a12,T,lmt,r);
   [H] = enthalpy(a1,a2,a3,a4,a5,a6,a8,a9,a10,a11,a12,a13,T,lmt,r);
   [S] = entropy(a1,a2,a3,a4,a5,a7,a8,a9,a10,a11,a12,a14,T,lmt,r);

   % Creating new folder for species
   mkdir(['C:\Users\GOBIKA\Desktop\THERMO.dat',species_name])
   % Entering current folder
   cd(['C:\Users\GOBIKA\Desktop\THERMO.dat',species_name])
   % Plot 1
   figure(1)
   plot(T,cp,'LineWidth',3,'Color','b')
   xlabel('Temperture')
   ylabel('Specific heat')
   title('Specific heat vs Temperture of',sprintf('%s',species_name))
   grid on
   % Saveas saves figure to a specific format
   saveas(figure(1),'cp vs T.jpg')

   % Plot 1
   figure(2)
   plot(T,H,'LineWidth',3,'Color','g')
   xlabel('Temperture')
   ylabel('Enthalpy')
   title('Enthalpy vs Temperture of',sprintf('%s',species_name))
   grid on
   % Saveas saves figure to a specific format
   saveas(figure(2),'H vs T.jpg')

   % Plot 1
   figure(3)
   plot(T,S,'LineWidth',3,'Color','m')
   xlabel('Temperture')
   ylabel('Entropy')
   title('Entropy vs Temperture of',sprintf('%s',species_name))
   grid on
   % Saveas saves figure to a specific format
   saveas(figure(3),'S vs T.jpg')

   %Returning back to initial directory
    cd ..

   [M] = mol_wt(species_name);
   K = sprintf('%s weight = %f',species_name,M);
   disp(K)
end

 fclose(f1);
CODE EXPLAINED:
- First, we have to open the given THERMO.dat file using fopen command and then we will extract all the information provided in the file using fgetl command. and then we will get the global temperature by using strslplit command and then we have to skip some lines using the fget command.
- Now we have to use of for loop command to get all temperature and coefficients that are present in our file.
- If we getting the temperature and coefficients, we use finstr command in order to input the accurate spot and specifying it so that we can get all the data.
- Now the data’s which are obtained from the file will be of string format which we need to convert into numbers by using str2num command. And by this we will get the temperature and coefficient of all the species.
- Now we make use of if command to create file for each species, in case if the folder exist it will simply save as plot or else it will create a folder to save the plot.
- Next, we have to calculate the specific heat, enthalpy, entropy function and gets plotted. The three figures are plotted using plot command and each species name is displayed using title command. And further it will be named using xlabel and ylabel command. This command is used for assuming the name of x-axis and y-axis
- And finally we are changing the directory using cd command and then we will save the plots as our images using save command.
- Finally, we will again change the directory using cd command to calculate molecular weight of each species using the function program and closing the file using fclose command.
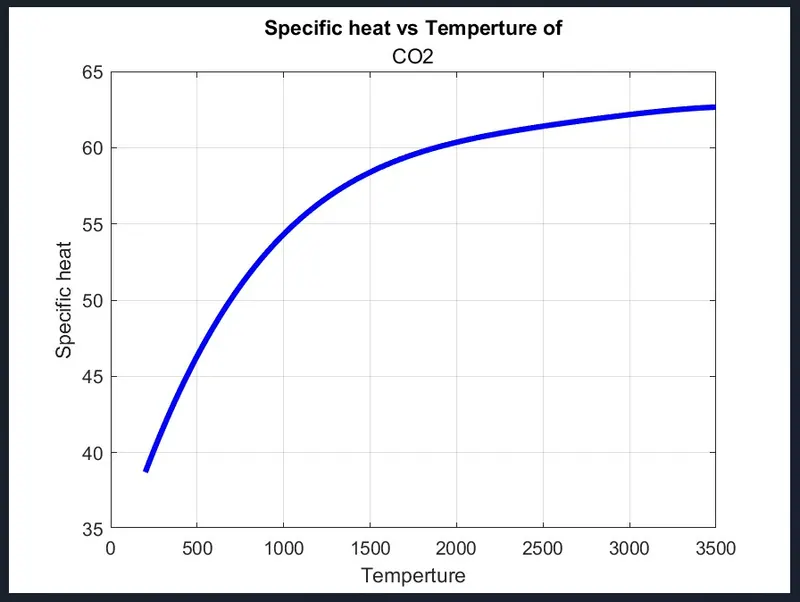
CO2 Plot for specific heat vs temperature:
CO2 PLOTS
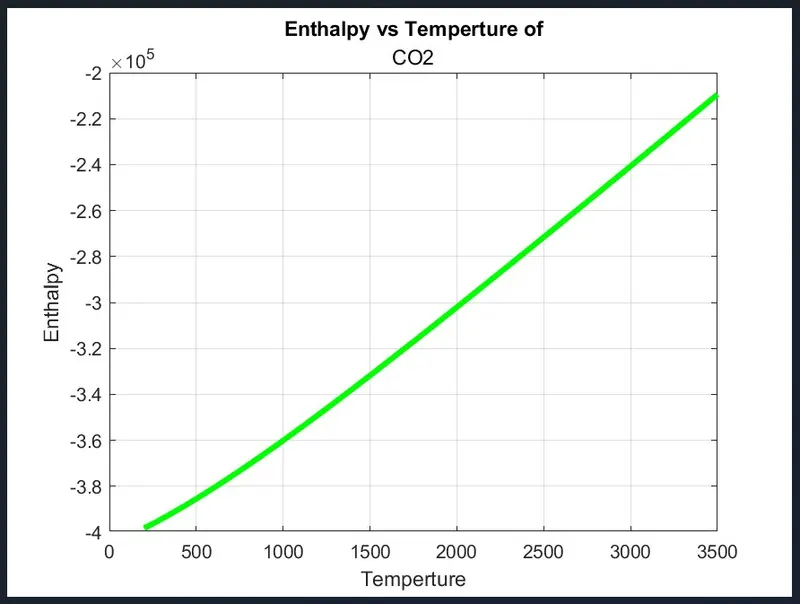
CO2 Plot for enthalpy vs temperature:
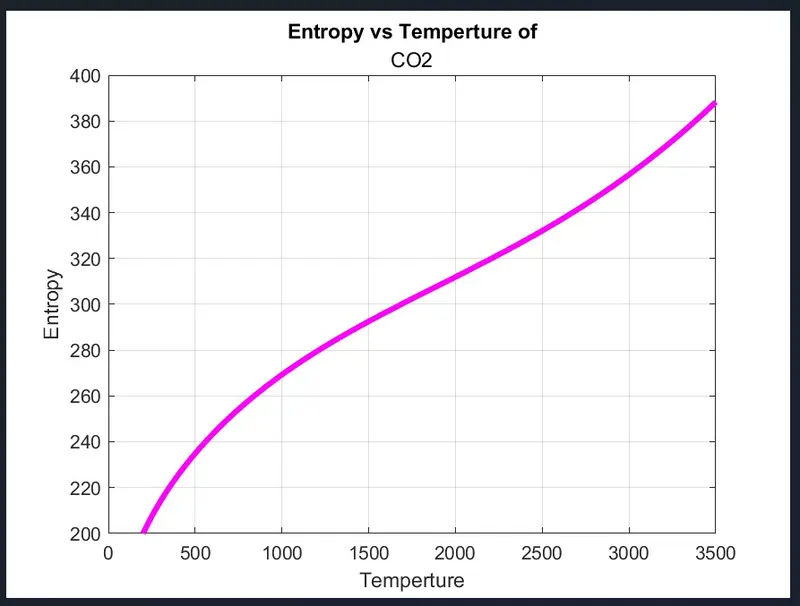
CO2 Plot for entropy vs temperature:
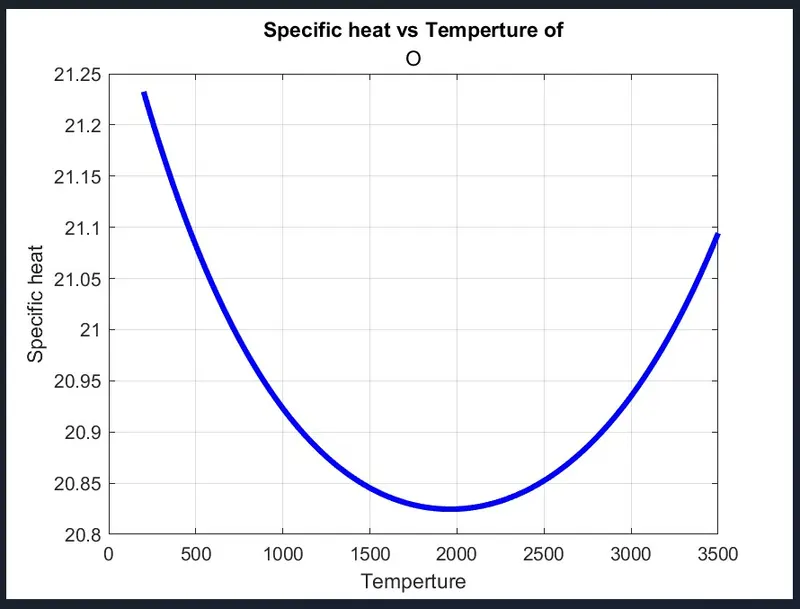
O plot for specific heat vs temperature:
O PLOTS
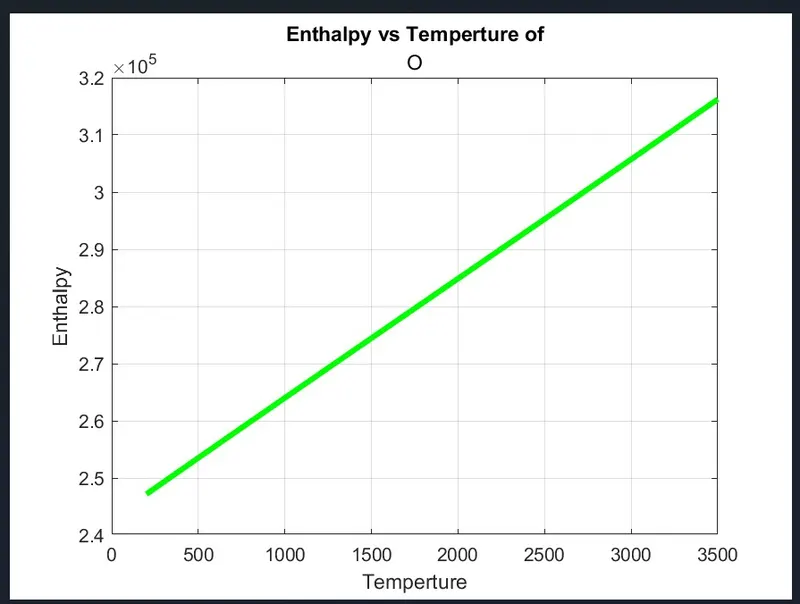
O plot enthalpy vs temperature:
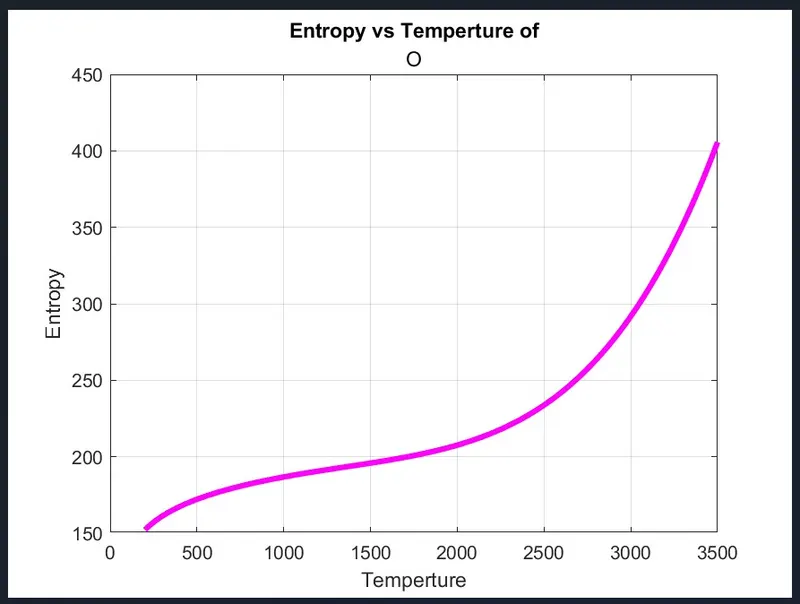
O plot for entropy vs temperature:
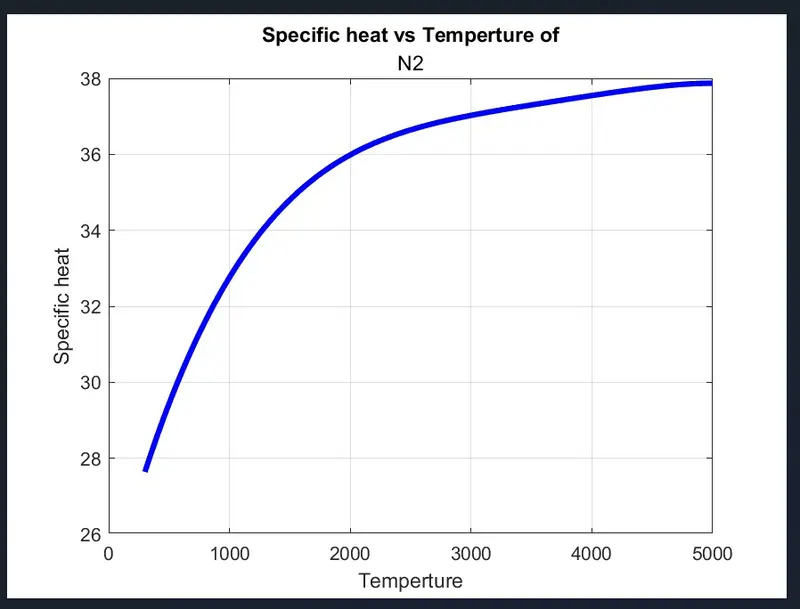
N2 Plot for specific heat vs temperature:
N2 PLOTS
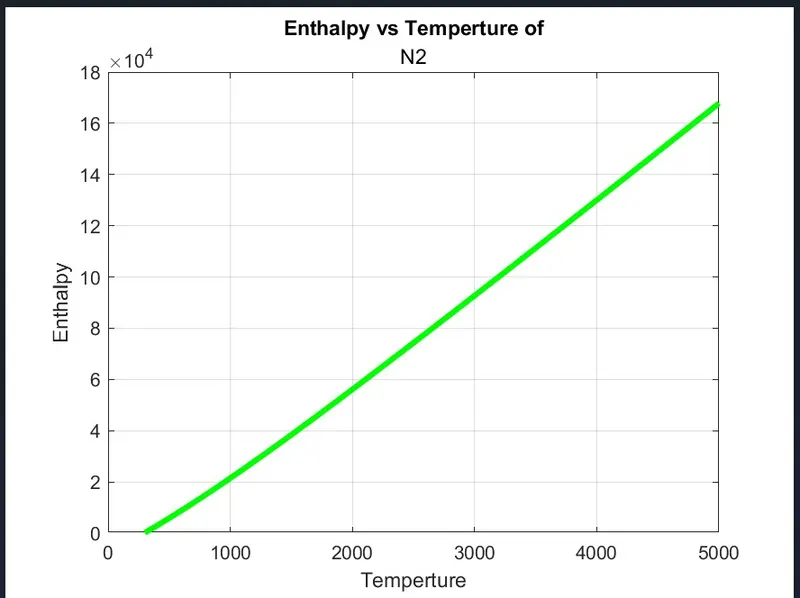
N2 Plot for enthalpy vs temperature:
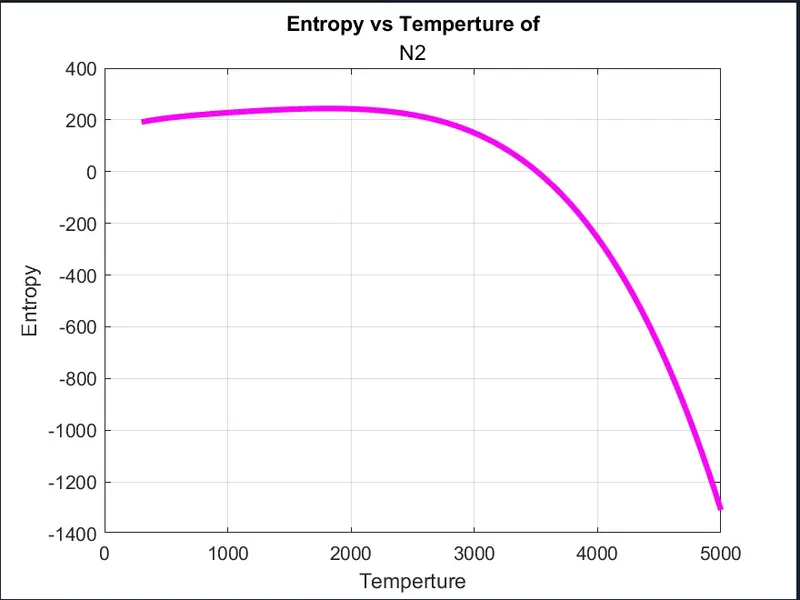
N2 Plot for entropy vs temperature:
Outputs:
Below image represents the screenshot containing the plots for all the species:

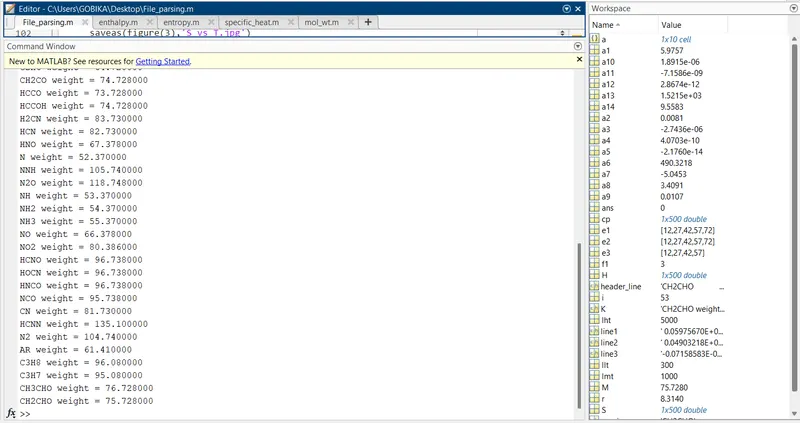
Molecular weight of species in command window:
Results:
Finally, the NASA thermodynamic data file has been programmed and the thermodynamic properties and
molecular weight of species has been calculated and plotted.