Project 1 - Parsing NASA thermodynamic data
open the ‘THERMO.dat’ data file, the fopen command is used and reading permission is provided.
the fgetl command is used and the first line and the global temperature are read.
The strsplit command is used to split the string at a specified delimiter which in this case is the spacing between the numbers.
The str2num command is used to convert the string of values of temperature into actual numbers and the global temperature values are read.
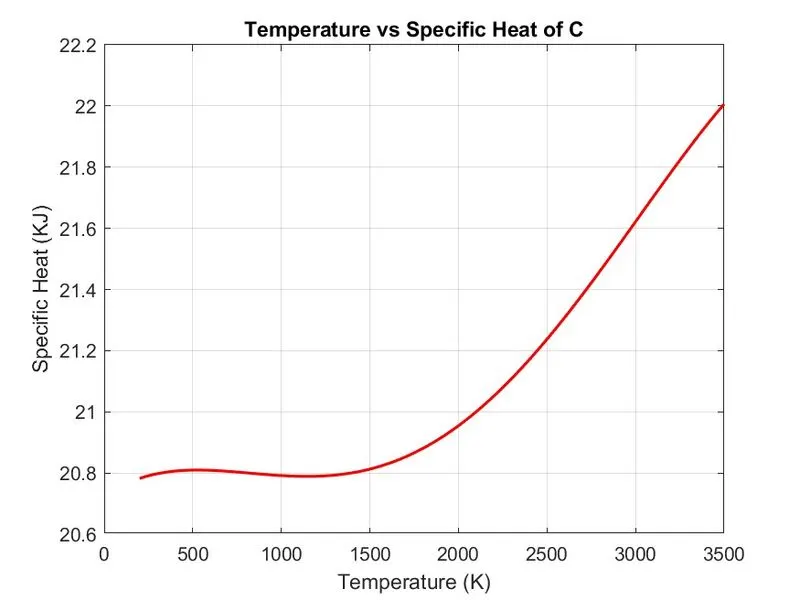
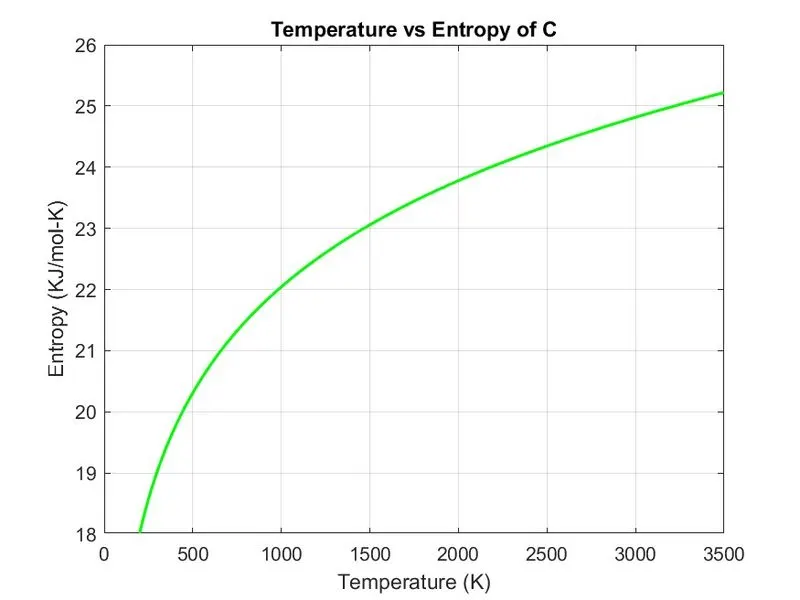
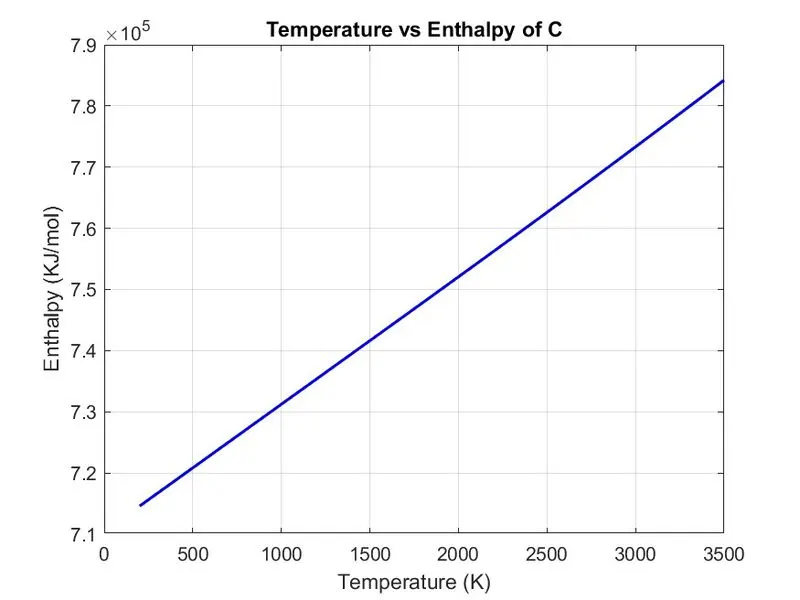
To read the data for all the 53 species mentioned in the data file and to calculate the thermodynamic properties of each species, ‘for loop’ is used. In the ‘for loop’, the first line of each species is read using the fgetl command and the string is converted into an array with the strsplit command. The name of the species is stored in the ‘species_name’ variable and the local temperature values are extracted using the str2num command. To read the values of coefficients from the proceeding three lines fgetl command is used along with the findstr command to find a common term in the string. Here ‘E’ is given as input to find common in the string. The common term is found to separate the values in the string and str2num is used to extract those values. In this way, all the 14 coefficients are extracted and stored in a variable ‘an’, where ‘n = 1,2,3,4,…,13,14’. The local temperature range for calculations is defined for 1000 values between lower values and higher values using linspace command. By using the for loop we find enthalpy entropy and specific heat.
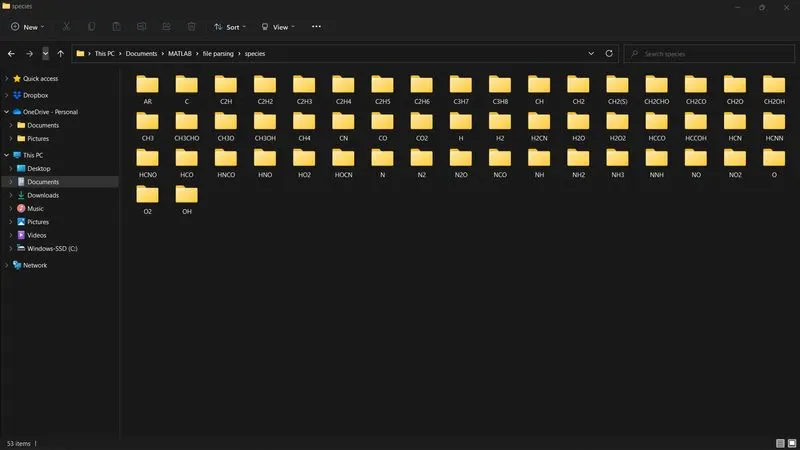
The mkdir command makes a new folder for each species and the cd will again change the folder to that particular species name to save the output. Then the graphs of Specific heat, Enthalpy, and Entropy against Temperature are plotted using the plot command using proper labels and titles. The three graphs for each species are saved using the saveas command as an image file with the ‘.jpg’ extension At the end, the directory is changed to the original directory using the cd command.
Then two for loops are used, one for the data stored in ‘species_name’ and another for the 'atoms' that we defined. The first 'for loop' run for the entire length of the species name that has been determined by the for loop in the main program. The second 'for loop' run for the entire length of the atoms array.
%%file parsing

clear all
close all
clc

%getting the data file
f1=fopen('THERMO.dat','r');
fgetl(f1)
%reading the header information
A=fgetl(f1);
A=strsplit(A,' ');
global_low_temp=str2num(A{2});
global_mid_temp=str2num(A{3});
global_high_temp=str2num(A{4});

%skipping next three lines
for i=1:3
    fgetl(f1);
end

%reading the species
for i=1:53

    header=fgetl(f1);
    x=strsplit(header,' ');

    species_name=(x{1});
    z=length(x);

    local_low_temp=str2double(x{z-3});
        local_high_temp=str2double(x{z-2});
            local_mid_temp=str2double(x{z-1});

            t1=local_low_temp;    %naming the local temperature
            t2=local_mid_temp;
            t3=local_high_temp;

            %getting first line coeffecients (a1-a5)
            line_1=fgetl(f1);

            a=strfind(line_1,'E');
            a1=str2double(line_1(1:a(1)+3));
            a2=str2double(line_1(a(1)+4:a(2)+3));
            a3=str2double(line_1(a(2)+4:a(3)+3));
            a4=str2double(line_1(a(3)+4:a(4)+3));
            a5=str2double(line_1(a(4)+4:a(5)+3));

            %getting second line coeffeceints (a6-a10)
             line_2=fgetl(f1);

            a_1=strfind(line_2,'E');
            a6=str2num(line_2(1:a_1(1)+3));
            a7=str2double(line_2(a_1(1)+4:a_1(2)+3));
            a8=str2double(line_2(a_1(2)+4:a_1(3)+3));
            a9=str2double(line_2(a_1(3)+4:a_1(4)+3));
            a10=str2double(line_2(a_1(4)+4:a_1(5)+3));

            %getting third line coeffeceints (a10-a14)
             line_3=fgetl(f1);

            a_2=strfind(line_1,'E');
            a11=str2double(line_3(1:a_2(1)+3));
            a12=str2double(line_3(a_2(1)+4:a_1(2)+3));
            a13=str2double(line_3(a_2(2)+4:a_1(3)+3));
            a14=str2double(line_3(a_2(3)+4:a_1(4)+3));


            %creating folder
            mkdir(['C:\Users\Student\Desktop\RAJKUMAR\MATLAB\file parsing\images\',species_name]);

            T=linspace(t1,t3,1000);
            R=8.314;
            % to get array of specific heat, enthalpy and entropy
            for k=1:length(T)
    % to compare the species  temperature to assign the coeffeceints
    %a1-a7 (high temperature coeffeceints), a8-a14(low temperature coeffecients)
    if T(k)>t2

        %high temperature coeffeceints.

        cp=(a1+a2.*T+a3.*T.^2+a4.*T.^3+a5.*T.^4)*R;

        H=(a1+(a2.*T)/2+(a3.*T.^2)/3+(a4.*T.^3)/4+(a5.*T.^4)/5+(a6./T))*R.*T;

        S=a1.*log(T)+a2.*T+(a3.*T.^2)/2+(a4.*T.^3)/3+(a5.*T.^4)/4+a7;

    else
        %low temperature coeffecients

        cp=(a8+a9.*T+a10.*T.^2+a11.*T.^3+a12.*T.^4)*R;

        H=(a8+(a9.*T)/2+(a10.*T.^2)/3+(a11.*T.^3)/4+(a12.*T.^4)/5+(a13./T))*R.*T;

        S=a8.*log(T)+a9.*T+(a10.*T.^2)/2+(a11.*T.^3)/3+(a12.*T.^4)/4+a14;
    end
    end


            %plotting the graphs

            figure(1);
            plot(T,cp);
            grid on ;
            title(species_name);
            xlabel('Temperature');
            ylabel('Specific Heat');


            figure(2);
            plot(T,H);
            grid on ;
            title(species_name);
            xlabel('Temperature');
            ylabel('Enthalpy');


            figure(3);
            plot(T,S);
            grid on ;
            title(species_name);
            xlabel('Temperature');
            ylabel('Entropy');


            %changing the directory and saving the file
            cd=(['C:\Users\Student\Desktop\RAJKUMAR\MATLAB\file parsing\images\',species_name]);

            saveas(1,'specific heat','jpg');
            saveas(2,'enthalpy','jpg');
            saveas(3,'entropy','jpg');


             %molecular_masscalculation


elements=['H','C','O','N','A'];
atomic_weight=[1.0079 12.0107 15.999 14.0067 39.948];
mol_mass=0;
for l=1:length(species_name)
    for m=1:length(atomic_weight)
        if strcmp(species_name(l),elements(m))
            mol_mass=mol_mass+atomic_weight(m);
            position=m;
        end
    end

n=str2double(species_name(l));
if n>1
    mol_mass=mol_mass+atomic_weight(position)*(n-1);

end
end
sprintf('Molecular Weight of %s:%f u',species_name,mol_mass)


end
             fclose(f1)