Project 1 - Parsing NASA thermodynamic data
Project
File Parsing
Objective
- To write a code to extract the 14 coefficients and calculate the Enthalpy, Entropy and Specific Heat for all the species in the data file.
- Calculate the molecular weight of all species.
Program
# clear all,close all and clc commands are used to clear the program and plots of previous programs and make it a clean program script.
clear all
close all
clc
% File Parsing
% Reading the 'THERMO' file and Using 'fopen' and 'r' to open and read the file
# Reading the 'THERMO' file and Using 'fopen' and 'r' to open and read the file
f = fopen('THERMO.dat','r');
% Skipping the first 5 lines using 'for' loop
for d = 1:5
#fgetl is used to read the line and skip it. It is done because those lines are not required
fgetl(f);
end
% Parsing of all the species from the file
#for loop is used to split the values of each species and their coefficients
for i = 1:53
% Using fgetl to access the first line of the first species 'O'
a = fgetl(f);
% Spliting the string 'a' using space
#strsplit is used to split the data separately from the each line
b = strsplit(a, ' ');
species_name = b{1};
% to specify the position of low, high, medium temperature
z = length(b);
% Extracting the local temperature
#str2double is used to remove the string and make it as a number, strdouble is used instead of str2nuum for better performance of code
low_temp = str2double(b{z-3});
high_temp = str2double(b{z-2});
med_temp = str2double(b{z-1});
% Extracting the co_efficients
% Line 1
co_line1 = fgetl(f);
% Finding the positions of E in 'Line 1'
e1 = strfind(co_line1,'E'); % Seperating the first coefficient values using 'E'
% All coefficients of Line 1
# taking each coefficients from the first line of each species
a1 = str2double(co_line1(1:e1(1)+3));
a2 = str2double(co_line1(e1(1)+4:e1(2)+3));
a3 = str2double(co_line1(e1(2)+4:e1(3)+3));
a4 = str2double(co_line1(e1(3)+4:e1(4)+3));
a5 = str2double(co_line1(e1(4)+4:e1(5)+3));
% Line 2
co_line2 = fgetl(f);
% Finding the positions of E in 'Line 2'
# taking each coefficients from the second line of each species
e2 = strfind(co_line2,'E');
% All coefficients of Line 2
a6 = str2double(co_line2(1:e2(1)+3));
a7 = str2double(co_line2(e2(1)+4:e2(2)+3));
a8 = str2double(co_line2(e2(2)+4:e2(3)+3));
a9 = str2double(co_line2(e2(3)+4:e2(4)+3));
a10 = str2double(co_line2(e2(4)+4:e2(5)+3));
% Line 3
co_line3 = fgetl(f);
% Finding the positions of E in 'Line 3'
# taking each coefficients from the third line of each species
e3 = strfind(co_line2,'E');
% All coefficients of Line 3
a11 = str2double(co_line3(1:e3(1)+3));
a12 = str2double(co_line3(e3(1)+4:e3(2)+3));
a13 = str2double(co_line3(e3(2)+4:e3(3)+3));
a14 = str2double(co_line3(e3(3)+4:e3(4)+3));
#folder is created to automatically save the species files with the mkdir command
% Creating the folder automatically to save the Species Files
mkdir(['C:\Users\RK\Desktop\MATLAB\file parsing\NASA project\',species_name]);
% Universal Gas constant(R)
# universal gas constant taken is
R = 8.314;
% Calculation of Cp, H, S (Specific Heat, Enthalpy, Entropy)
#a1-a7 (high temperature coeffecients), a8-a14 (low temperature coeffecients)
T = linspace(low_temp,high_temp,1000);
for k = 1:length(T)
if T(k)>med_temp
#High temperature coeffecients
Cp(k) = (a1 + a2*T(k) + a3*T(k)^2 + a4*T(k)^3 + a5*T(k)^4)*R;
H(k) = (a1 + (a2*T(k))/2 + (a3*T(k)^2)/3 + (a4*T(k)^3)/4 + (a5*T(k)^4)/5 + a6/T(k))*R*T(k);
S(k) = (a1*log(T(k)) + a2*T(k) + (a3*T(k)^2)/2 + (a4*T(k)^3)/3 + (a5*T(k)^4)/4 + a7)*R;
else
# Low temperature coeffecient
Cp(k) = (a8 + a9*T(k) + a10*T(k)^2 + a11*T(k)^3 + a12*T(k)^4)*R;
H(k) = (a8 + (a9*T(k))/2 + (a10*T(k)^2)/3 + (a11*T(k)^3)/4 + (a12*T(k)^4)/5 + a13/T(k))*R*T(k);
S(k) = (a8*log(T(k)) + a9*T(k) + (a10*T(k)^2)/2 + (a11*T(k)^3)/3 + (a12*T(k)^4)/4 + a14)*R;
end
end
% Changing the directory and saving the file
#changing the directory and saving the file with the given file name
cd(['C:\Users\RK\Desktop\MATLAB\file parsing\NASA project\',species_name]);
% Plotting
#Plotting Temp vs Cp
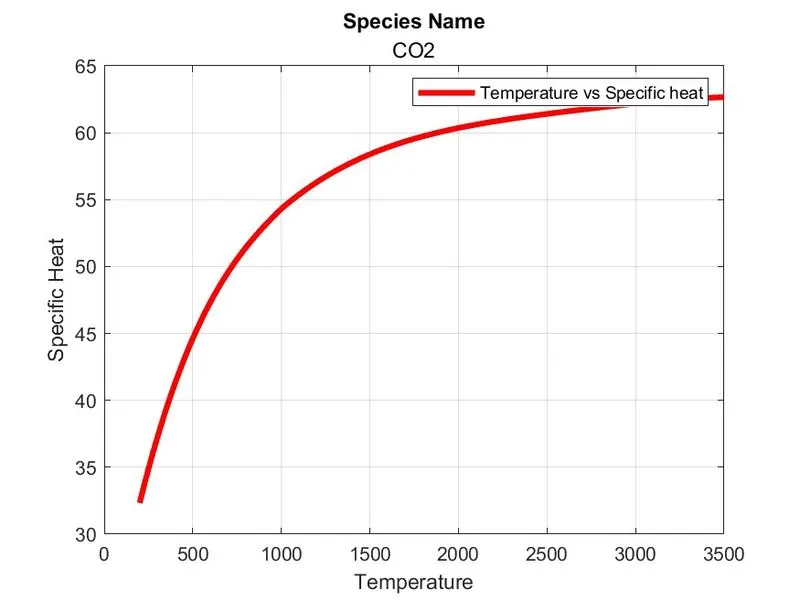
figure(1);
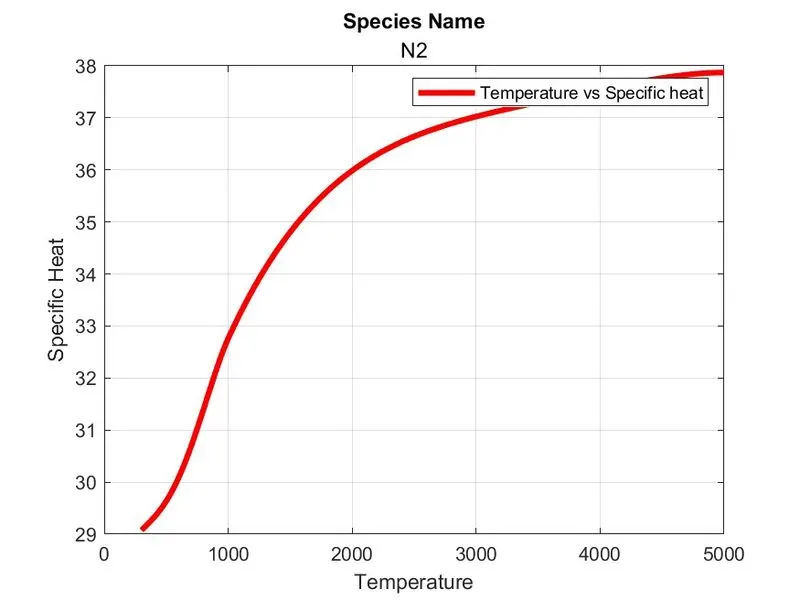
plot(T, Cp,'LineWidth',3,'Color','r');
xlabel('Temperature'); # gives x-axis name
ylabel('Specific Heat'); #gives y-axis name
title('Species Name',species_name); #gives title for the figure
legend('Temperature vs Specific heat'); #gives legend to the plot
grid on; #draw grid to the plot
saveas(1, 'Specific heat', 'jpg'); #saves the plot automatically in the folder
figure(2);
# Plotting Temp vs Entropy
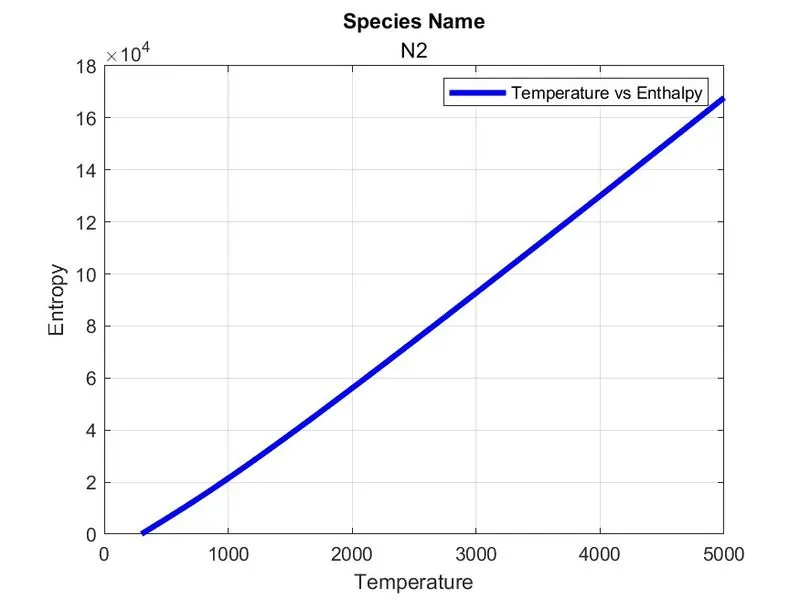
plot(T,H,'LineWidth',3,'Color','b');
xlabel('Temperature');
ylabel('Entropy');
legend('Temperature vs Enthalpy');
title('Species Name',species_name);
grid on;
saveas(2,'Enthalpy','jpg');
figure(3);
#Plotting Temp vs Enthalpy
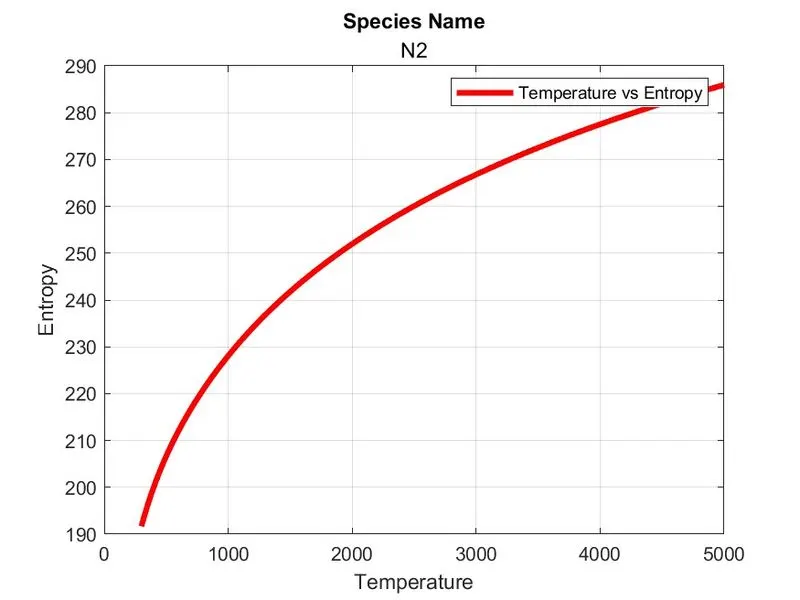
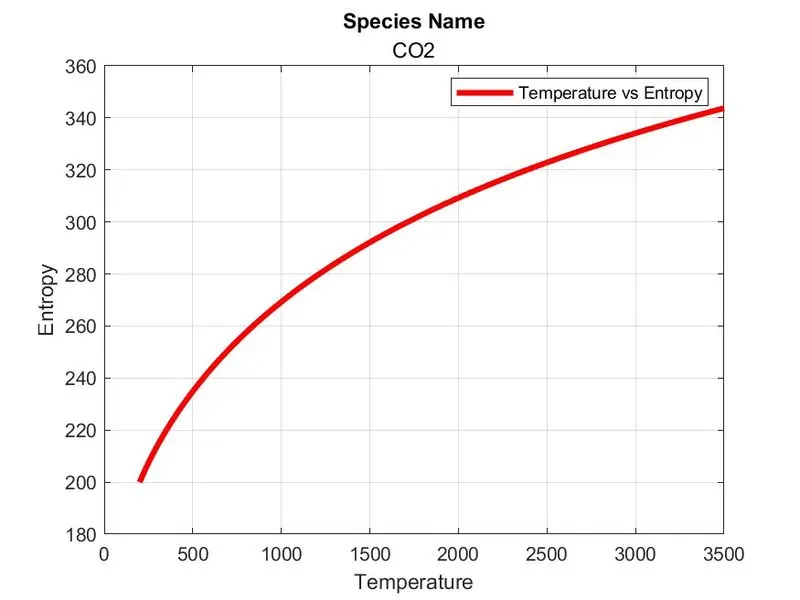
plot(T, S,'LineWidth',3,'Color','r');
xlabel('Temperature');
ylabel('Entropy');
legend('Temperature vs Entropy');
title('Species Name',species_name);
grid on;
saveas(3,'Entropy', 'jpg');
# Calculating the molecular weight of each species
# elements with the atomic weight taken in an array
elements = ['H','C','N','O','A'];
atomic_wt = [1,12,14,16,40];
molecular_wt = 0;
for l = 1:length(species_name)
for m = 1:length(elements)
#strcmpi is used to compare the strings
if strcmpi(species_name(l),elements(m))
molecular_wt = molecular_wt + atomic_wt(m);
position = m;
end
end
# Converting the string to number
p = str2double(species_name(l));
if p>1
molecular_wt = molecular_wt + atomic_wt(position)*(p-1);
end
end
#sprintf is used to format the data in array without characters unaltered
sprintf('Molecular weight of %s is %d', species_name, molecular_wt)
end
#fclose is used to close the file
fclose(f);
Outputs :
- "File Parsing means reading a series of data and building a model of the content of that data. The main aim of file parsing is to perform transformation on the data. It just splits the file with pieces of data and stored for manipulation".
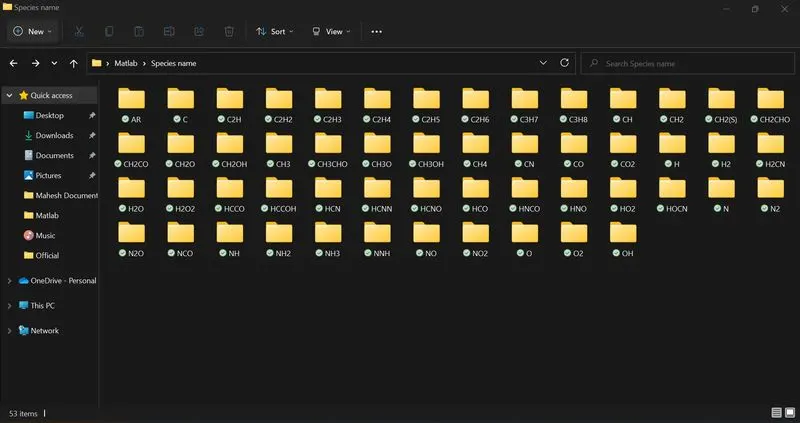
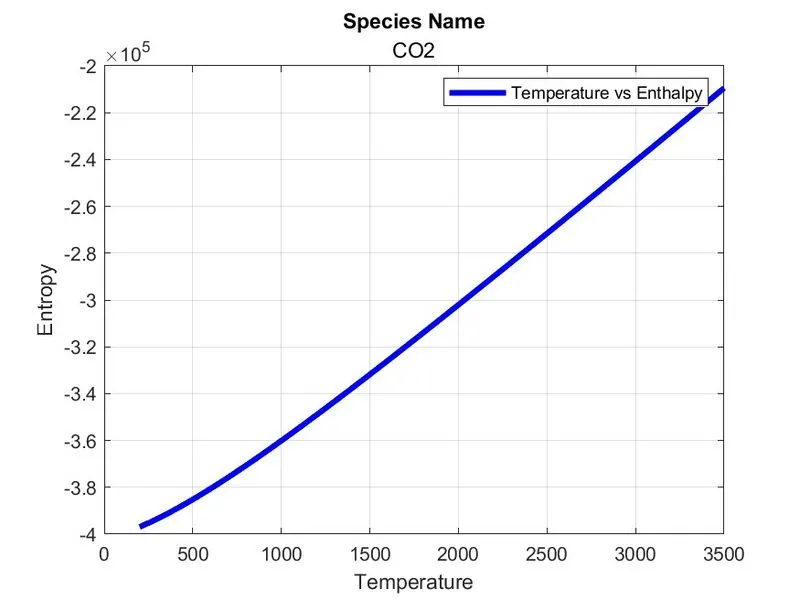
- Extracted 14 coefficients of each species present in the folder.
- Calculated the molecular weight of each species.
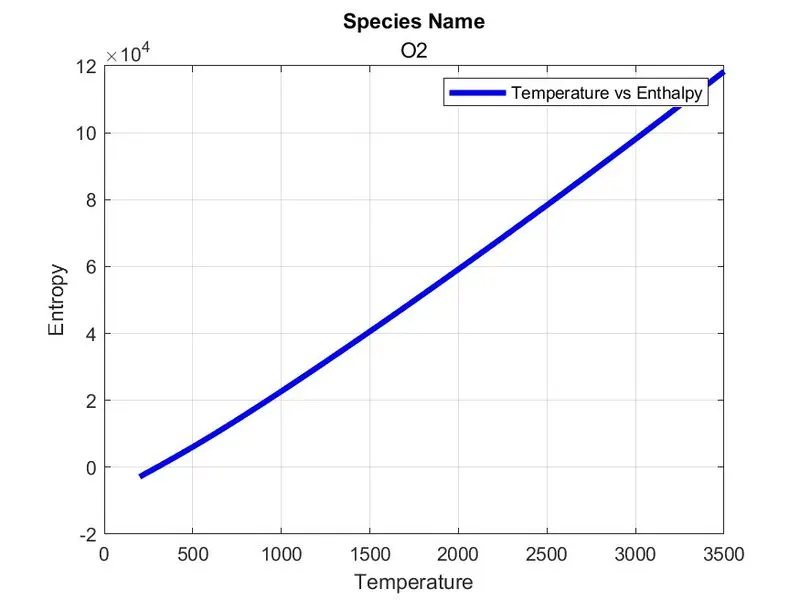
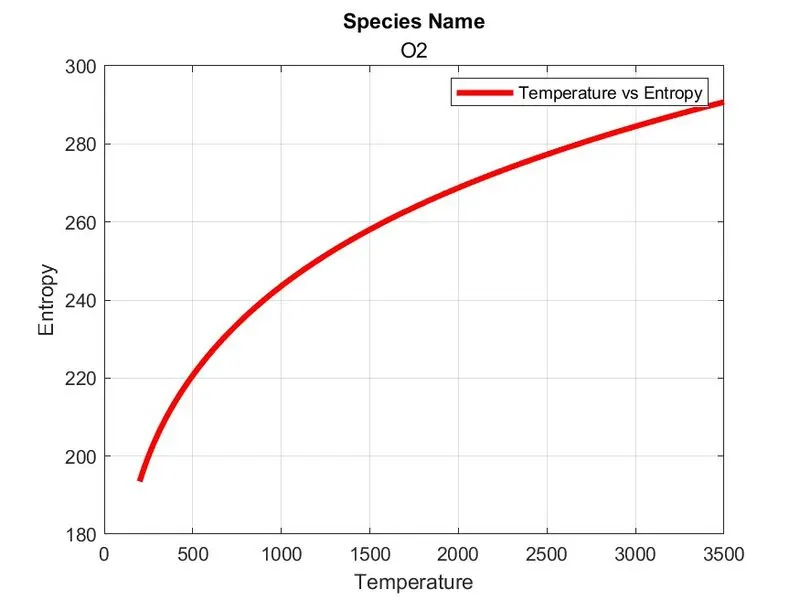
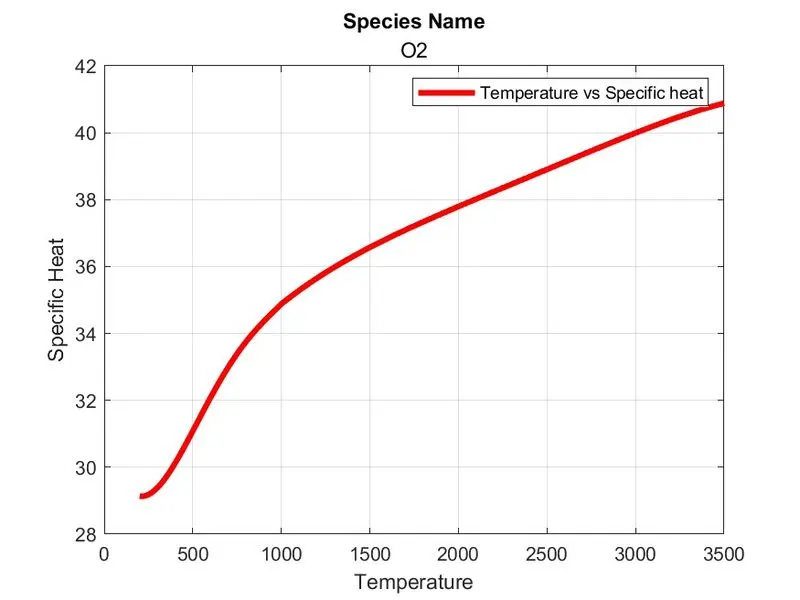
- Plotted the following graph: Temp vs H, Temp vs S, Temp vs Cp.
clear all
close all
clc

% File Parsing
% Reading the 'THERMO' file and Using 'fopen' and 'r' to open and read the file
f = fopen('THERMO.dat','r');

% Skiping the first 5 lines using 'for' loop
for d = 1:5
    fgetl(f);
end

% Parsing of all the species from the file
for i = 1:53
% Using fgetl to access the first line of the first species 'O'
a = fgetl(f);

% Spliting the string 'a' using space
b = strsplit(a, ' ');
species_name = b{1};

% to specify the position of low, high, medium temperature
z = length(b);

% Extracting the local temperature
low_temp = str2double(b{z-3});
high_temp = str2double(b{z-2});
med_temp = str2double(b{z-1});

% Extracting the co_efficients
% Line 1
co_line1 = fgetl(f);

% Finding the positions of E in 'Line 1'
e1 = strfind(co_line1,'E'); % Seperating the first coefficient values using 'E'

% All coefficients of Line 1
a1 = str2double(co_line1(1:e1(1)+3));
a2 = str2double(co_line1(e1(1)+4:e1(2)+3));
a3 = str2double(co_line1(e1(2)+4:e1(3)+3));
a4 = str2double(co_line1(e1(3)+4:e1(4)+3));
a5 = str2double(co_line1(e1(4)+4:e1(5)+3));

% Line 2
co_line2 = fgetl(f);

% Finding the positions of E in 'Line 2'
e2 = strfind(co_line2,'E');

% All coefficients of Line 2
a6 =  str2double(co_line2(1:e2(1)+3));
a7 =  str2double(co_line2(e2(1)+4:e2(2)+3));
a8 =  str2double(co_line2(e2(2)+4:e2(3)+3));
a9 =  str2double(co_line2(e2(3)+4:e2(4)+3));
a10 =  str2double(co_line2(e2(4)+4:e2(5)+3));

% Line 3
co_line3 = fgetl(f);

% Finding the positions of E in 'Line 3'
e3 = strfind(co_line2,'E');

% All coefficients of Line 3
a11 =  str2double(co_line3(1:e3(1)+3));
a12 =  str2double(co_line3(e3(1)+4:e3(2)+3));
a13 =  str2double(co_line3(e3(2)+4:e3(3)+3));
a14 =  str2double(co_line3(e3(3)+4:e3(4)+3));

% Creating the folder automatically to save the Species Files
mkdir(['C:\Users\Mahesh\OneDrive\Desktop\Matlab\Species name\',species_name]);

% Universal Gas constant(R)
R = 8.314;

% Calculation of Cp, H, S (Specific Heat, Enthalpy, Entropy)
% a1-a7 (high temperature coeffecients), a8-a14 (low temperature coeffecients)
T = linspace(low_temp,high_temp,1000);

for k = 1:length(T)
    if T(k)>med_temp
       % High temperature coeffecients
       Cp(k) = (a1 + a2*T(k) + a3*T(k)^2 + a4*T(k)^3 + a5*T(k)^4)*R;
       H(k) = (a1 + (a2*T(k))/2 + (a3*T(k)^2)/3 + (a4*T(k)^3)/4 + (a5*T(k)^4)/5 + a6/T(k))*R*T(k);
       S(k) = (a1*log(T(k)) + a2*T(k) + (a3*T(k)^2)/2 + (a4*T(k)^3)/3 + (a5*T(k)^4)/4 + a7)*R;
    else
       % Low temperature coeffecient
       Cp(k) = (a8 + a9*T(k) + a10*T(k)^2 + a11*T(k)^3 + a12*T(k)^4)*R;
       H(k) = (a8 + (a9*T(k))/2 + (a10*T(k)^2)/3 + (a11*T(k)^3)/4 + (a12*T(k)^4)/5 + a13/T(k))*R*T(k);
       S(k) = (a8*log(T(k)) + a9*T(k) + (a10*T(k)^2)/2 + (a11*T(k)^3)/3 + (a12*T(k)^4)/4 + a14)*R;
    end
end

% Changing the directory and saving the file
cd(['C:\Users\Mahesh\OneDrive\Desktop\Matlab\Species name\',species_name]);

% Plotting

figure(1);
plot(T, Cp,'LineWidth',3,'Color','r');
xlabel('Temperature');
ylabel('Specific Heat');
title('Species Name',species_name);
legend('Temperature vs Specific heat');
grid on;
saveas(1, 'Specific heat', 'jpg');

figure(2);
plot(T,H,'LineWidth',3,'Color','b');
xlabel('Temperature');
ylabel('Entropy');
legend('Temperature vs Enthalpy');
title('Species Name',species_name);
grid on;
saveas(2,'Enthalpy','jpg');

figure(3);
plot(T, S,'LineWidth',3,'Color','r');
xlabel('Temperature');
ylabel('Entropy');
legend('Temperature vs Entropy');
title('Species Name',species_name);
grid on;
saveas(3,'Entropy', 'jpg');

% Calculating the molecular weight of each species
elements = ['H','C','N','O','A'];
atomic_wt = [1,12,14,16,40];
molecular_wt = 0;

for l = 1:length(species_name)
    for m = 1:length(elements)
        if strcmpi(species_name(l),elements(m))
            molecular_wt = molecular_wt + atomic_wt(m);
            position = m;
        end
    end
    % Converting the string to number
    p = str2double(species_name(l));
    if p>1
        molecular_wt = molecular_wt + atomic_wt(position)*(p-1);
    end
end
sprintf('Molecular weight of %s is %d', species_name, molecular_wt)
end

fclose(f);