Project 1 - Parsing NASA thermodynamic data
Project 1 - Parsing NASA thermodynamic data
Aim:
Write a function that extracts the 14 co-efficients and calculates the enthalpy, entropy and specific heats for all the species in the data file
Objective:
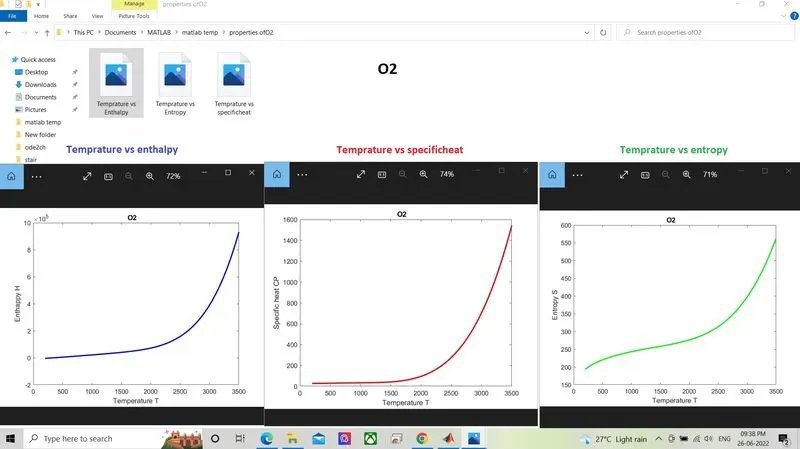
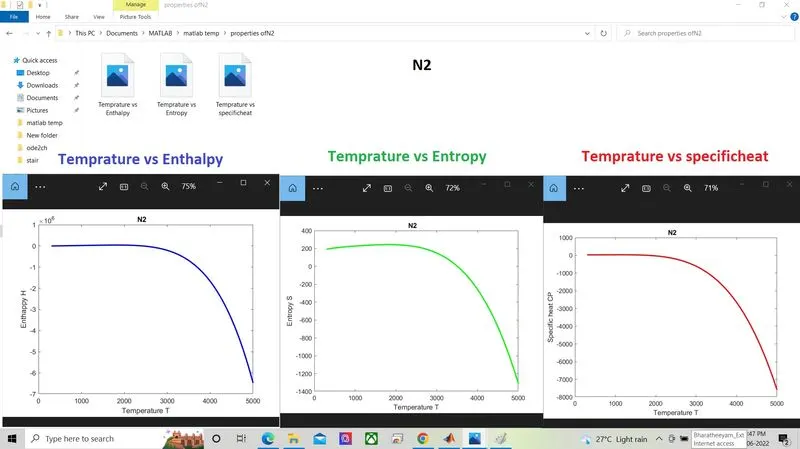
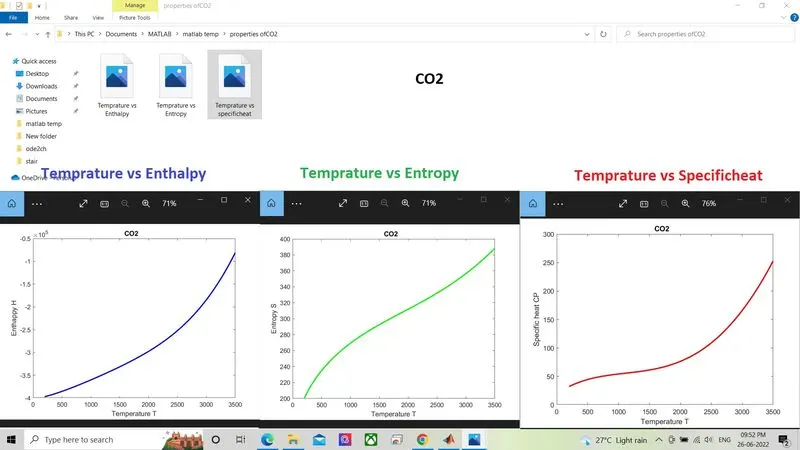
- Plot the Cp, Enthalpy and Entropy for the local temperature range
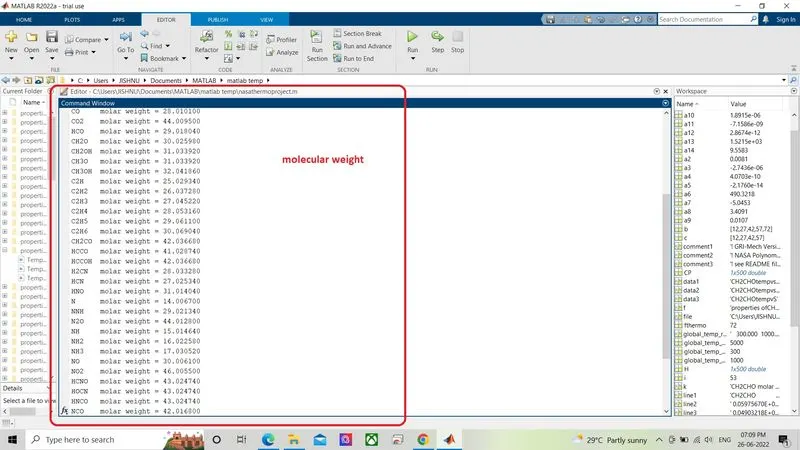
- Calculate the molecular weight of each species and display it in the command window.
- Save the plots as images with appropriate names and dump them in separate folders for each species with suitable name.
- The main program that you will submit will just take the "THERMO.dat" file as an input and generate Cp, H and S plots.
Theory:
What is file parsing?
Parsing, syntax analysis, or syntactic analysis is the process of analyzing a string of symbols, either in natural language, computer languages or data structures, conforming to the rules of a formal grammar.
The job of the file data parser is to parse through all the customer's documents such as government-provided IDs, Professional IDs, Financial documents, etc. and store them in a much more reliable and unambiguous way.
or it is basicly reading /writing /modifing data/datastructure in a file so that it can be retrived and used later easily for furthe calculation or processing.
few formats in matlab used to store data .txt,.docx,.dat
Entropy:
The entropy is a measure of the amount of chaos in a microscopic system. The concept of entropy was first introduced in thermodynamics. Thermodynamics is the study of energy, its ability to carry out work, and the conversion between various forms of energy, such as the internal energy of a system, heat, and work.
Enthalpy:
Enthalpy itself is a thermodynamic potential, so in order to measure the enthalpy of a system, we must refer to a defined reference point; therefore what we measure is the change in enthalpy, Δ H. The Δ H is a positive change in endothermic reactions, and negative in heat-releasing exothermic processes
Specific heat:
In thermodynamics, the specific heat capacity of a substance is the heat capacity of a sample of the substance divided by the mass of the sample, also sometimes referred to as massic heat capacity. Informally, it is the amount of heat that must be added to one unit of mass of the substance in order to cause an increase of one unit in temperature. The SI unit of specific heat capacity is joule per kelvin per kilogram, J⋅kg⁻¹⋅K⁻¹.
Equations and conditions
Here R is the universal gas constant,
T is the temeprature
The FIRST 7 coefficients are HIGH-temperature coefficients and the SECOND 7 coefficients are LOW-temperature coefficients.
Also use the LOCAL TEMPERATURE RANGES which is unique for each individual species, not the GLOBAL TEMPERATURE RANGE.
so from the given equation we can get to the condition
specific heat if T>=medium temp
`CP= (a_1 + a_2T+a_3T^2+a_4T^3+a_5T^4)R`
specific heat if T<=medium temp
`CP= (a_8 + a_9T+a_10T^2+a_11T^3+a_12T^4)R`
Enthalpy if T>=medium temp
`H=(a_1+(a_2T)/2+(a_3T^2)/3+(a_4T^3)/4+(a_5T^4)/5+a_6/T)RT`
Enthalpy if T<=medium temp
`H=(a_8+(a_9T)/2+(a_10T^2)/3+(a_11T^3)/4+(a_12T^4)/5+a_13/T)RT`
Entropy if T>=medium temp
`S=(a_1log(T)+a_2T+(a_3T^2)/2+(a_4T^3)/3+(a_5T^4)/4+a_7)R`
Entropy if T<=medium temp
`S=(a_8log(T)+a_9T+(a_10T^2)/2+(a_11T^3)/3+(a_12T^4)/4+a_14)R`
Code & Explanation:
(note:step by step explanation given within code as comments)
function code :
Specific heat functioncode:
%creaing a function to get cp values depending on the temperature range

function CP=specific_heatnasa(a1,a2,a3,a4,a5,a8,a9,a10,a11,a12,R,T,local_temprature_med)

%condition:if the temperature is greater than given midtemp that is 1000 use
%a1,a2,a3,a4,a5 as coefficients
if T>=local_temprature_med
    CP= (a1+(a2*T)+(a3*T.^2)+(a4*T.^3)+(a5*T.^4))*R;

%else condition:iftemp is less than med temp use a8,a9,a10,a11 as
%coefficient
else
    CP= (a8+(a9*T)+(a10*T.^2)+(a11*T.^3)+(a12*T.^4))*R;
end
In this code we a fuction which outputs specific heat , it has 2 condition if temp greater than medum temp and if temp less than medium temp
The equations used are explaind with change in co efficient value under Equations topic
Enthalpy function code:
%creaing a function to get h enthalpy values depending on the temperature range

function h=enthalpynasa(a1,a2,a3,a4,a5,a6,a8,a9,a10,a11,a12,a13,R,T,local_temprature_med)

%condition:if the temperature is greater than given midtemp that is 1000 use
%a1,a2,a3,a4,a5,a6 as coefficients

if T>=local_temprature_med
    h=(a1+((a2.*T)./2)+((a3.*T.^2)./3)+((a4.*T.^3)./4)+((a5.*T.^4)./5)+(a6./T)).*R.*T;

%else condition:iftemp is less than med temp use a8,a9,a10,a11,a12 as
%coefficient
else
    h=(a8+((a9.*T)./2)+((a10.*T.^2)./3)+((a11.*T.^3)./4)+((a12.*T.^4)./5)+(a13./T)).*R.*T;

end
In this code we a fuction which outputs enthalpy , it has 2 condition if temp greater than medum temp and if temp less than medium temp
The equations used are explaind with change in co efficient value under Equations topic
Entropy function code:
%creaing a function to get s entropy values depending on the temperature range

function s=entropynasa(a1,a2,a3,a4,a5,a7,a8,a9,a10,a11,a12,a14,R,T,local_temprature_med)


%condition:if the temperature is greater than given midtemp that is 1000 use
%a1,a2,a3,a4,a5,a6,a7 as coefficients

if T>=local_temprature_med
    s=((a1*log(T))+(a2*T)+((a3*T.^2)/2)+((a4*T.^3)/3)+((a5*T.^4)/4)+a7)*R;

%else condition:iftemp is less than med temp use a8,a9,a10,a11,a12,a13,14 as
%coefficient
else
    s=((a8*log(T))+(a9*T)+((a10*T.^2)/2)+((a11*T.^3)/3)+((a12*T.^4)/4)+a14)*R;

end
In this code we a fuction which outputs entropy , it has 2 condition if temp greater than medum temp and if temp less than medium temp
The equations used are explaind with change in co efficient value under Equations topic
Molecular weight function code:
%creaing a function to get MW molarweaight

function mw=molecularweightnasa(species_name)
% we need to first define atomic mass of each element in the given compound
%[oxygen , hydrogen, carbon , nitrogen , argon]
Element=['O','H','C','N','A'];
%atomicmass of those elementin same odrer
atomicmass=[15.9994,1.00794,12.0107,14.0067,39.948];
molarweight=0;
%lets compare for every position of speciesname
for i=1:length(species_name)
    % take the lengh of atomic number ie,5
    for j=1:5
    %    compaire each position with elements present and if true as atomic
    %    mass to it.
        if strcmpi(species_name(i),Element(j))
            molarweight=molarweight+atomicmass(j);
            z=j; %tempory variable
        end
    end
    %if encounteds with a number
    t=str2double(species_name(i));
    if (t>1)
        %number is greter than 1 then molarweight is added to product of
        %that atomic mass and (number -1) ,as the matomic mass will be already addded of one atam n previous loop
        molarweight=molarweight+(atomicmass(z)*(t-1));
    end
    mw=molarweight;
end
in this code we need to determine the molicular weight. so we initalise the possible elements in the table, also initialise its atomic weight in a curresponding arrey.a nested loop is created to scan the elements from the desigrd compound, the first leter is taken and is scompaired to a set of elements wih predetermoned atomicmass. if the elemets match the atomic mass is added to avariable. if not and a number is found it it moves to if condition nd if its greater than1 the string in that position is converted to double. and that number -1 is multiplied to currosponding atomic number .the final value is added to provide us with molar weight.
Main code:
%Project 1 - Parsing NASA thermodynamic data
clear all
close all
clc

%open the data file assign to a variable
fthermo=fopen('THERMO.dat','r');

%to get first line use fgetl command. assing the sring to a variable
title_line=fgetl(fthermo);

%second line gives global tempature range low , medium ,high
global_temp_range=fgetl(fthermo);

%split the string containing global_temp_range to a cell array a
a=strsplit(global_temp_range,' ');

%splitng provided with 4 cell arrey as first array was {0x0 char} we will
%ignore that for our problem

%converting cell string array to intiger vector we get
global_temp_range_low=str2double(a{2});

%converting cell string array to intiger vector we get
global_temp_range_med=str2double(a{3});

%converting cell string array to intiger vector we get
global_temp_range_hig=str2double(a{4});

%as next 3 lines of satement is comment we can skipthose line
comment1=fgetl(fthermo);
comment2=fgetl(fthermo);
comment3=fgetl(fthermo);

% in total of 53 species. so ceate a forloop to run 53 times
for i=1:53
%   to get the first line which contain species name and local tempratures
    line1=fgetl(fthermo);
%   name of species contains maximum of 6 charecters.from position 1.
    species_name=line1(1:6);

%   to get local temprature1
    local_temprature1=line1(49:55);
%   converting local_temrature1 to double from string and store in variable
    local_temprature_low=str2double(local_temprature1);

%   to get local temprature1
    local_temprature2=line1(58:65);
%   converting local_temrature1 to double from string and store in variable
    local_temprature_hig=str2double(local_temprature2);

%   to get local temprature1
    local_temprature3=line1(68:75);
%   converting local_temrature1 to double from string and store in variable
    local_temprature_med=str2double(local_temprature3);


%   getting sting from next line and placing it in a variable line2
    line2=fgetl(fthermo);

%   getting the position of charecter"E" from the line and assigning in a
    a=strfind(line2,'E');

%   selecting the value from the first possition to 3+position of "E" we
%   get a1 the first value.
%   To get a2,a3,a4,a5 pevious 4+position of 'E' to next position of "E"+3 is taken
    a1=str2double(line2(1:a(1)+3));
    a2=str2double(line2(a(1)+4:a(2)+3));
    a3=str2double(line2(a(2)+4:a(3)+3));
    a4=str2double(line2(a(3)+4:a(4)+3));
    a5=str2double(line2(a(4)+4:a(5)+3));


%   simmilarly next line (line3)
    line3=fgetl(fthermo);
%   getting the position of charecter"E" from the line and assigning in b
    b=strfind(line3,"E") ;

%   selecting the value from the first possition to 3+position of "E" we
%   get a6 the first value.
%   To get a7,a8,a9,a10 pevious 4+position of 'E' to next position of "E"+3 is taken
    a6=str2double(line3(1:b(1)+3));
    a7=str2double(line3(b(1)+4:b(2)+3));
    a8=str2double(line3(b(2)+4:b(3)+3));
    a9=str2double(line3(b(3)+4:b(4)+3));
    a10=str2double(line3(b(4)+4:b(5)+3));


%   simmilarly next line  (line4)
    line4=fgetl(fthermo);
%   getting the position of charecter"E" from the line and assigning in b
    c=strfind(line4,'E');

%   selecting the value from the first possition to 3+position of "E" we
%   get a11 the first value.
%   To get a12,a13,a14 pevious 4+position of 'E' to next position of "E"+3 is taken
    a11=str2double(line4(1:c(1)+3));
    a12=str2double(line4(c(1)+4:c(2)+3));
    a13=str2double(line4(c(2)+4:c(3)+3));
    a14=str2double(line4(c(3)+4:c(4)+3));


%   some value definision
%   univesal gas constant R=8.31446261815324 Joule/(Kelvin × Mole)
    R=8.314462;

%   as per the given conditionwe need to use
%   the co-efficient a1,a2,a3,a4,a5,a6,a7 if the temparture > local midpoint(2500)
%   And co-efficient a8,a9,a10,a11,a12,a13,a14 if the temprature<local midpoint(2500)

%   creating a vector local low temp to high temprature
    T=linspace(local_temprature_low,local_temprature_hig,500);

%   to calculate specific heat cp
%   create a function to find cp
    CP=specific_heatnasa(a1,a2,a3,a4,a5,a8,a9,a10,a11,a12,R,T,local_temprature_med);

%   to calculate specific heat enthalpy
%   create a function to find H
    H=enthalpynasa(a1,a2,a3,a4,a5,a6,a8,a9,a10,a11,a12,a13,R,T,local_temprature_med);


%   to calculate specific heat entropy
%   create a function to find S
    S=entropynasa(a1,a2,a3,a4,a5,a7,a8,a9,a10,a11,a12,a14,R,T,local_temprature_med);


%   to calculate molecular weaight
%   create afunction to find molarweight MW
    MW=molecularweightnasa(species_name);


%   display the value on command window
    k=sprintf('%s molar weight = %f',species_name,MW);
    disp(k);

    pause(0.001);


%   creating folder to store data of each species
    speciesdata=strcat('properties of ',species_name);
%   create a directory
    mkdir(speciesdata);
%   assignibg in pwd ies the currunt working directory
    file=pwd;

    f=fullfile(speciesdata);
%   Plotting graph  for each individual data of each species

%   plotting for temprature vs specific heat
    figure(1)
    plot(T,CP,'LineWidth',2,'Color','r');
    data1=strcat(species_name,'tempvscp');
    xlabel('Temperature T')
    ylabel('Specific heat CP')
    title(species_name)
    cd(f)
    saveas(gcf,[pwd '/Temprature vs specificheat.jpeg']);
    cd(file)


%   plotting for temprature vs enthalpy
    figure(2)
    plot(T,H,'LineWidth',2,'Color','b');
    data2=strcat(species_name,'tempvsH');
    xlabel('Temperature T')
    ylabel('Enthappy H')
    title(species_name)
    cd(f)
%   saveas command to set the name of image
    saveas(gcf,[pwd '/Temprature vs Enthalpy.jpeg']);
    cd(file)


%   plotting for temprature vs entropy
    figure(3)
    plot(T,S,'LineWidth',2,'Color','g');
    data3=strcat(species_name,'tempvS');
    xlabel('Temperature T')
    ylabel('Entropy S')
    title(species_name)
    cd(f)
%   saveas command to set the name of image
    saveas(gcf,[pwd '/Temprature vs Entropy.jpeg']);
    cd(file)


end
initialy the file is open and added to a variable. fgetl comand is used to tahe the data from the line. this perticular command also helps us to skip the lines
the value is then retrived as string from the data file,. the string has to be coverted to number for usfull processing
once the individual value is reteived it is assigned to vaiable a1,a2,a3.. ie the coefficients,.also cteated a arrey with temprature.
with these data we call the function and put in the value, as shown in the euations above, we getCP,H,S,
molar mass is calculated and displayed on command window
then we creat a folder where we are going to save the images from each plot of each species
T vs CP ,T vs H ,T vs S is created for each specieas over a temprature range.
OUTPUT:
individual folder created for each species

file .images of plot saved in folder

plots of o2
plots of N2
Plot for CO2
Molar mass output:
reference: