Project 1 - Parsing NASA thermodynamic data
OBJECTIVES:
- Understand the concept of file parsing using Matlab.
- Understand how to read the NASA thermodynamic data file.
- Write a code to extract the species name, local temperature ranges and the 14 temperature coefficients from the file.
- Calculte the specific heat, enthalpy and entropy using the given equations with appropriate temperature coefficients for each temperature.
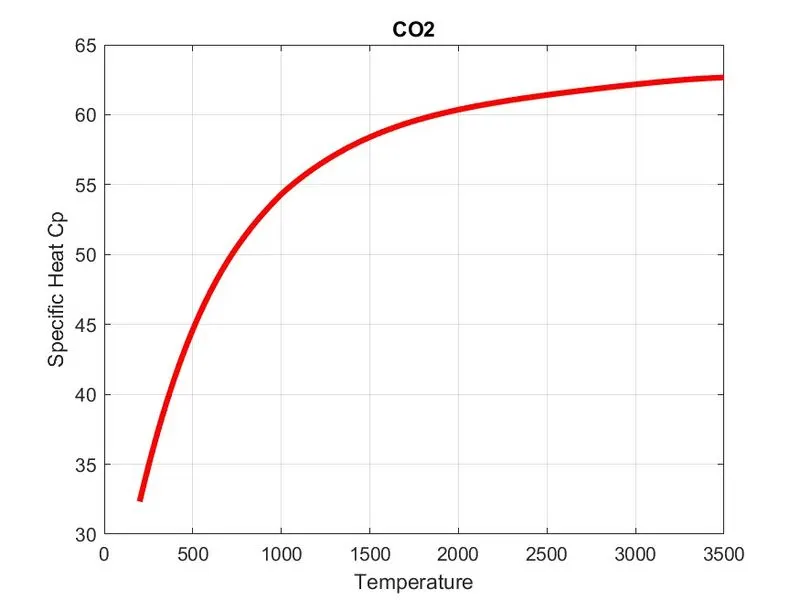
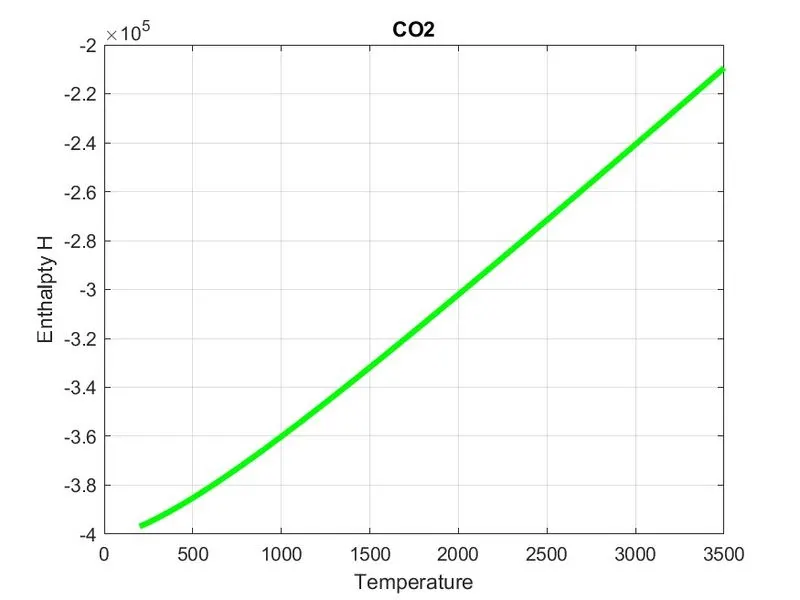
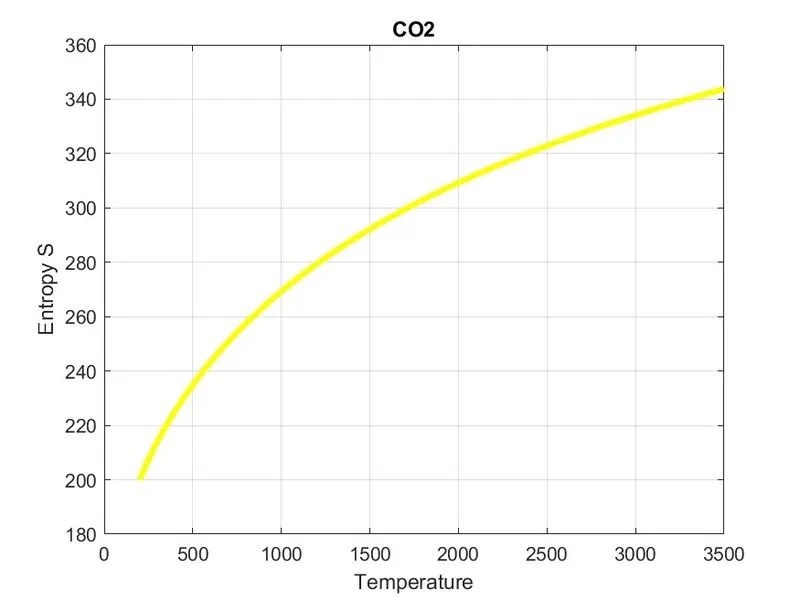
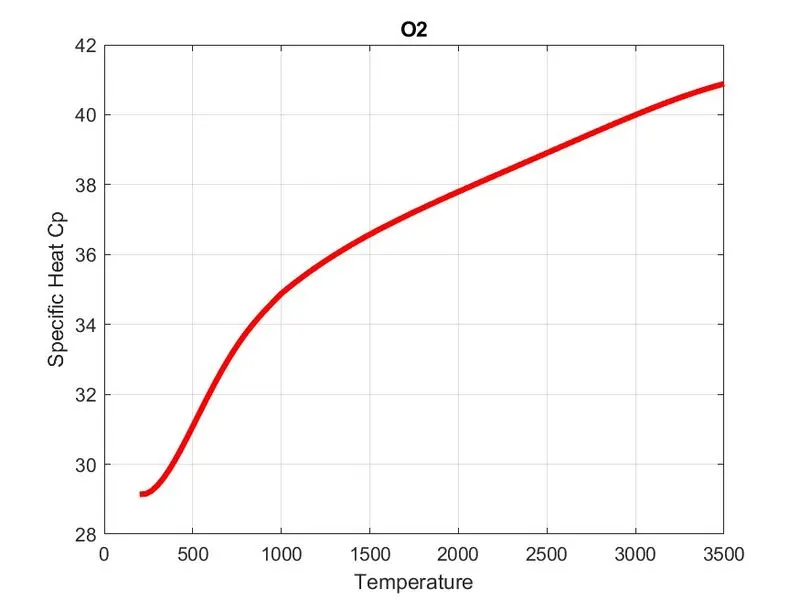
- Plot the Cp,H,S vs T graphs for each and every species.
- Save the plots as images in a folder with the species name.
- Calculate the molecular weight of each species in the command window.
CODE:
% Program about file parsing Project 1 challenge
clear all
close all
clc

% Reading the NASA thermodynamic data file
R = 8.3144598; % Universal gas constant value in J⋅mol^−1⋅K^−1
% Opening the THERMO.dat file
f1 = fopen('THERMO.dat','r');

fgetl(f1); % accesing 1st line of the file
temperature_line = strsplit(fgetl(f1),' '); % storing the second line of the file to the temperature line

% Initializing the global temperature ranges
global_low_temp = str2num(temperature_line{2});
global_mid_temp = str2num(temperature_line{3});
global_high_temp = str2num(temperature_line{4});

% Accessing the comment lines in the file
fgetl(f1);
fgetl(f1);
fgetl(f1);

% Parsing all the species details from the file
for i = 1:53
    species_line = strsplit(fgetl(f1),' '); % storing the 1st line to the species_line and splitting it
    species_name = species_line{1}; % Initializing the species name

    % Initializing local temperature ranges of the species
    species_low_temp = str2double(species_line{end-3});
    species_high_temp = str2double(species_line{end-2});
    species_mid_temp = str2double(species_line{end-1});

    coeff_line1 = fgetl(f1); % storing the 1st coefficient line
    a = strfind(coeff_line1,'E'); % Seperating the coefficient values using 'E'
    % Initializing the 1st five high temperature coefficients from 1st line
    high_temp_coeff1 = str2double(coeff_line1(1:a(1)+3));
    high_temp_coeff2 = str2double(coeff_line1(a(1)+4:a(2)+3));
    high_temp_coeff3 = str2double(coeff_line1(a(2)+4:a(3)+3));
    high_temp_coeff4 = str2double(coeff_line1(a(3)+4:a(4)+3));
    high_temp_coeff5 = str2double(coeff_line1(a(4)+4:a(5)+3));

    coeff_line2 = fgetl(f1); % storing the 2nd coefficient line
    b = findstr(coeff_line2,'E'); % Seperating the coefficient values using 'E'
    % Initializing the last two high temperature coefficients and 1st three low temperature from 2nd line
    high_temp_coeff6 = str2double(coeff_line2(1:b(1)+3));
    high_temp_coeff7 = str2double(coeff_line2(b(1)+4:b(2)+3));
    low_temp_coeff1 = str2double(coeff_line2(b(2)+4:b(3)+3));
    low_temp_coeff2 = str2double(coeff_line2(b(3)+4:b(4)+3));
    low_temp_coeff3 = str2double(coeff_line2(b(4)+4:b(5)+3));

    coeff_line3 = fgetl(f1); % storing the 3rd coefficient line
    c = strfind(coeff_line3,'E'); % Seperating the coefficient values using 'E'
    % Initializing the last four high temperature coefficients from 1st line
    low_temp_coeff4 = str2double(coeff_line3(1:c(1)+3));
    low_temp_coeff5 = str2double(coeff_line3(c(1)+4:c(2)+3));
    low_temp_coeff6 = str2double(coeff_line3(c(2)+4:c(3)+3));
    low_temp_coeff7 = str2double(coeff_line3(c(3)+4:c(4)+3));

    % Making the directory to save the plots of the species
    mkdir(['D:\Project1\Species\',species_name]);

    tspan = linspace(species_low_temp,species_high_temp,100); % creating temperature values for plot
    % calculating cp, H and S for each tspan value with appropriate
    % coefficients
    for j = 1:length(tspan)
        if tspan(j) <= species_mid_temp % indicating the low temperature range
            a1 = low_temp_coeff1;
            a2 = low_temp_coeff2;
            a3 = low_temp_coeff3;
            a4 = low_temp_coeff4;
            a5 = low_temp_coeff5;
            a6 = low_temp_coeff6;
            a7 = low_temp_coeff7;
            cp(j) = (a1 + a2*tspan(j) + a3*tspan(j)^2 + a4*tspan(j)^3 + a5*tspan(j)^4)*R;
            H(j) = (a1 + (a2*tspan(j))/2 + (a3*tspan(j)^2)/3 + (a4*tspan(j)^3)/4 + (a5*tspan(j)^4)/5 + a6/tspan(j))*R*tspan(j);
            S(j) = (a1*log(tspan(j)) + (a2*tspan(j)) + (a3*tspan(j)^2)/2 + (a4*tspan(j)^3)/3 + (a5*tspan(j)^4)/4 + a7)*R;
        else % indicating the high temperature range
            a1 = high_temp_coeff1;
            a2 = high_temp_coeff2;
            a3 = high_temp_coeff3;
            a4 = high_temp_coeff4;
            a5 = high_temp_coeff5;
            a6 = high_temp_coeff6;
            a7 = high_temp_coeff7;
            cp(j) = (a1 + a2*tspan(j) + a3*tspan(j)^2 + a4*tspan(j)^3 + a5*tspan(j)^4)*R;
            H(j) = (a1 + (a2*tspan(j))/2 + (a3*tspan(j)^2)/3 + (a4*tspan(j)^3)/4 + (a5*tspan(j)^4)/5 + a6/tspan(j))*R*tspan(j);
            S(j) = (a1*log(tspan(j)) + (a2*tspan(j)) + (a3*tspan(j)^2)/2 + (a4*tspan(j)^3)/3 + (a5*tspan(j)^4)/4 + a7)*R;
        end

    end

    % Plotting Cp vs T for the species
    figure(1)
    plot(tspan,cp,'LineWidth',3,'Color','r')
    title(species_name)
    xlabel('Temperature')
    ylabel('Specific Heat Cp')
    grid on

    % Plotting H vs T for the species
    figure(2)
    plot(tspan,H,'LineWidth',3,'Color','g')
    title(species_name)
    xlabel('Temperature')
    ylabel('Enthalpty H')
    grid on

    % Plotting S vs T for the species
    figure(3)
    plot(tspan,S,'LineWidth',3,'Color','y')
    title(species_name)
    xlabel('Temperature')
    ylabel('Entropy S')
    grid on

    % Changing the directory
    cd(['D:\Project1\Species\',species_name]);

    % Saving the plots as images in the species_name folder
    saveas(1,'Specific Heat','jpg');
    saveas(2,'Enthalpy','jpg');
    saveas(3,'Entropy','jpg');

    % Calculating Molecular weight
    atoms = ['H','C','N','O','A']; % Atoms available in the THERMO.dat file
    atomic_wt = [1.008, 12.011, 14.0067, 15.999, 39.948]; % atomic weights of the atoms respectively
    mol_wt = 0; % Initial molecular weight

    for k = 1:length(species_name) % looping over the length of the species_name
        for l = 1:length(atoms) % looping over the length of the atoms array
            if strcmp(species_name(k),atoms(l)) % checking if the atom is in the species_name
                mol_wt = mol_wt + atomic_wt(l); % adding the atomic weight if the atom exists
                atom_position = l; % storing the position of the atom postion
            end
        end
        if str2double(species_name(k)) > 1 % checking if there is any compound of any atom
           n = str2double(species_name(k));
           mol_wt = mol_wt + atomic_wt(atom_position)*(n-1); % adding the weight to mol_wt
        end

    end
    % Displaying the molecular weights of all compounds
    sprintf("Molecular weight of %s species is %f",species_name,mol_wt)

end

fclose(f1);
CODE EXPLANATION:
- Line 7: Initializing the universal gas constant R in J⋅mol^−1⋅K^−1.
- Line 9: Opening the THERMO.dat file and storing it in f1.
- Line 11: Accessing the fist line of the file.
- Line 12: Accesing the second line which is the line contsining global temperature information and storing it.
- Line 15-17: Extracting the global temperatures and storing them.
- Line 20-22: Accessing the comment lines in the file.
- Line 25: Opening the for loop to extract the necessary data from the file and calculating the Cp, H ans S for each species.
- Line 26: Accesing the first species line and splitting it individual strings.
- Line 27: Initializing the species name from the line to the variable
- Line 30-32: Extracting the local temperature values for the particular species to variables.
- Line 34: Accessing the 1st coefficient line and storing it in coeff_line1.
- Line 35: Seperating the line into coefficients using E.
- Line 37-41: Initializing the 1st five high temperature coefficients in coeff_line1.
- Line 43: Accessing the 2nd coefficient line and storing it in coeff_line2.
- Line 44: Seperating the line into coefficients using E.
- Line 46-50: Initializing the last two high temperature coefficients and 1st three low temperature coefficients in coeff_line1.
- Line 52: Accessing the 3rd coefficient line and storing it in coeff_line3.
- Line 53: Seperating the line into coefficients using E.
- Line 55-58: Initializing the last four high temperature coefficients in coeff_line3.
- Line 61: Making the directory to store the plots with the species name.
- Line 63: Creating an array of temperature values from low temperature to high temperature.
- Line 66: Opening the for loop over the length of tspan to calculate Cp, H and S for every temperature value.
- Line 67: Using if condition to assign the appropriate temperature coefficients.
- Line 68-74: Initializing a1 to a7 according to the temperature value.
- Line 75-77:Calculating Cp, H and S according to the given formulae.
- Line 79-85: Initializing a1 to a7 according to the temperature value.
- Line 86-88: Calculating Cp, H and S according to the given formulae.
- Line 94-99: Plotting Cp vs T graph with appropriate title and labels for the species in Figure1.
- Line 102-107: Plotting H vs T graph with appropriate title and labels for the species in Figure2.
- Line 110-115: Plotting S vs T graph with appropriate title and labels for the species in Figure3.
- Line 118: Changing the directory using cd() function.
- Line 121-123: Saving the plots as images in the folder with the species name.
- Line 126: Creating an array of atoms available in the data file.
- Line 127: Creating an array with the respective atomic weights.
- Line 128: Storing mol_wt with the initial value of 0.
- Line 130-142: Using nested for loop to check for atoms in the species name and adding its atomic weights.
- Line 132: Using if condition to check whether the atom is present in the species. strcmp() function is used to match the atom in the species to the atoms array. If the atom is same, strcmp() return True.
- Line 133: If the atom is present adding its atomic weight to the mol_wt.
- Line 134: Storing the atom postion before ending the if statement.
- Line 137: Checking if the species_name with the index is a nummber and greater than 1.
- Line 138-139: Adding the no.of times the atomic weight depending on the index value to the mol_wt.
- Line 144: Displaying the molecular weights of the species in the command window.
- Line 148: Closing the file f1.
OUTPUT:
ans =

    "Molecular weight of O species is 15.999000"


ans =

    "Molecular weight of O2 species is 31.998000"


ans =

    "Molecular weight of H species is 1.008000"


ans =

    "Molecular weight of H2 species is 2.016000"


ans =

    "Molecular weight of OH species is 17.007000"


ans =

    "Molecular weight of H2O species is 18.015000"


ans =

    "Molecular weight of HO2 species is 33.006000"


ans =

    "Molecular weight of H2O2 species is 34.014000"


ans =

    "Molecular weight of C species is 12.011000"


ans =

    "Molecular weight of CH species is 13.019000"


ans =

    "Molecular weight of CH2 species is 14.027000"


ans =

    "Molecular weight of CH2(S) species is 14.027000"


ans =

    "Molecular weight of CH3 species is 15.035000"


ans =

    "Molecular weight of CH4 species is 16.043000"


ans =

    "Molecular weight of CO species is 28.010000"


ans =

    "Molecular weight of CO2 species is 44.009000"


ans =

    "Molecular weight of HCO species is 29.018000"


ans =

    "Molecular weight of CH2O species is 30.026000"


ans =

    "Molecular weight of CH2OH species is 31.034000"


ans =

    "Molecular weight of CH3O species is 31.034000"


ans =

    "Molecular weight of CH3OH species is 32.042000"


ans =

    "Molecular weight of C2H species is 25.030000"


ans =

    "Molecular weight of C2H2 species is 26.038000"


ans =

    "Molecular weight of C2H3 species is 27.046000"


ans =

    "Molecular weight of C2H4 species is 28.054000"


ans =

    "Molecular weight of C2H5 species is 29.062000"


ans =

    "Molecular weight of C2H6 species is 30.070000"


ans =

    "Molecular weight of CH2CO species is 42.037000"


ans =

    "Molecular weight of HCCO species is 41.029000"


ans =

    "Molecular weight of HCCOH species is 42.037000"


ans =

    "Molecular weight of H2CN species is 28.033700"


ans =

    "Molecular weight of HCN species is 27.025700"


ans =

    "Molecular weight of HNO species is 31.013700"


ans =

    "Molecular weight of N species is 14.006700"


ans =

    "Molecular weight of NNH species is 29.021400"


ans =

    "Molecular weight of N2O species is 44.012400"


ans =

    "Molecular weight of NH species is 15.014700"


ans =

    "Molecular weight of NH2 species is 16.022700"


ans =

    "Molecular weight of NH3 species is 17.030700"


ans =

    "Molecular weight of NO species is 30.005700"


ans =

    "Molecular weight of NO2 species is 46.004700"


ans =

    "Molecular weight of HCNO species is 43.024700"


ans =

    "Molecular weight of HOCN species is 43.024700"


ans =

    "Molecular weight of HNCO species is 43.024700"


ans =

    "Molecular weight of NCO species is 42.016700"


ans =

    "Molecular weight of CN species is 26.017700"


ans =

    "Molecular weight of HCNN species is 41.032400"


ans =

    "Molecular weight of N2 species is 28.013400"


ans =

    "Molecular weight of AR species is 39.948000"


ans =

    "Molecular weight of C3H8 species is 44.097000"


ans =

    "Molecular weight of C3H7 species is 43.089000"


ans =

    "Molecular weight of CH3CHO species is 44.053000"


ans =

    "Molecular weight of CH2CHO species is 43.045000"

>>
OUTPUT EXPLANATION:
- The molecular weight of the species with species name is diaplayed in the command window for all 53 species.
REQUESTED SCREENSHOT:

REQUESTED PLOTS:
Specific Heat,Enthalpy and Entropy Vs T for O2
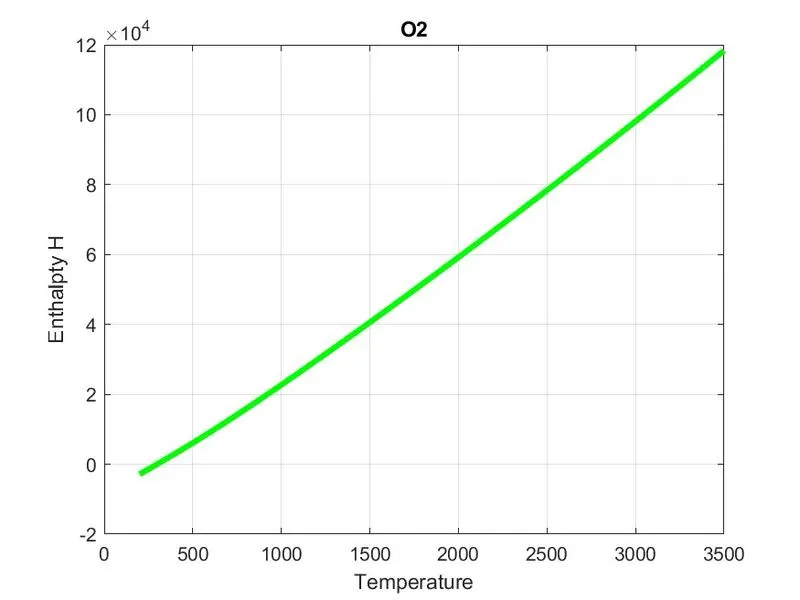
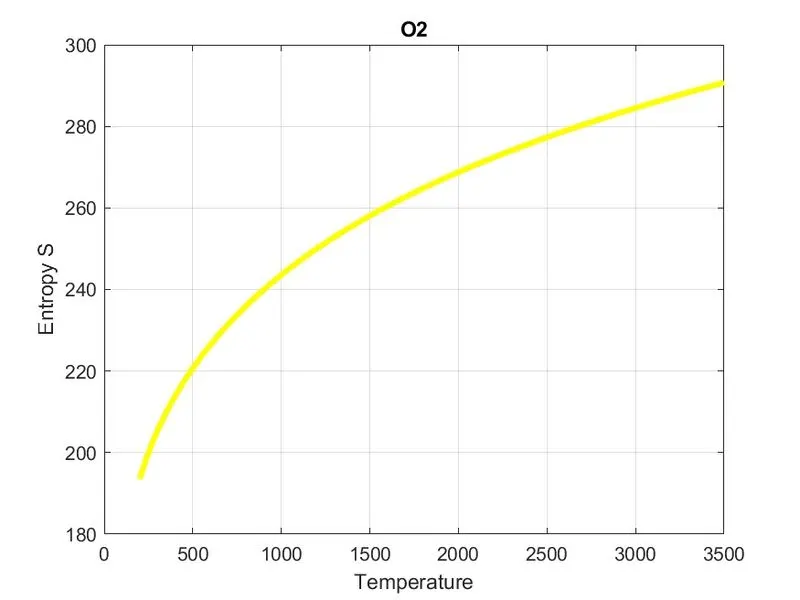
Specific Heat,Enthalpy and Entropy Vs T for N2
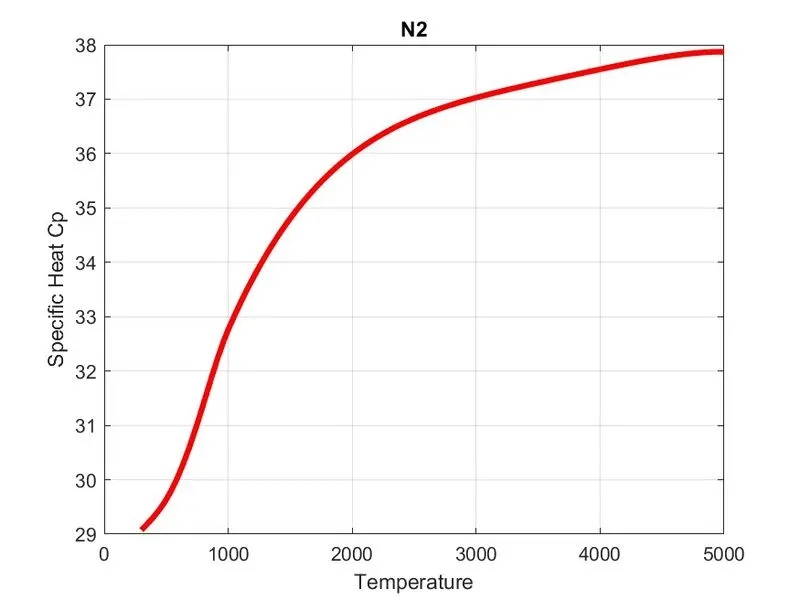
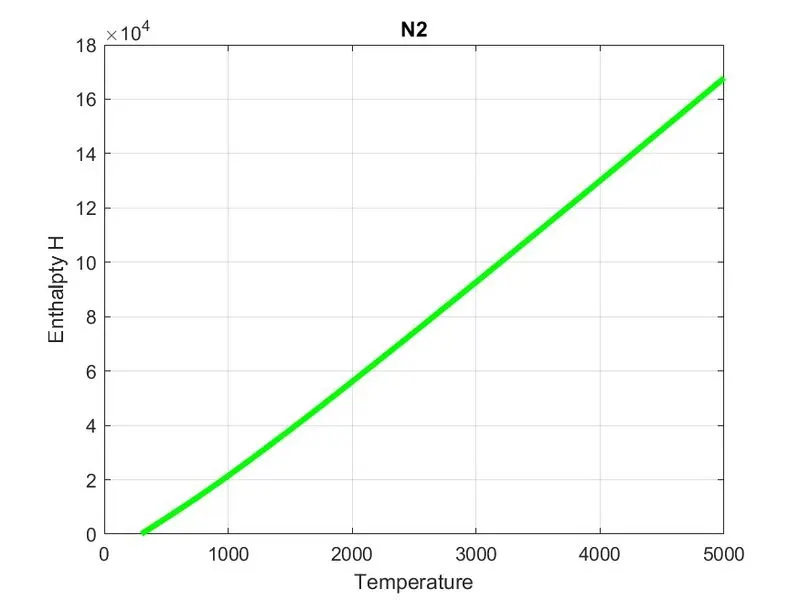
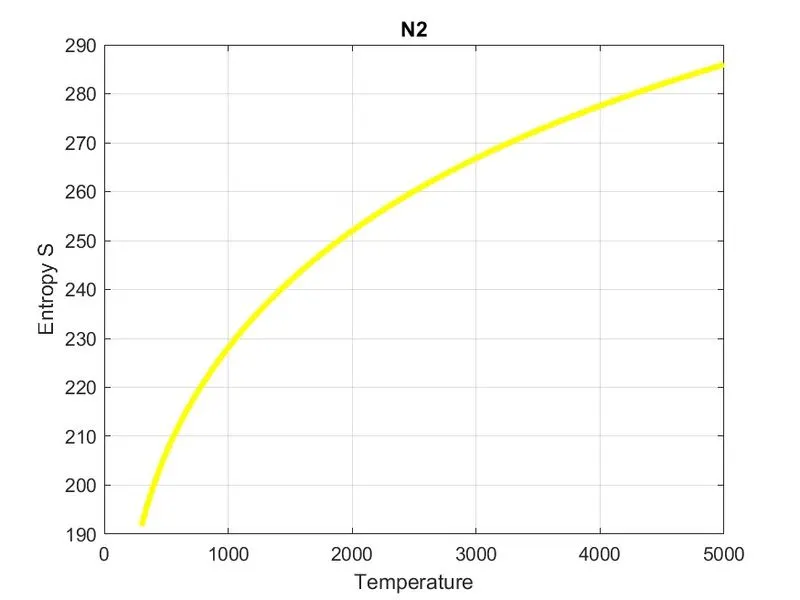
Specific Heat,Enthalpy and Entropy Vs T for CO2