Project 1 - Parsing NASA thermodynamic data
Main code:

clear all
close all
clc

% opening file
f1=fopen('THERMO.dat','r');

%skipping first  line
a=fgetl(f1);

% global temperatures
temps= fgetl(f1);
temps= str2num(temps);

global_low_temp= temps(1);
global_mid_temp= temps(2);
global_high_temp= temps(3);

% Creating an array for temp
% T= linspace(global_low_temp, global_high_temp, 500);

% Universal gas constant
R=8.314;

% Skipping next 3 lines
for i=1:3
    fgetl(f1);
end

% Storing space
for i=1:53

    % Creating array for species
    tline= fgetl(f1);
    A= strsplit(tline,' ');
    % Species
    species= A{1};

    % Local temperature
    tlow= str2num(A{end-3});
    thigh= str2num(A{end-2});
    tmid= str2num(A{end-1});

    T= linspace (tlow, thigh, 500);

    % Finding coeff's
    % line 1
    tline1= fgetl(f1);
    pos1= findstr(tline1, 'E');

    % Higher coeff's
    a1= str2num(tline1(1:pos1(1)+3));
    a2= str2num(tline1(pos1(1)+4:pos1(2)+3));
    a3= str2num(tline1(pos1(2)+4:pos1(3)+3));
    a4= str2num(tline1(pos1(3)+4:pos1(4)+3));
    a5= str2num(tline1(pos1(4)+4:pos1(5)+3));

    % line 2
    tline2= fgetl(f1);
    pos2= findstr(tline2, 'E');
    a6= str2num(tline2(1:pos2(1)+3));
    a7= str2num(tline2(pos2(1)+4:pos2(2)+3));

    % Lower coeff's

    a8= str2num(tline2(pos2(2)+4:pos2(3)+3));
    a9= str2num(tline2(pos2(3)+4:pos2(4)+3));
    a10= str2num(tline2(pos2(4)+4:pos2(5)+3));

    % line 3
    tline3= fgetl(f1);
    pos3= findstr(tline3, 'E');
    a11= str2num(tline3(1:pos3(1)+3));
    a12= str2num(tline3(pos3(1)+4:pos3(2)+3));
    a13= str2num(tline3(pos3(2)+4:pos3(3)+3));
    a14= str2num(tline3(pos3(3)+4:pos3(4)+3));

    % Specific heat
    cp= specific_heat(a1,a2,a3,a4,a5,a8,a9,a10,a11,a12,tmid,T,R);

    % Enthalpy
    H= enthalpy_H(a1,a2,a3,a4,a5,a6,a8,a9,a10,a11,a12,a14,tmid,T,R);

    % Entropy
    S= entropy_S(a1,a2,a3,a4,a5,a7,a8,a9,a10,a11,a12,a14,tmid,T,R);

    % changing directory

   % creating new folder for species
   mkdir (species)

   % changing directory
   cd(species)

   % plotting

   figure(1)
   plot (T,cp)
   xlabel('temperature');
   ylabel('Specific heat');
   title('Specific heat Vs Temperature of', sprintf ('%s', species))
   saveas(figure(1), 'cp Vs T.jpg')

   figure(2)
   plot (T,H)
   xlabel('temperature');
   ylabel('Enthalpy');
   title('Enthalpy Vs Temperature of', sprintf ('%s', species))
   saveas(figure(2), 'H Vs T.jpg')

   figure(3)
   plot (T,S)
   xlabel('temperature');
   ylabel('Entropy');
   title('Entropy Vs Temperature of', sprintf ('%s', species))
   saveas(figure(3), 'S Vs T.jpg')

   % coming back to program directory
   cd ..

   % Calculating the molecular weight of the species
   M= mol_wt(species);

end

Function code for specific heat (cp):

function [Cp]= specific_heat(x1,x2,x3,x4,x5,x8,x9,x10,x11,x12,tmid,temp,R)

% first 7 coeff's are high temp coeff's and next 7 are low temp coeff's
if(temp<=tmid)
    Cp= R*(x8+(x9*temp)+(x10*(temp).^2)+(x11*(temp).^3)+(x12*(temp).^4));
else
    Cp= R*(x1+(x2*temp)+(x3*temp).^2)+(x4*(temp).^3)+(x5*(temp).^4);
end
end

Function code for enthalpy (H):

function [H]= enthalpy_H(x1,x2,x3,x4,x5,x6,x8,x9,x10,x11,x12,x13,tmid,temp,R)

% first 7 coeff's are high temp coeff's and next 7 are low temp coeff's
if(temp<=tmid)
    H= R*temp.*(x8+((x9*temp)/2)+((x10*(temp).^2)/3)+((x11*(temp).^3)/4)+((x12*(temp).^4)/5)+((x13./temp)));
else
    H= R*temp.*(x1+((x2*temp)/2)+((x3*temp).^2)/3)+((x4*(temp).^3)/4)+((x5*(temp).^4)/5)+((x6./temp));

end
end

Function code for entropy (S):

function [S]= entropy_S(x1,x2,x3,x4,x5,x7,x8,x9,x10,x11,x12,x14,tmid,temp,R)

% first 7 coeff's are high temp coeff's and next 7 are low temp coeff's
if(temp<=tmid)
    S= x8*log(temp)+x9*(temp)+(x10*(temp.^2)/2)+(x11*(temp.^3)/3)+(x12*(temp.^4)/4+(x14))*R;
else
    S= (x1*log(temp)+(x2*temp)+(x3*(temp.^2)/2)+(x4*(temp.^3)/3)+(x5*(temp.^4)/4)+(x7))*R;

end
end

Function code for molecular weight(mw):

function mw= mol_wt(sp_name)

% storing value
compound_name= (sp_name);

% creating an array of elements
key_at=['C','H','O','N','A'];

% Atomic values in an array
value_at=[12.0107  1.00794  15.994  14.0067  39.948]

% assign mol. mass as 0
mw=0;

% creating loop
for i=1:length(compound_name)
    for j=1:length(key_at)

        % compare str value
        if strcmp(compound_name(i), key_at(j));

            %if above comparison is true, mol.mass is calculated
            mw= mw+value_at(j);

            % storing the position for further use
            pos=j;
        end
    end

    % converting the string to number
    k= str2num(compound_name(i));

    % comparing if the value of kis greater than executed , the further
    % statements
    if (k>1)

        % mol. mass calculation
        mw= mw+value_at(pos)*(k-1);
    end
end
% command to print the mol. mass of the molecule
fprintf ('Molecular weight of the species %s is %f', compound_name,mw)
end
Explanation for the main code:
First step is to clear the screen and workspace followed by closing all the history in workspace by givinf close all and clc. Thermodata file is downloaded and copied to the folder in desktop "FILE PARSING". In the program, the first is to open and read the file using fopen command, which is storedto the variable f1. Then, unnecessary lines are skipped using fgetl command by storing to variable a. str2num command is used to convert character/ string to numeric. Here R is Universal Gas Constant which is equal to 8.314. Then we are skipping the next three lines using fgetl command by the for loop option. Here in this challenge we are 53 species, so inorder to create individually we are using for loop option from 1 to 53 species. Starting from line no. 6, it is given a name tline. Since, we are having some spaces in data file in order to skip the spaces we are using strsplit command. Then, we are declaring the local temps, i.e tlow, thigh,tmid. In the same line, taking the end as reference we are calculating the position of all three temperatures using str2num command. Using linspace command, temperatures are divided into an interval of 500 between thigh and tlow. Then, next objective is to find the temperature coefficients where T=local temperature, a1-a7= high temperature coefficients; a8-a14= low temperature coefficients. To go to the next line we are using fgetl command and that line we are storing to a variable tline1. In the data file, we can find exponent 'E' as common in the all the coefficients. So taking that as reference i.e pos 1(1), we are calculating the remaining coefficients in the respective line. Now to come to next line, we are using fgetl command and that is stored to a variable tline2. So, in the same way by taking 'E' the four coefficients are calculated. In this way, all the 14 coefficients are calculated. These coefficients are only for one species i.e O. Similarly for remaining 52 species using for loop the temperature coefficients are calculated.
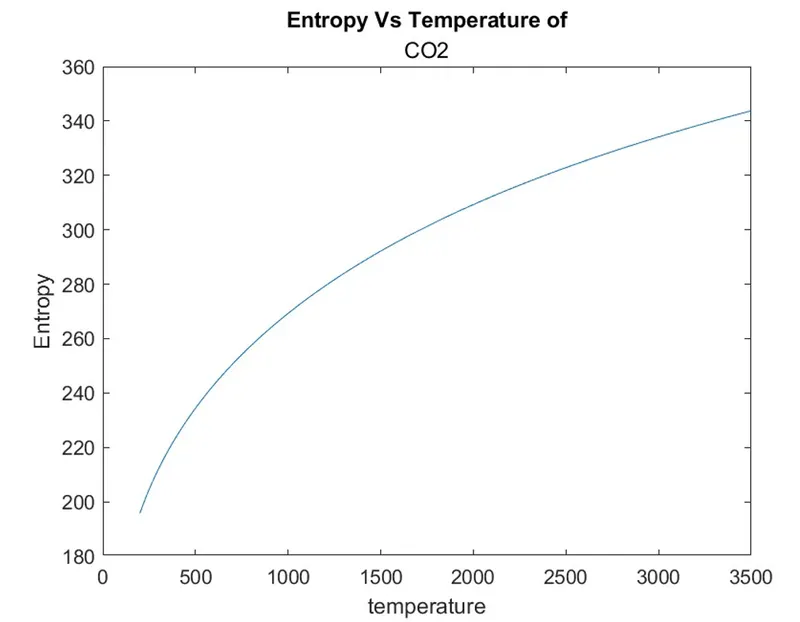
As given above, we have to calculate for specific weights, enthalpy, entropy and molecular weight is calculated using the function codes. After that using mkdir command, a new directory is created for all 53 species and using cd command, directory is changed for all 53 species. Then, using plot command we are plottind temperature Vs Specific heat, temperature Vs Enthalpy, temperature Vs Entropy and temperature Vs Molecular weight is plotted in the form of a graph and saved in the form of .jpg file using saveas command. cd. . is to come back to the directory.
Explanation for Specific heat function code:
Here if else statement is used i.e if temp<=tmid, then low temperature coefficients are calculated. If the condition is not satisfied, then high temperature coefficients are calculated. Here temperature coefficients x1-x5, x8-12 are computed.
Explanation for Enthalpy function code:
Similar to specific heat, enthalpy is also calculated in the same way using if else statement. But here x1-x6 and x8-x13 is calculated.
Explanation for Entropy function code:
Similar to specific heat, enthalpy is also calculated in the same way using if else statement. But here x1-x5 and x7-x14 is calculated.
Explanation for Molecular weight function code:
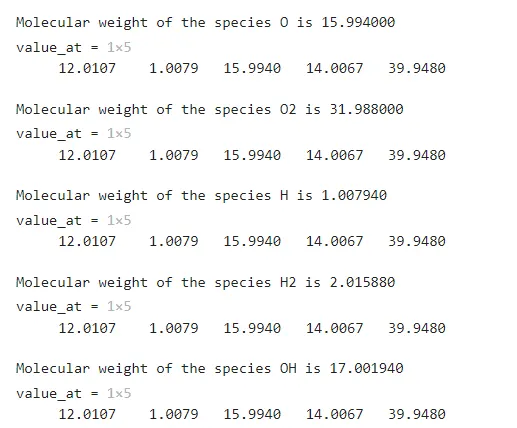
In the data file in all 53 species we are having 5 common elements i.e C, H, O, N, A. We are declaring the species name to a variable compound_name. And then we are creating an array of elements by storing to a variable key_at for C, H, O, N, A. Then an array of atomic weights for all the 5 elements are declared to a variable value_at. and assuming atomic mass as negligible. Then a variable 'i' is declared for dipalying the species name by using a for loop. Then to calculate the molecular masses, for loop is being used by taking the 5 elements from array. strcmp command is used to compare 2 strings, if the condition is true molecular mass for that particular compound is calculated if false then it will run the next condition and gets stored. Finally, to print the output in the screen printf command is used.
Outputs:
For O2:
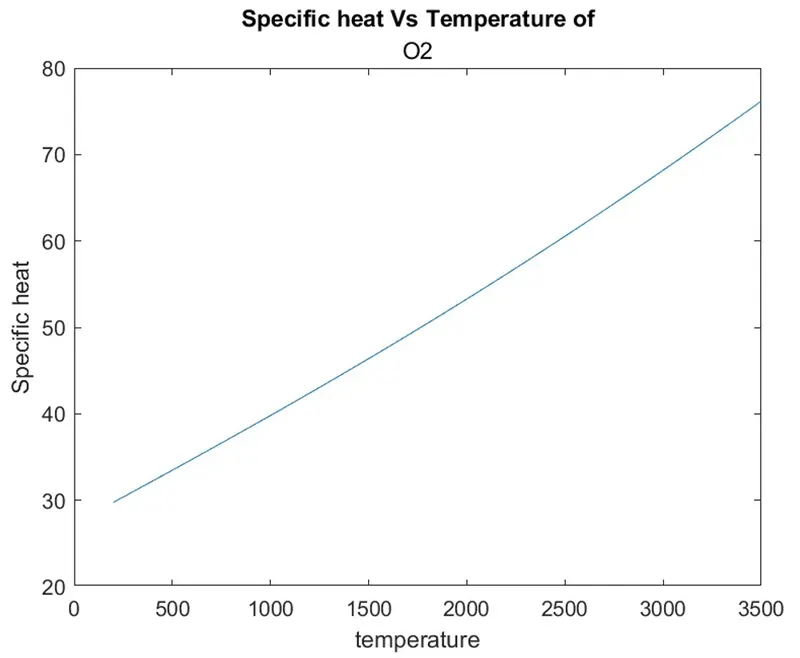
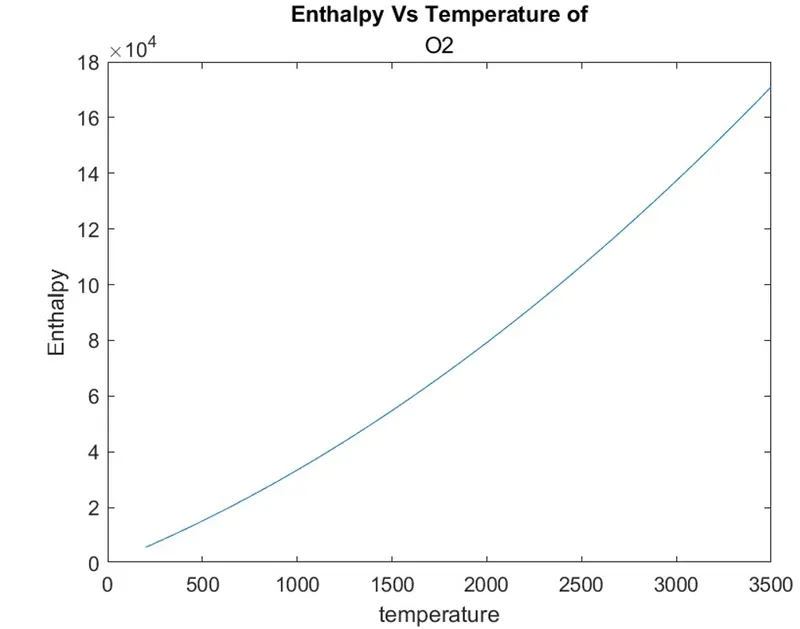
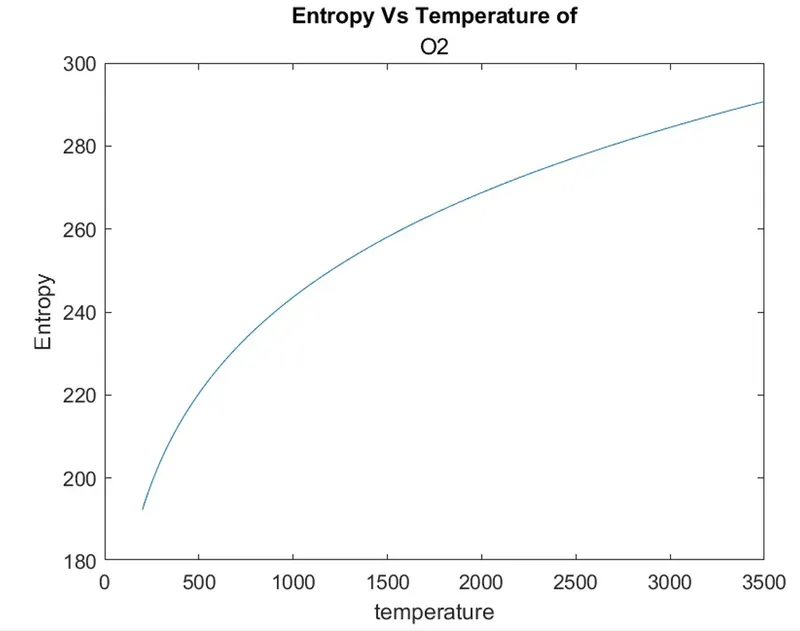
For N2:
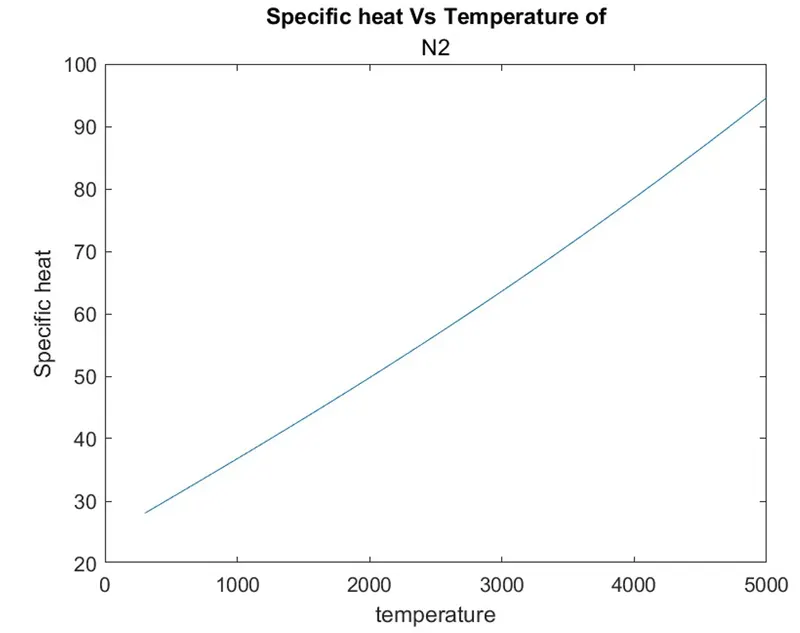
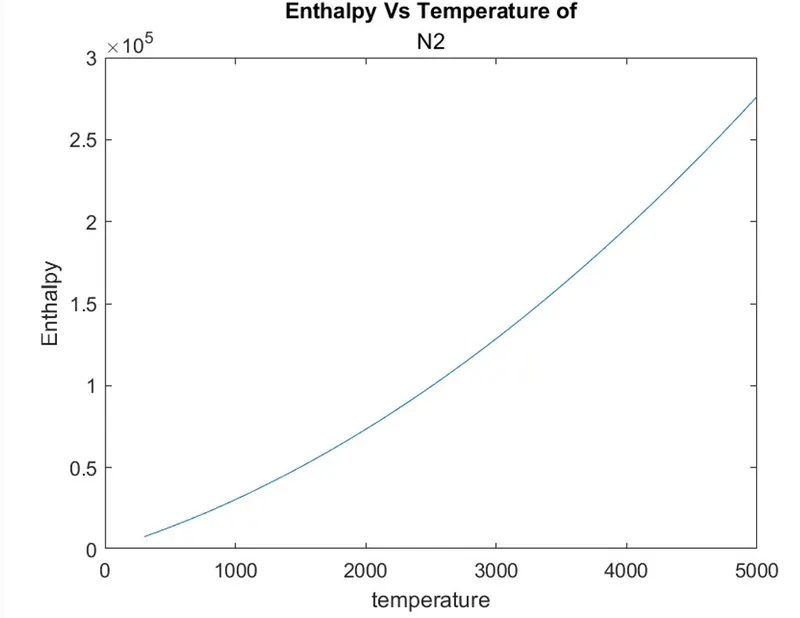
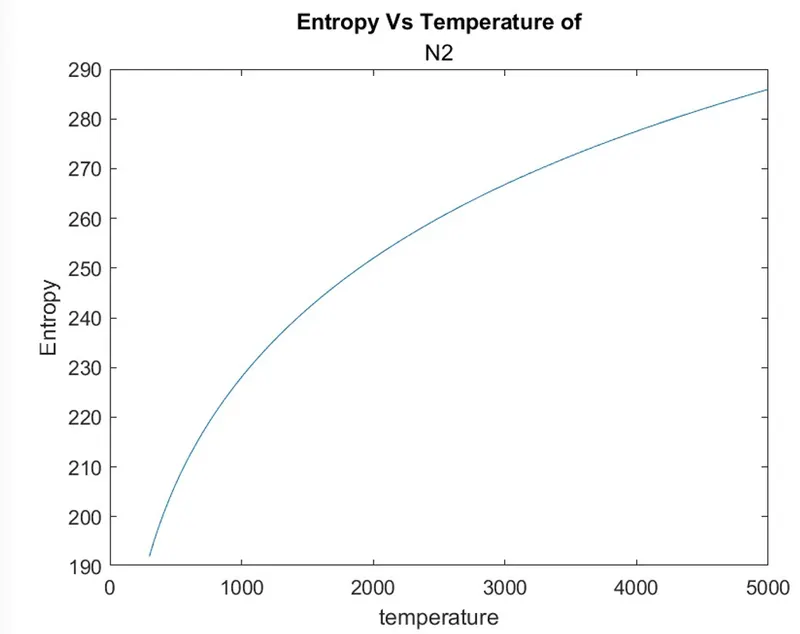
For CO2:
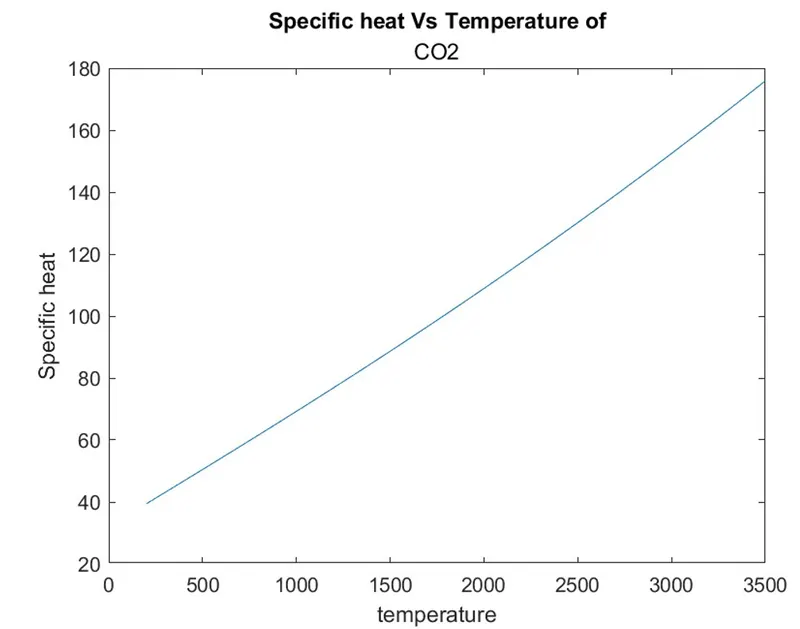
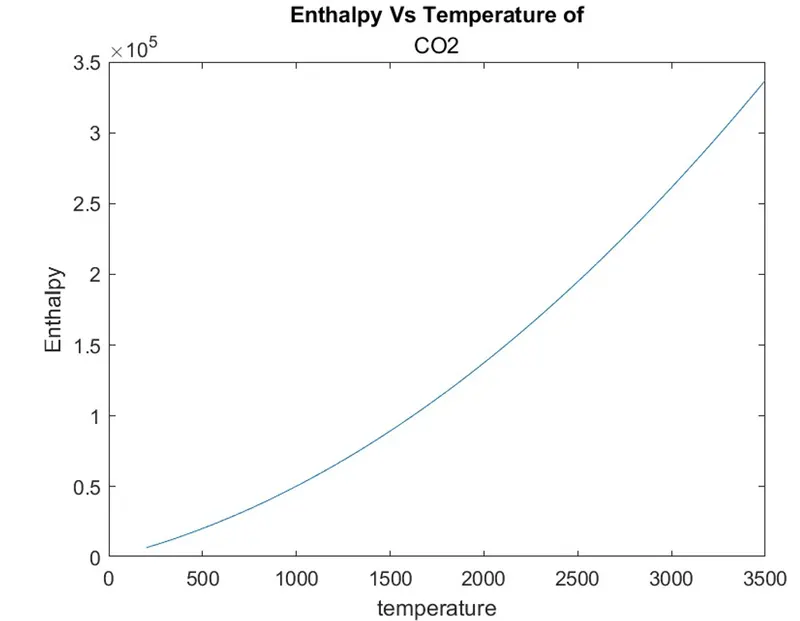
Screenshot of all the 53 species created:

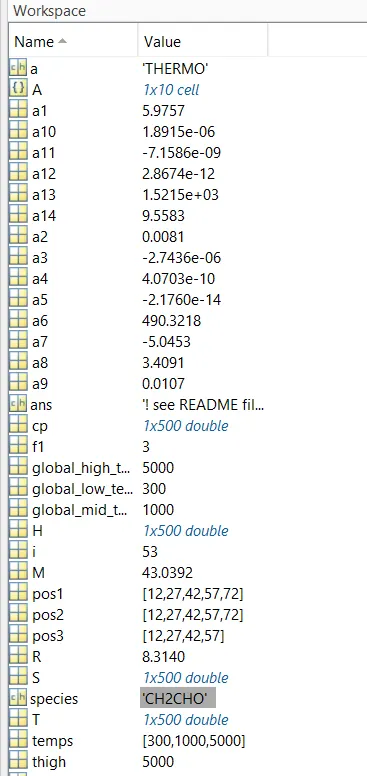
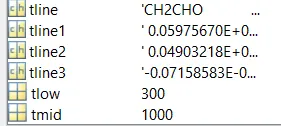
Workspace screenshot:
Molecular weights ( 5 species) in command window:
Errors occured: Minor error like missing of apostrophe was there and we can avoid by looking at the error pop out in workspace
Conclusion: Thus, we have plotted the variation of thermodynamic properties with temperature of various species using NASA thermodynamic data.
References: