Challenge

Project 1 - Parsing NASA thermodynamic data

Project 1 - Parsing NASA thermodynamic data

Aim :- Write a code in matlab to parse the NASA thermodynamics data file and calculate the thermodynamic properties of various species.

Objective

  • write a function that extracts the 14 co- efficients nad calculate.
  • We have calculate the entrophy, specific heat for all species in the data.
  • to calculate molecular weight of each species and display the commond windows.
  • finally we have plot the enthalphy, entrophy, specific heat for the local temprature range.
  • we have calculate the low temprature and high temprature.
  • the main program we have save as 'THEMO.dat' file.
  • Input generate Cp, H, S.
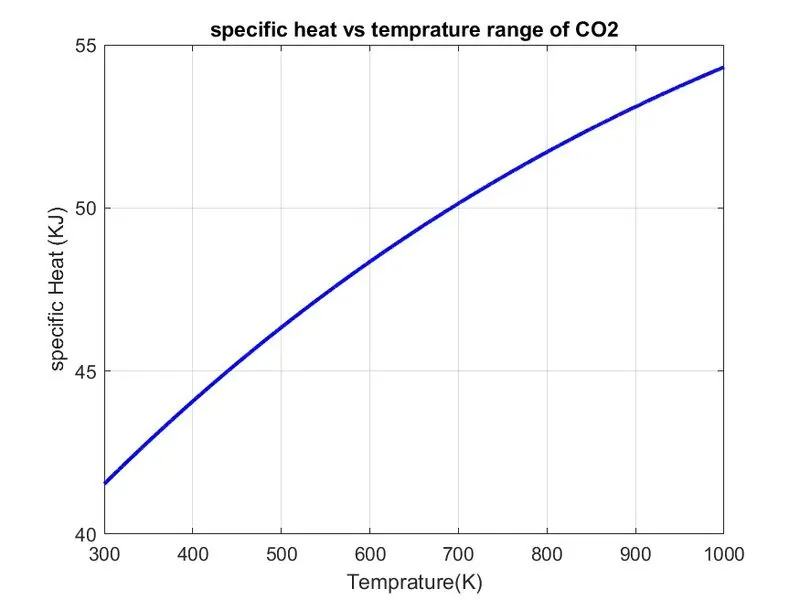
  • Plots for O2,O,N2,CO2 species.

File parsing :-

the file parsing is the process of anlyzing a string of symbols in natural language. the term parasing come pars means parts spreach.

some parsing alogrithm may generate parsing in front of its list of parse trees of syntallically.

NASA thermo data files:-

where,

R = Univesal Gas constant 8.314

T = Temprature

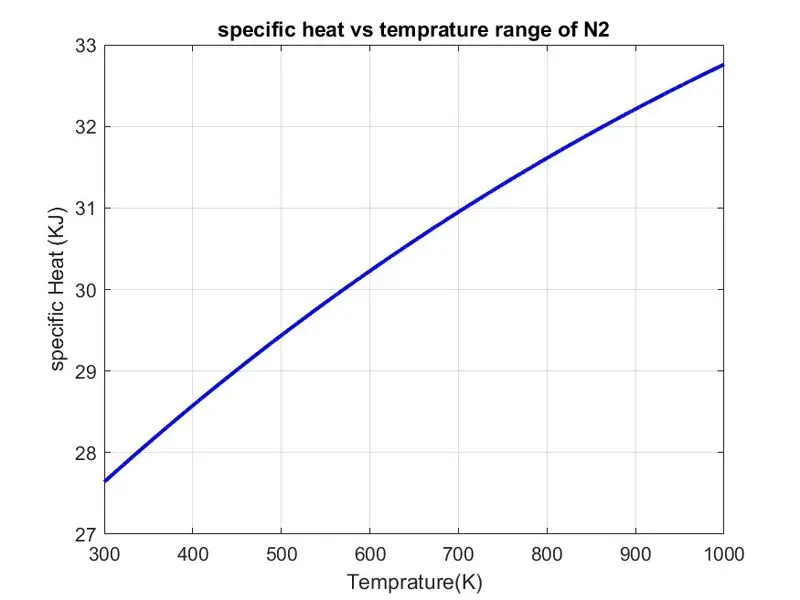
Cp = Specific Heat[KJ]

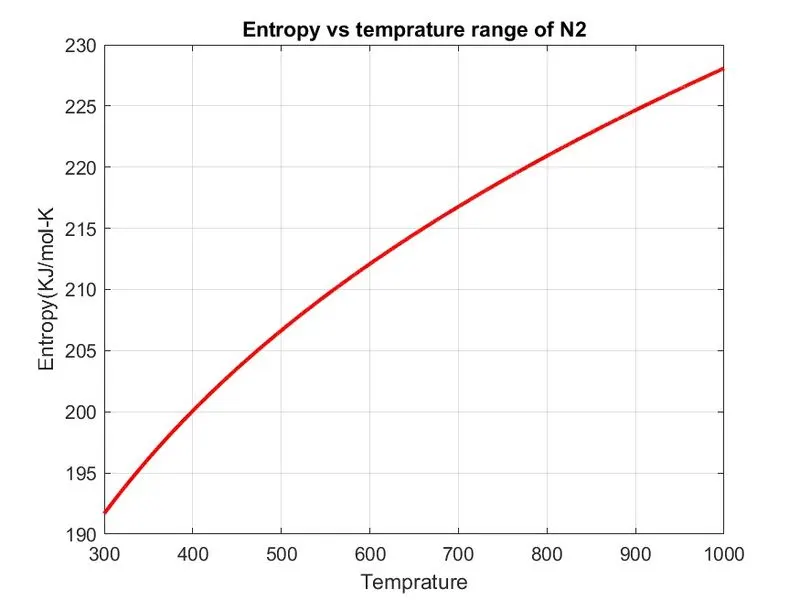
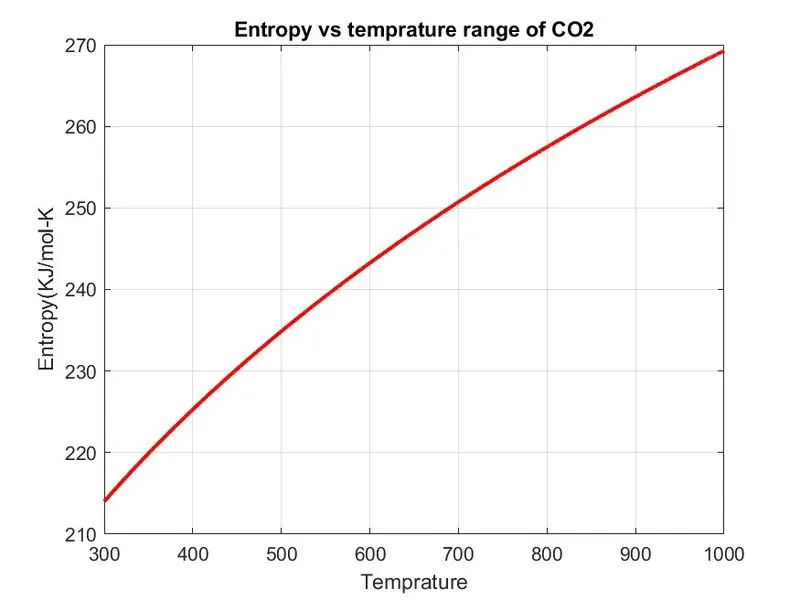
S = Entropy[KJ/mol]

H = Enthaphy

a(i) = co- efficients

Whare i = 1 to 14

here i will show data files some parts
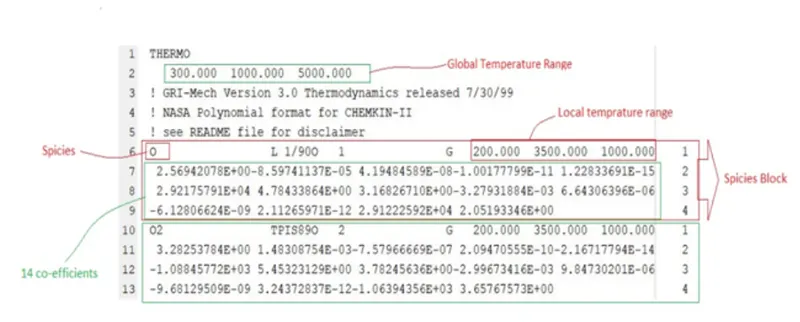
important definitions of specific heat, enthaphy, entropy is below

Specfic Heat :-

the quantity of heat required to raise the temprature of one gram of a substance by one celsius degree. The units of specific heat are usually calories or joules per gram per Celsius degree.

Specific heat capacity is a measure of the amount of heat energy required to change the temperature of 1 kg of a material by 1 K. Hence it is important as it will give an indication of how much energy will be required to heat or cool an object of a given mass by a given amount.

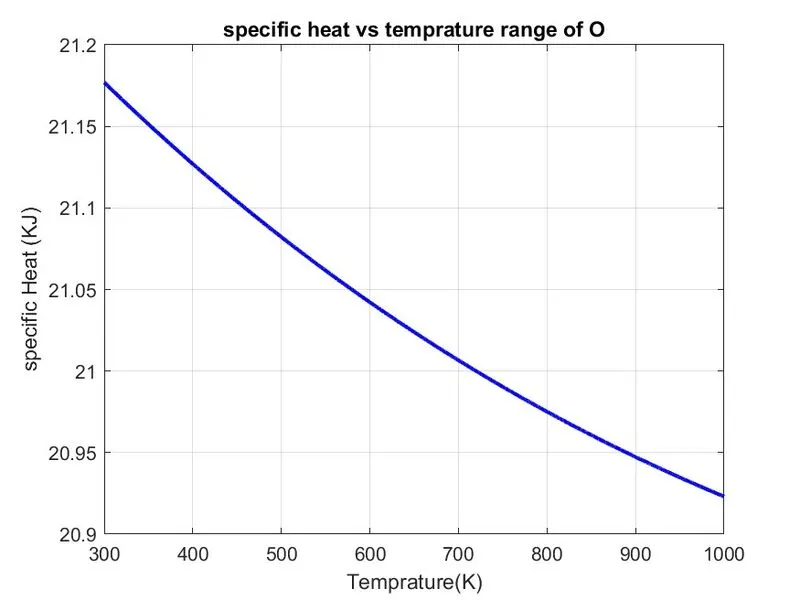
Cp = R*(a1+(a2*T)+(a3*(T).^2)+(a4*(T).^3)+(a5*(T).^4))
Enthalpy:-
Enthalpy is the measurment of energy in a thermodyamics system.
the quantity of equals to the total content heat of system equivalent the system intenal energy plis the product of volume and pressure.
enthalpy of a gas decreases with pressure at constant temperature.
Enthalpy of the liquid phase at constant temperature remains constant for moderate pressures.
In the SI unit of measurement for enthalpy is the joule. Other historical conventional units still in use include the calorie and the british thermal units (BTU).
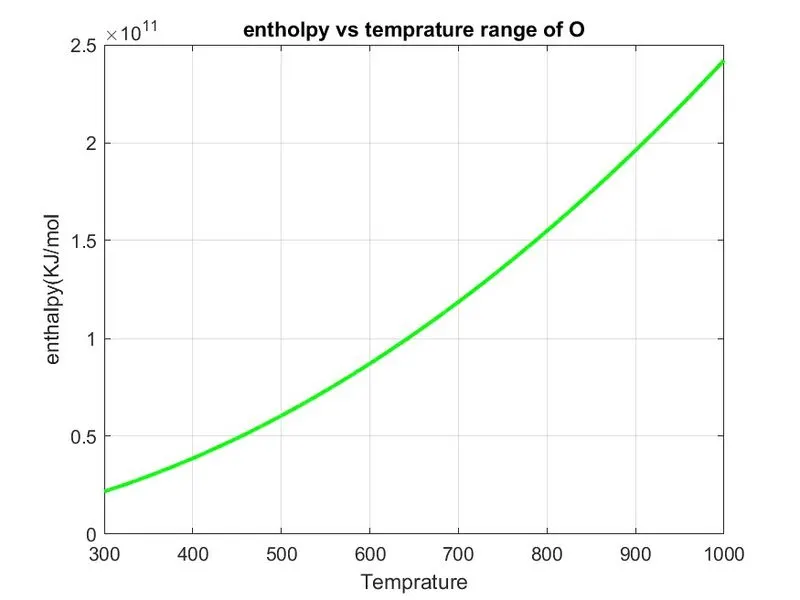
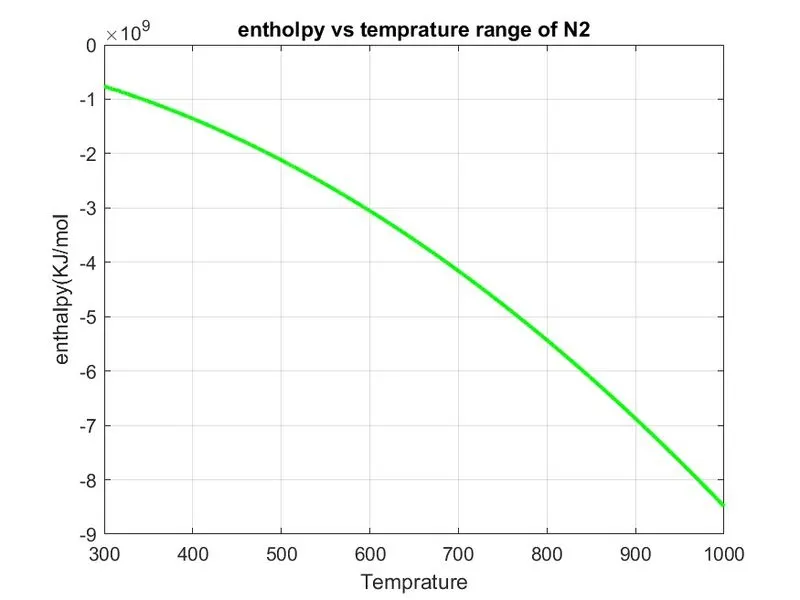
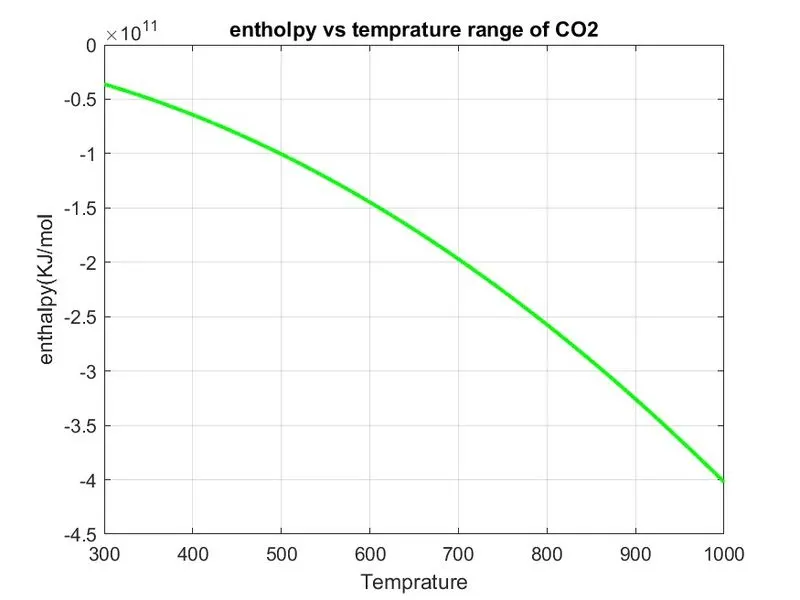
H = R*T.*(a1+((a2.*T)/2)+((a3*(T).^2)/3)+((a4*(T).^3)/4)+((a5*(T).^4)/5)+(a6*(T)))
Entropy:-
the second low of thermodynamics state that the total entropy of the system either increase of remains constant in any spontenous processs it never decreases.
  • It is represented by S but in the standard state, it is represented by S°.
  • Its SI unit is J/Kmol.
  • Its CGS unit is cal/Kmol.
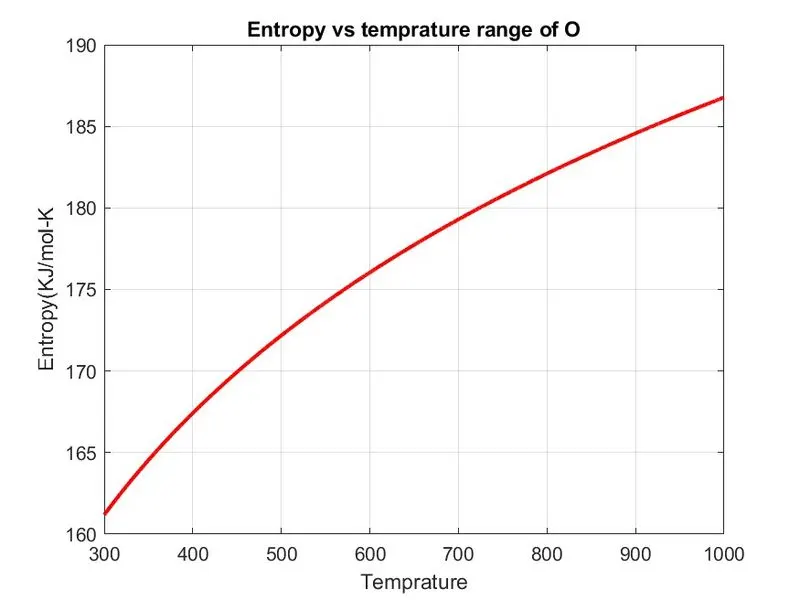
S = R*(a1*log(T) + (a2*T) + ((a3*(T).^2)/2) + ((a4*(T).^3)/3) + ((a5*(T).^4)/4) + a7)
Molecular Weight :-
The sum of the atomic masses of all atoms in a molecule, based on a scale in which the atomic masses of hydrogen, carbon, nitrogen, and oxygen are 1, 12, 14, and 16, respectively. For example, the molecular weight of water, which has two atoms of hydrogen and one atom of oxygen, is 18 (i.e., 2 + 16). Also called molecular mass.
The atomic weight of carbon and hydrogen may be found on a periodic table. molecular weight = (number of carbon atoms)(C atomic weight) + (number of H atoms)(H atomic weight)
Steps :-
  • thermo.dat file (input parameter)
  • fgetl ( we read temprature and split the temprature)
  • strsplit (convert into cell array)
  • str2num ( to find lower temprature and higher temprature)
  • mkdir ( to create the file folder)
  • cd (change into the directory)

Finding of NASA thermpodynamics data

  1. Local tempratures and higher tempratures.
  2. enthalpy, entropy, specific heat.
  3. molecular weight.

Main program of file parsing NASA thermodynamic

%main program
clear all
close all
clc
%inputs
R = 8.314 %gas constant
% open file and reading THERO.dat file
f1 = fopen('THERMO.dat','r');
get = fgetl(f1);
%Now reading temprature from this data
temp = fgetl(f1);
%spliting
s = strsplit(temp);
%converting strings cell into numbers
templow = str2double(s{2});
tempmid = str2double(s{3});
temphigh = str2double(s{4});
%Temprature range
T = linspace(templow,tempmid,temphigh);
%skipping command lines
for i = 1:3
get = fgetl(f1);
end
%reading spacies
for j = 1:53
tline = fgetl(f1);
A = strsplit(tline,' ');
species = (A{1});
%converting string to number
lowtemp = str2double(A{end-3});
midtemp = str2double(A{end-2});
hightemp = str2double(A{end-1});
tline1 = fgetl(f1);
a = strfind(tline1, 'E');
%getting next line
% line1 = fgetl(f1);
%
%finding first 7 higher
a1 = tline1(1:a(1)+3);
a1 = str2double(a1);
a2 = tline1(a(1)+4:a(2)+3);
a2 = str2double(a2);
a3 = tline1(a(2)+4:a(3)+3);
a3 = str2double(a3);
a4 = tline1(a(3)+4:a(4)+3);
a4 = str2double(a4);
a5 = tline1(a(4)+4:a(5)+3);
a5 = str2double(a5);
tline2 = fgetl(f1);
%getting next line
b = strfind(tline2, 'E');
a6 = tline2(1:b(1)+3);
a6 = str2double(a6);
a7 = tline2(b(1)+4:b(2)+3);
a7 = str2double(a7);
a8 = tline2(b(2)+4:b(3)+3);
a8 = str2double(a8);
a9 = tline2(b(3)+4:b(4)+3);
a9 = str2double(a9);
a10 = tline2(b(4)+4:b(5)+3);
a10= str2double(a10);
tline3 = fgetl(f1);
%getting next line
c = strfind(tline3, 'E');
%finding first 11 higher
a11 = tline3(1:c(1)+3);
a11 = str2double(a11);
a12 = tline3(c(1)+4:c(2)+3);
a12 = str2double(a12);
a13 = tline3(c(2)+4:c(3)+3);
a13 = str2double(a13);
a14 = tline3(c(3)+4:c(4)+3);
a14= str2double(a14);
%calculate specific heat
Cp = specific_heat(a1,a2,a3,a4,a5,a6,a7,a8,a9,a10,a11,a12,T,R,tempmid);
S =entropy(a1,a2,a3,a4,a5,a7,a8,a9,a10,a11,a12,a14,T,R,tempmid);
%calculate enthaphy
H = enthaphy(a1,a2,a3,a4,a5,a6,a8,a9,a10,a11,a12,a13,T,R,tempmid)
%calculate molecular weight
W = Molecular_weight(species)
%write the molecular weight
MW_file = fopen('Molecular_weight.txt','w');
fprintf(MW_file,'molecular weight of %s is %d',species,W);
fclose(MW_file); % closing file
%ploting Cp, H and S with temprature
%sloving in a folder
% changing the directory
%cd('C:\Users\eligma\Desktop\project 1 NASA')
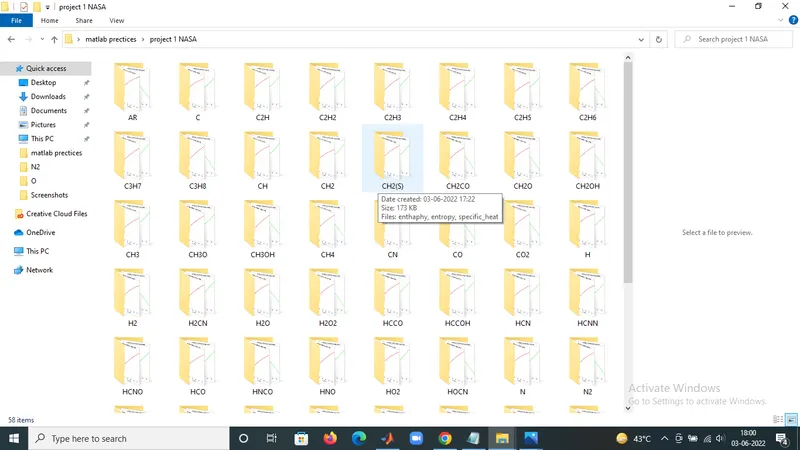
mkdir(species);
% creating Directory
cd(species);
%plot Cp vs T
figure(1)
plot(T,Cp,'linewidth',2,'color','b');
xlabel('Temprature(K)');
ylabel('specific Heat (KJ)');
title(sprintf('specific heat vs temprature range of %s',species));
grid on
%plot S vs T
figure(2)
plot(T,S,'linewidth',2,'color','r');
xlabel('Temprature');
ylabel('Entropy(KJ/mol-K');
title(sprintf('Entropy vs temprature range of %s',species));
grid on
%plot Cp vs T
figure(3)
plot(T,H,'linewidth',2,'color','g');
xlabel('Temprature');
ylabel('enthalpy(KJ/mol');
title(sprintf('entholpy vs temprature range of %s',species));
grid on
saveas(1,'specific_heat','jpg')
saveas(2,'entropy','jpg')
saveas(3,'enthaphy','jpg')
cd ..
end
Specific heat code function program
farmula:- Cp = R*(a1+(a2*T)+(a3*(T).^2)+(a4*(T).^3)+(a5*(T).^4))
function Cp = specific_heat(a1,a2,a3,a4,a5,a6,a7,a8,a9,a10,a11,a12,T,R,tempmid)
if(T<=tempmid)
Cp = R*(a1+(a2*T)+(a3*(T).^2)+(a4*(T).^3)+(a5*(T).^4));
else
Cp = R*(a8+(a9*T)+(a10*(T).^2)+(a11*(T).^3)+(a12*(T).^4));
end
Entropy code function program
farmula:-
S = R*(a1*log(T) + (a2*T) + ((a3*(T).^2)/2) + ((a4*(T).^3)/3) + ((a5*(T).^4)/4) + a7)
function S =entropy(a1,a2,a3,a4,a5,a7,a8,a9,a10,a11,a12,a14,T,R,tempmid)
% calculate entropy for higher and lower temprature
if (T >=tempmid)
S = R*(a1*log(T) + (a2*T) + ((a3*(T).^2)/2) + ((a4*(T).^3)/3) + ((a5*(T).^4)/4) + a7);
else
S = R*(a8.*log(T) + (a9.*T)+((a10.*(T).^2)/2) + ((a11*(T).^3)/3) + ((a12*(T).^4)/4) + a14);
end
Calculate enthaphy function
farmula:-
H = R*T.*(a1+((a2.*T)/2)+((a3*(T).^2)/3)+((a4*(T).^3)/4)+((a5*(T).^4)/5)+(a6*(T)))
function H =enthaphy(a1,a2,a3,a4,a5,a6,a8,a9,a10,a11,a12,a13,T,R,tempmid)
%calculate enthaphy lower and higher temprature
if (T<=tempmid)
H = R*T.*(a8+((a9.*T)/2)+((a10*(T).^2)/3)+((a11*(T).^3)/4)+((a12*(T).^4)/5)+(a13*(T)));
else
H = R*T.*(a1+((a2.*T)/2)+((a3*(T).^2)/3)+((a4*(T).^3)/4)+((a5*(T).^4)/5)+(a6*(T)));
end
calculate the molecular weight
function W = Molecular_weight(species)
%defining atomic name of the sapcies
atomic_name = ['H','C','O','N','A'];
%define atomic masses of main species
atomic_weight = [1.008 12.011 15.999 14.007 93.948];
W = 0;
for i = 1:length(species)
for j = 1:length(atomic_name)
if strcmp(species(i),atomic_name(j));
W = W+atomic_weight(i);
postion = j;
end
end
n = str2double(species);
if n>1
W = W+atomic_weight(position)*(n-1);
end
end
fprintf('molecular_weight of %s:-',species);
fprintf('%f',W);
disp(' ');
end

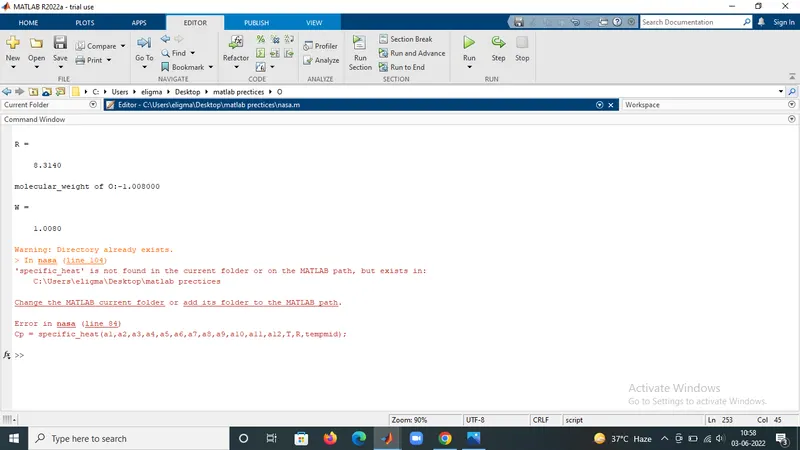
outputs errors

plots of some species:-
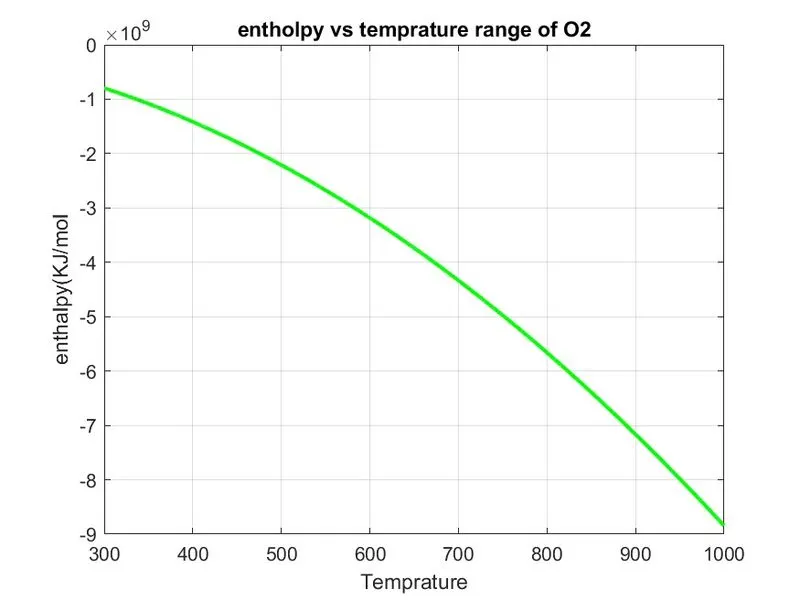
plots O2 Entholpy vs Temp
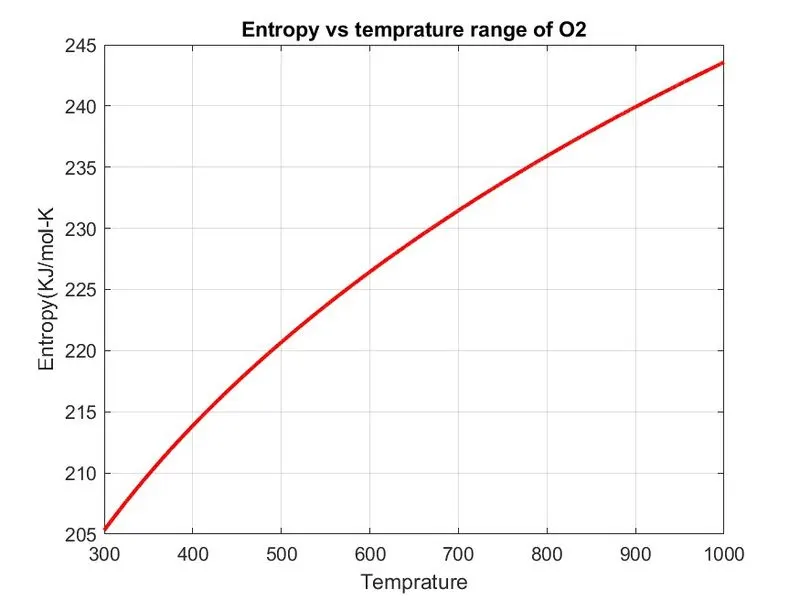
plots Oe Entropy vs Temp
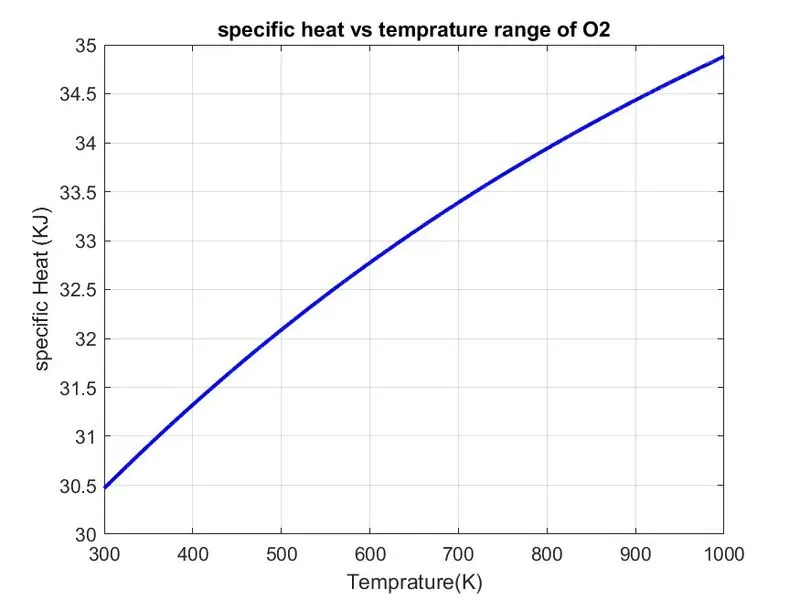
plots O2 Specific Heat vs Temp
plots O Entholpy vs Temp
plots O Entropy vs Temp
Plots O Spacific Heat vs Temp
plots N2 Entholpy vs Temp
plots N2 Entropy vs Temp
plots N2 Specific Heat vs Temp
plots CO2 Entholpy vs Temp
plots CO2 Entropy vs Temp
plots CO2 Specific Heat vs Temp
GRAPH FILES OF ALL SPECIES
REFRANCE:
Conclusion:-
I using the MATLAB softwere i finds all species Like O, O2, N2, CO2 many more tpyes of thermo data find with the help of matlab code.
In which Entropy, Entholpy, Specific heat calculate tempeture ranges
Your portfolio, next

Ship work like this
in your own course.

Talk to a career counsellor

Free 20-minute call. We'll map the right course to where you want to work.

By submitting you agree to our Terms and Privacy Policy.

Talk to a career counsellor

Free 20-minute call. We'll map the right course to where you want to work.

By submitting you agree to our Terms and Privacy Policy.