Project 1 - Parsing NASA thermodynamic data
Aim-: Using the concept of File Parsing to evaluate thermodynamic properties such as Cp, H and S. from the NASA THERMODYNAMICS DATA FILE
OBJECTIVE -:
- Write a function that extracts the 14 co-efficients and calculates the enthalpy, entropy and specific heats for all the species in the data file.
- Calculate the molecular weight of each species and display it in the command window.
- Plot the Cp, Enthalpy and Entropy for the local temperature range (low temperature : high temperature) specific for each species.
- Save the plots as images with appropriate names and dump them in separate folders for each species with suitable name. All these should be generated automatically
File Parsing -: parsing is 'an act of parsing a string or a text data'.File parsing in computer language means to give a meaning to the characters of a text file.
use of fopen command we open the file & read all the Data structure inside it.
use of fgetl command we read the file data string line by line & also split into a part .
this is good for solving such text file
Mathematical equation for Calculation of thermodynamic properties-

Cp- specific Heat
R - universal gas constant that is 8.314
H - enthalpy
S -entropy
T- Temperature
The FIRST 7 coefficients are HIGH-temperature coefficients(a1,a2,a3,a4,a5,a6,a7) and the SECOND 7 coefficients are LOW-temperature coefficients(a8,a9,a10,a11,a12,a13,a14).
Main Program for evaluating all species thermodynamics properties
close all
clear all
clc
f1=fopen('THERMO.dat','r'); % opening & reading of NASA Thermo file
%skipping first lines
fgetl(f1)    % this command for reading file line by line
t_line=fgetl(f1);
% global Temperature range
% string stored in form of cell data
A=strsplit(t_line,' ');   % strsplit command for split the string in parts
G_low_temp=str2num(A{2});  % Golbal temperature range
G_high_temp=str2num(A{4});  % str2num command convert the string into number
G_mid_temp=str2num(A{3});
% skipping All three lines
fgetl(f1)
fgetl(f1)
fgetl(f1)
% thier are 53 lines in all data
for i=1:53         % for loop for running all thr species data
    % reading first header
t_line=fgetl(f1);
A1=strsplit(t_line,' ');
species=A1{1}

% Local Temperature
l_low_temp=str2num(A1{end-3});  %converting a local low temperature string into number
l_high_temp=str2num(A1{end-2});
l_mid_temp=str2num(A1{end-1});
% reading first block species
t_line=fgetl(f1);
a=findstr(t_line,'E');   % finding string where is E in that line
a1=t_line(1:a(1)+3);    % taking value after E & before E
a1= str2num(a1);
a2=t_line(a(1)+4:a(2)+3); % all these line are same
a2=str2num(a2);
a3=t_line(a(2)+4:a(3)+3);
a3=str2num(a3);
a4=t_line(a(3)+4:a(4)+3);
a4=str2num(a4);
a5=t_line(a(4)+4:a(5)+3);
a5=str2num(a5);
% next line
t_line=fgetl(f1);
b=findstr(t_line,'E');
a6=t_line(1:b(1)+3);
a6=str2num(a6);
a7=t_line(b(1)+4:b(2)+3);
a7=str2num(a7);
a8=str2num(t_line(b(2)+4:b(3)+3));
a9=str2num(t_line(b(3)+4:b(4)+3));
a10=str2num(t_line(b(4)+4:b(5)+3));
% next line
t_line=fgetl(f1);
c=findstr(t_line,'E');
a11=str2num(t_line(1:c(1)+3));
a12=str2num(t_line(c(1)+4:c(2)+3));
a13=str2num(t_line(c(2)+4:c(3)+3));
a14=str2num(t_line(c(3)+4:c(4)+3)); % here only
% universal gas constant R
R=8.314;
% taking values of temperature between low & high
T=linspace(l_low_temp,l_high_temp,200);
% to calculat properties by calling function
% specific heat
c_p=specific_heat(a1,a2,a3,a4,a5,a6,a7,a8,a9,a10,a11,a12,a13,a14,l_low_temp,l_mid_temp,l_high_temp,T,R);
% enthalpy
H=enthalpy(a1,a2,a3,a4,a5,a6,a7,a8,a9,a10,a11,a12,a13,a14,l_low_temp,l_mid_temp,l_high_temp,T,R);
%entropy
S=entropy(a1,a2,a3,a4,a5,a6,a7,a8,a9,a10,a11,a12,a13,a14,l_low_temp,l_mid_temp,l_high_temp,T,R);
%creating a folder & saved by species NAME
mkdir(['C:',species])  % in C:directory
cd(species)
%pltting graph for
%Temperature vs specific heat

figure(1)
grid on
plot(T,c_p,'linewidth',3,'Color','b')
xlabel('Temperature---> ')
ylabel('specific Heat---> ')
title('Temperature vs specific heat')
image=getframe(gcf);
imwrite(image.cdata,'t_vs_cp.png')
saveas(1,'specific heat','jpg');
%Temperature vs enthalpy
figure(2)
grid on
plot(T,H,'linewidth',3,'Color','r')
xlabel('Temperature---> ')
ylabel('Enthalpy---> ')
title('Temperature vs Enthalpy')
image=getframe(gcf);
imwrite(image.cdata,'t_vs_h.png')
saveas(2,'enthalpy','jpg');
%Temperature vs Entropy
figure(3)
grid on
plot(T,S,'linewidth',3,'Color','g')
xlabel('Temperature---> ')
ylabel('Entropy---> ')
title('Temperature vs Entropy')
image=getframe(gcf);
imwrite(image.cdata,'t_vs_s.png')
saveas(3,'entropy','jpg');

cd ..
% calculation of molucular mass of every species
[m]=mol_weight(species);
k=sprintf('%s Molecular weight %f',species,m);
disp(k)
end
calling Function code of specific heat
% function for calculation of specific heat
function [c_p]=specific_heat(a1,a2,a3,a4,a5,a6,a7,a8,a9,a10,a11,a12,a13,a14,l_low_temp,l_mid_temp,l_high_temp,T,R)
   if(T>l_mid_temp)
       c_p=R*(a1+(a2.*T)+(a3.*(T).^2)+(a4.*(T).^3)+(a5.*(T).^4));
   else
        c_p=R*(a8+(a9.*T)+(a10.*(T).^2)+(a11.*(T).^3)+(a12.*(T).^4));
   end
function code for calculation of enthalpy-:
% function for calculation of enthalpy
function [H]=enthalpy(a1,a2,a3,a4,a5,a6,a7,a8,a9,a10,a11,a12,a13,a14,l_low_temp,l_mid_temp,l_high_temp,T,R)
   if (T>l_mid_temp)
       H=(a1+(a2.*T/2)+(a3.*(T.^2)/3)+(a4.*(T.^3)/4)+(a5.*(T.^4)/5)+(a6./T)).*T*R;
   else
        H=(a8+(a2.*T/2)+(a9.*(T.^2)/3)+(a10.*(T.^3)/4)+(a11.*(T.^4)/5)+(a12./T)).*T*R;
   end
Function code for calculation of entropy-:
% function for calculation of entropy
function [S]=entropy(a1,a2,a3,a4,a5,a6,a7,a8,a9,a10,a11,a12,a13,a14,l_low_temp,l_mid_temp,l_high_temp,T,R)
   if(T>l_mid_temp)
       S=(a1.*(log(T))+(a2.*T)+(a3.*(T.^2)/2)+(a4.*(T.^3)/3)+(a5.*(T.^4)/4)+a7)*R;
   else
        S=(a8.*(log(T))+(a9.*T)+(a10.*(T.^2)/2)+(a11.*(T.^3)/3)+(a12.*(T.^4)/4)+a14)*R;
   end
function code for calculation of molecular weight of all species -:
% fuction for calculation of molucular mass of all species
function [M]=mol_weight(species)
  elements=['O','H','C','N','A'];
  atomic_mass=[15.999,1.008,12.011,14.007,39.948];
  mol_wt=0;
  for i=1:length(species)
      for j=1:length(elements)
          if strcmpi(species(i),elements(j))
              mol_wt=mol_wt+atomic_mass(j);
              z=j;
          end
      end
      t=str2double(species(i));
      if (t>1)
          mol_wt=mol_wt+(atomic_mass(z)*(t-1));
      end
  end
  M=mol_wt;
end
output window for molecular mass-
species =
 'O'
O Molecular weight 15.999000
species =
 'O2'
O2 Molecular weight 31.998000
species =
 'H'
H Molecular weight 1.008000
species =
 'H2'
H2 Molecular weight 2.016000
species =
 'OH'
OH Molecular weight 17.007000
MATLAB Command Window Page 2
species =
 'H2O'
H2O Molecular weight 18.015000
species =
 'HO2'
HO2 Molecular weight 33.006000
species =
 'H2O2'
H2O2 Molecular weight 34.014000
species =
 'C'
C Molecular weight 12.011000
species =
 'CH'
CH Molecular weight 13.019000
species =
 'CH2'
CH2 Molecular weight 14.027000
species =
 'CH2(S)'
CH2(S) Molecular weight 14.027000
species =
 'CH3'
CH3 Molecular weight 15.035000
species =
 'CH4'
MATLAB Command Window Page 3
CH4 Molecular weight 16.043000
species =
 'CO'
CO Molecular weight 28.010000
species =
 'CO2'
CO2 Molecular weight 44.009000
species =
 'HCO'
HCO Molecular weight 29.018000
species =
 'CH2O'
CH2O Molecular weight 30.026000
species =
 'CH2OH'
CH2OH Molecular weight 31.034000
species =
 'CH3O'
CH3O Molecular weight 31.034000
species =
 'CH3OH'
CH3OH Molecular weight 32.042000
species =
 'C2H'
C2H Molecular weight 25.030000
MATLAB Command Window Page 4
species =
 'C2H2'
C2H2 Molecular weight 26.038000
species =
 'C2H3'
C2H3 Molecular weight 27.046000
species =
 'C2H4'
C2H4 Molecular weight 28.054000
species =
 'C2H5'
C2H5 Molecular weight 29.062000
species =
 'C2H6'
C2H6 Molecular weight 30.070000
species =
 'CH2CO'
CH2CO Molecular weight 42.037000
species =
 'HCCO'
HCCO Molecular weight 41.029000
species =
 'HCCOH'
HCCOH Molecular weight 42.037000
species =
 'H2CN'
MATLAB Command Window Page 5
H2CN Molecular weight 28.034000
species =
 'HCN'
HCN Molecular weight 27.026000
species =
 'HNO'
HNO Molecular weight 31.014000
species =
 'N'
N Molecular weight 14.007000
species =
 'NNH'
NNH Molecular weight 29.022000
species =
 'N2O'
N2O Molecular weight 44.013000
species =
 'NH'
NH Molecular weight 15.015000
species =
 'NH2'
NH2 Molecular weight 16.023000
species =
 'NH3'
NH3 Molecular weight 17.031000
MATLAB Command Window Page 6
species =
 'NO'
NO Molecular weight 30.006000
species =
 'NO2'
NO2 Molecular weight 46.005000
species =
 'HCNO'
HCNO Molecular weight 43.025000
species =
 'HOCN'
HOCN Molecular weight 43.025000
species =
 'HNCO'
HNCO Molecular weight 43.025000
species =
 'NCO'
NCO Molecular weight 42.017000
species =
 'CN'
CN Molecular weight 26.018000
species =
 'HCNN'
HCNN Molecular weight 41.033000
species =
 'N2'
MATLAB Command Window Page 7
N2 Molecular weight 28.014000
species =
 'AR'
AR Molecular weight 39.948000
species =
 'C3H8'
C3H8 Molecular weight 44.097000
species =
 'C3H7'
C3H7 Molecular weight 43.089000
species =
 'CH3CHO'
CH3CHO Molecular weight 44.053000
species =
 'CH2CHO'
CH2CHO Molecular weight 43.045000
>>
Workspace of Program -
MATLAB Workspace Page 1
Jun 2, 2022 9:32:25 AM
Name                        Value
a                    [12,27,42,57,72]
A                      1x4 cell
a1                     5.9757
A1                    1x10 cell
a10                   1.8915e-06
a11                   -7.1586e-09
a12                   2.8674e-12
a13                   1.5215e+03
a14                   9.5583
a2                    0.0081
a3                   -2.7436e-06
a4                    4.0703e-10
a5                   -2.1760e-14
a6                    490.3218
a7                   -5.0453
a8                    3.4091
a9                    0.0107
ans             '! see README file for...
b                  [12,27,42,57,72]
c                   [12,27,42,57]
c_p                  1x200 double
f1                        7
G_high_temp             5000
G_low_temp              300
G_mid_temp              1000
H                     1x200 double
i                       53
image               1x1 struct
k                 'CH2CHO Molecular ...
l_high_temp             5000
l_low_temp              300
l_mid_temp              1000
m                       43.0450
R                       8.3140
S                     1x200 double
species               'CH2CHO'
T                  1x200 double
t_line               '-0.07158583E-07 0.02..
output graph plot of some species-
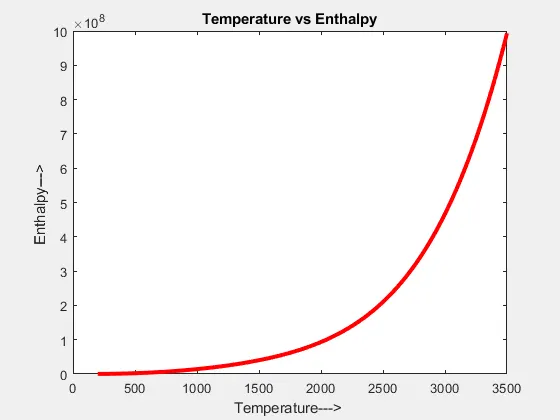
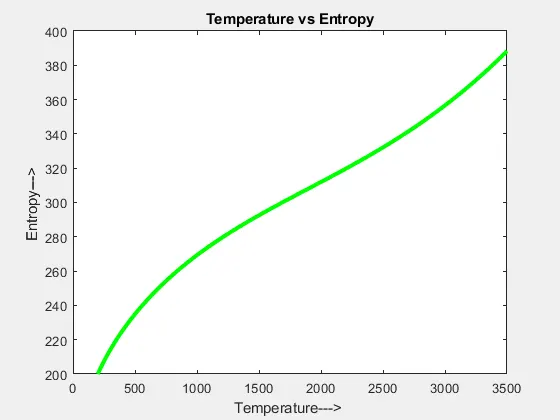
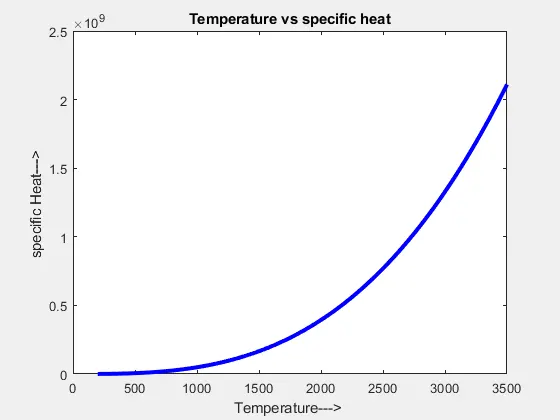
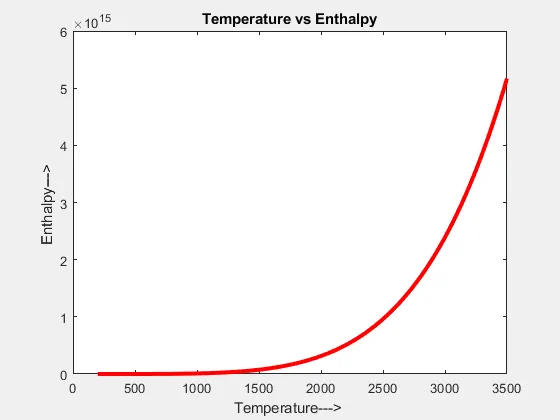
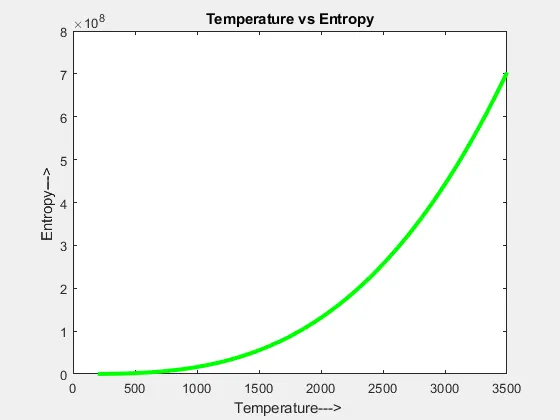
For O2 Species- I have created color difference for all three properties specific heat for blue graph
enthalpy in red graph ,entropy in green graph plot .
--Showing all plot graph is not possible because it is near to 159.
--These are some example
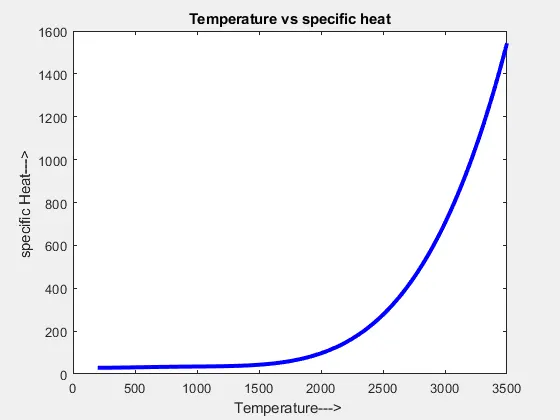
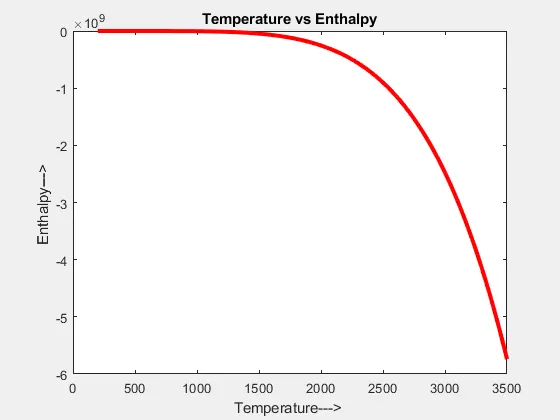
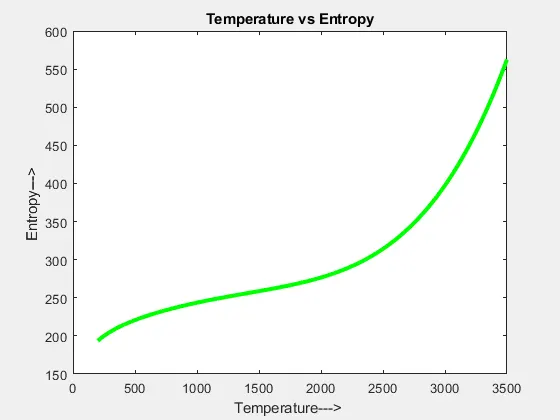
For CO2 ---
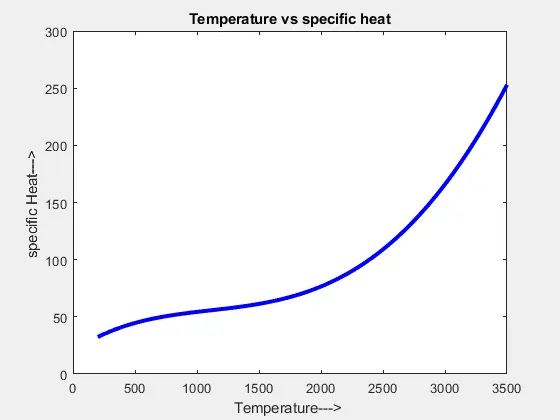
For N2--species-
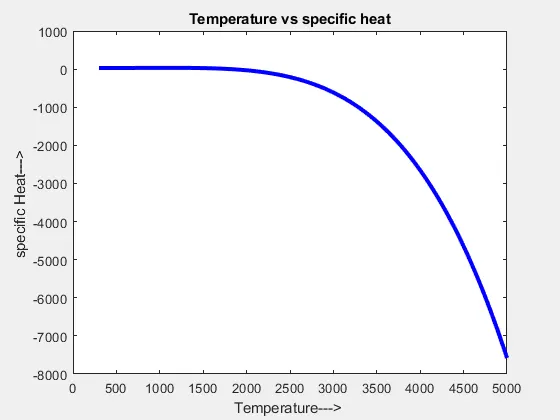
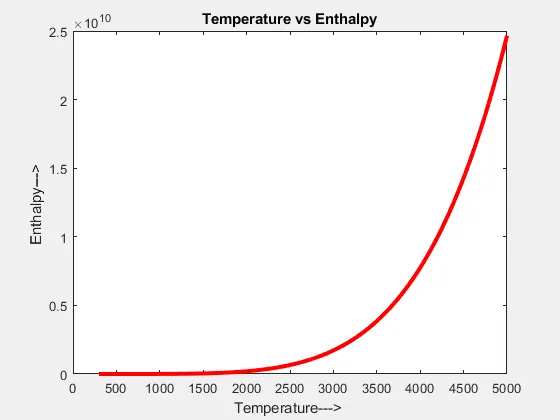
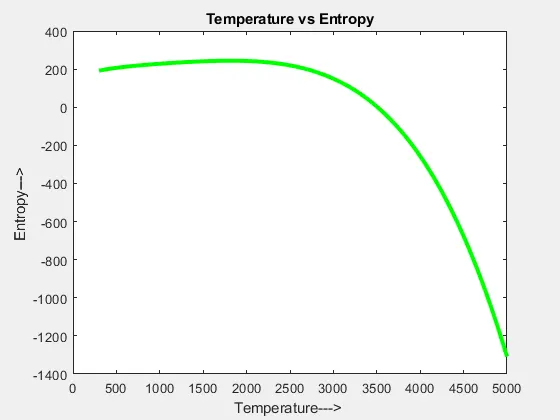
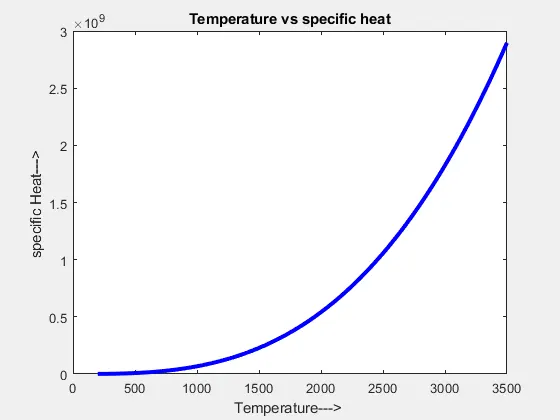
These below graph plot showing the logic error in code and doesn't the show error in command window . please check the error differance. error is overcomed ,see in above plots.
Values differance in a6 and a11.
a6=t_line(1:b(1)+3);
a6=str2num(a6);
For O2--
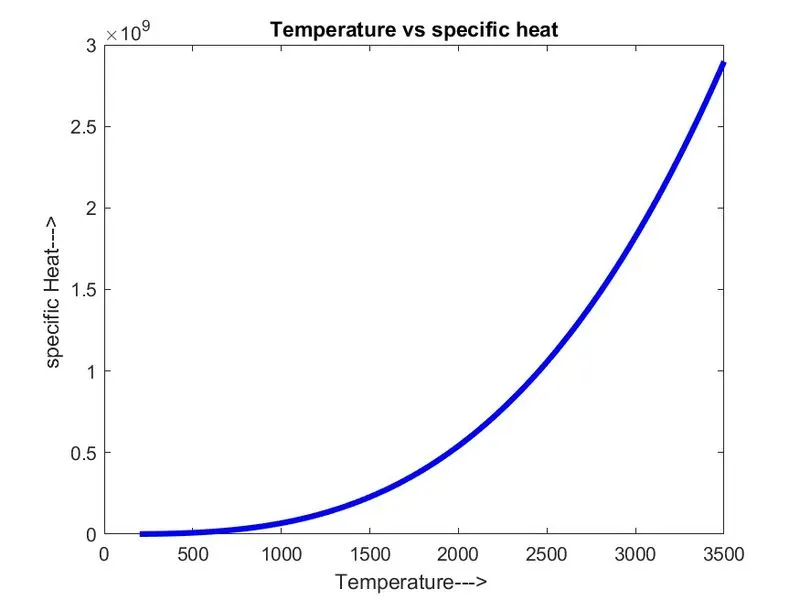
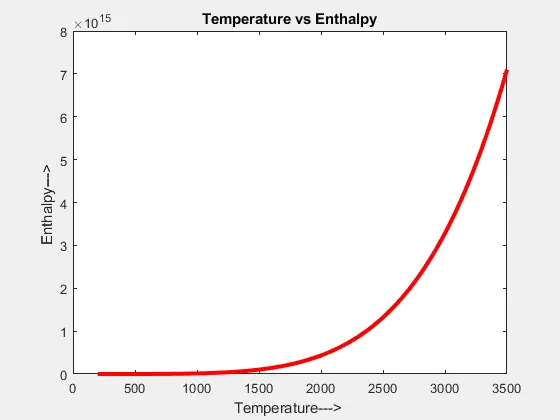
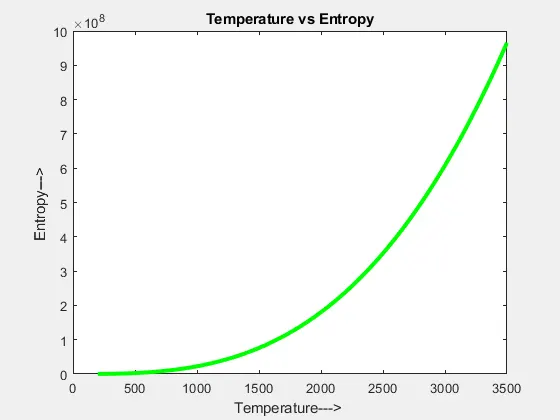
For CO2 -
For N2-
folder image where all the images are saved automatically - all 53 species are here

Result -All plot images generated automatically & saved in folder & also fine the value of molecular weight.