Project 1 - Parsing NASA thermodynamic data
All documentation proceescible, thenthat data converted and anlysis,
MAIN code is here
clear all
close all
clc
%opening the NASA thermpo dynamics data
f1=fopen('THERMO.dat','r');
first_line=fgetl(f1);% get first line information
%obataining of Global max,min and midium tempraturess
global_temp=fgetl(f1);
temp_range=strsplit(global_temp,' ');
global_min_temp =str2num(temp_range{2})
global_mid_temp =str2num(temp_range{3})
global_max_temp =str2num(temp_range{4})
%range of tremprature
T=linspace(global_min_temp,global_max_temp,400);
R=8.314;
%skipping the next three commant in the file
for i=1:3
comments=fgetl(f1);
end
%getting the coeffs of species
for i=1:53;
line1= fgetl(f1);
l=strsplit(line1);
m=length(l);
sp=l(1);
species=char(sp);%Mark name of the atoms and atomic weight
atoms=['H','C','O','N','Ar','S'];
atomic_weight=[1.0008 12.011 15.999 14.007 39.945 32.065];
low_temp=str2double(l(m-3));
mid_temp=str2double(l(m-2));
high_temp=str2double(l(m-1));
line2 = fgetl(f1);
A=strfind(line2,'E');
%Extracting higher temprature coeffs
a1 = str2num(line2(1:A(1)+3));
a2 = str2num(line2(A(1)+4:A(2)+3));
a3 = str2num(line2(A(2)+4:A(3)+3));
a4 = str2num(line2(A(3)+4:A(4)+3));
a5 = str2num(line2(A(4)+4:A(5)+3));
line3 = fgetl(f1);
B=strfind(line3,'E');
a6 = str2num(line3(1:B(1)+3));
a7 = str2num(line3(B(1)+4:B(2)+3));
%Extracting lower temprature coeffs
b1 = str2num(line3(B(2)+4:B(3)+3));
b2 = str2num(line3(B(3)+4:B(4)+3));
b3 = str2num(line3(B(4)+4:B(5)+3));
line4 = fgetl(f1);
C=strfind(line4,'E');
b4 = str2num(line4(1:C(1)+3));
b5 = str2num(line4(C(1)+4:C(2)+3));
b6 = str2num(line4(C(1)+4:C(2)+3));
b7 = str2num(line4(C(2)+4:C(3)+3));
%calculation for specific heat
cp=specificheat(a1,a2,a3,a4,a5,b1,b2,b3,b4,b5,T,R,global_mid_temp)
%Enthalpy calculation
h=enthalpy(a1,a2,a3,a4,a5,a6,b1,b2,b3,b4,b5,b6,T,R,global_mid_temp)
%Entropy calculation
s=entropy_calculation(a1,a2,a3,a4,a5,a7,b1,b2,b3,b4,b5,b7,T,R,global_mid_temp)
%weight calculation
Molecular_weight(i)=molecular_weight(species)
plotting(cp,h,s,T,species)
end
%calculation of specificheat
function cp=specificheat(a1,a2,a3,a4,a5,b1,b2,b3,b4,b5,T,R,global_mid_temp)
%comparing with global temp
%If less than global it will take min coffs
if T>global_mid_temp
cp=R.*(a1+a2.*T+a3.*T.^2+a4.*T.^3+a5.*T.^4);
%if temp is more it will take max coeffs
else
cp=R.*(b1+b2.*T+b3.*T.^2+b4.*T.^3+b5.*T.^4);
end
%calculation of enthalpy
function s=entropy_calculation(a1,a2,a3,a4,a5,a7,b1,b2,b3,b4,b5,b7,T,R,global_mid_temp)
%comparing with global temp
%If less than global it will take min coeffs
if T<=global_mid_temp
s=R*(a1.*log(T)+(a2.*T)+a3.*(T.^2)./2+a4.*(T.^3)./3+a5.*(T.^4)./4+a7);
%if temp is more it will take max coeffs
else
s=R*(b1.*log(T)+b2.*T+b3.*(T.^2)./2+b4.*(T.^3)./3+b5.*(T.^4)./4+b7);
end
%calculation of enthalpy
function h=enthalpy(a1,a2,a3,a4,a5,a6,b1,b2,b3,b4,b5,b6,T,R,global_mid_temp)
%comparing with global temp
%If less than global it will take min coffs
if T>global_mid_temp
h=R.*(a1+(a2.*T)./2+(a3.*T.^2)./3+(a4.*T.^3)./4+(a5.*T.^4)./5+a6);
%if temp is more it will take max coeffs
else
h=R.*(b1+(b2.*T)./2+(b3.*T.^2)./3+(b4.*T.^3)./4+(b5.*T.^4)./5+b6);
end
%Function to calculate molecular weight
function MW=molecular_weight(species)
%Molecular weight calculation
atoms=['H','C','O','N','Ar','S'];
fprintf('Molecular weight of ');
fprintf(atoms);
fprintf(' : ');
atomic_weight=[1.0008 12.011 15.999 14.007 39.945 32.065];
MW= 0;
for p=1:length(species)
for q=1:length(atomic_weight)
if strcmp(species(p),atoms(q))
MW = MW+atomic_weight(q);
position = q;
end
end
n = str2double(species(p));
if n >1
MW= MW+atomic_weight(position)*(n-1);
end
end
fprintf('%d',MW);
disp(' ');
end
function plotting(cp,h,s,T,species)
cd(pwd)
dir_name= species;
mkdir(dir_name);
figure(1)
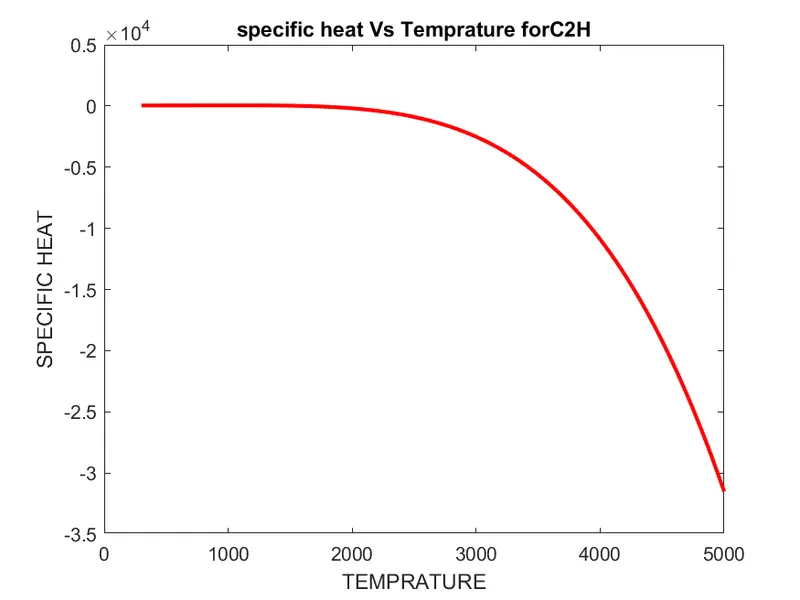
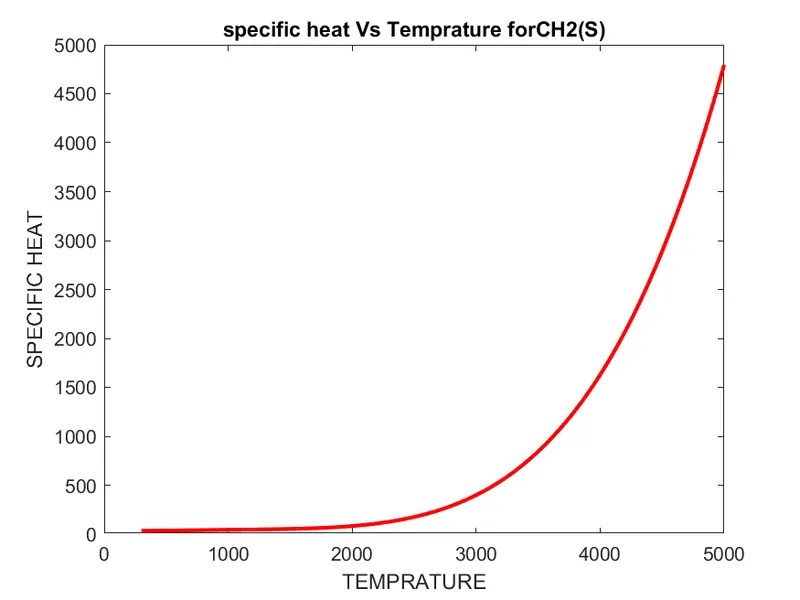
plot(T,cp,'linewidth',2,'color','r')
title(sprintf('specific heat Vs Temprature for%s',species));
xlabel('TEMPRATURE')
ylabel('SPECIFIC HEAT')
figure(2)
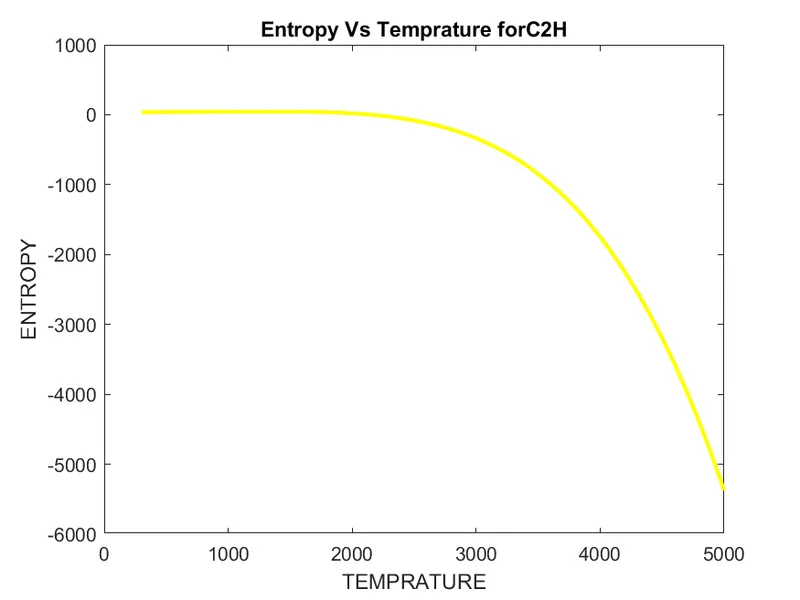
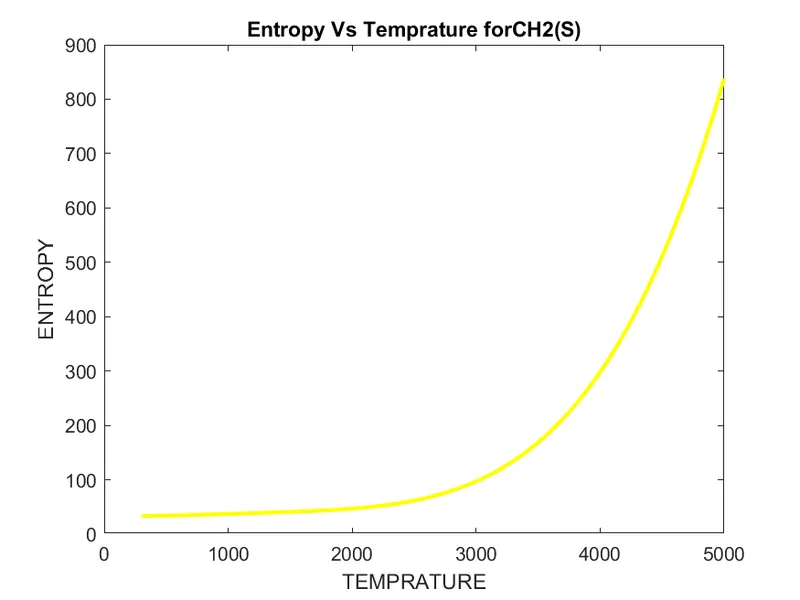
plot(T,h,'linewidth',2,'color','y')
title(sprintf('Entropy Vs Temprature for%s',species));
xlabel('TEMPRATURE')
ylabel('ENTROPY')
figure(3)
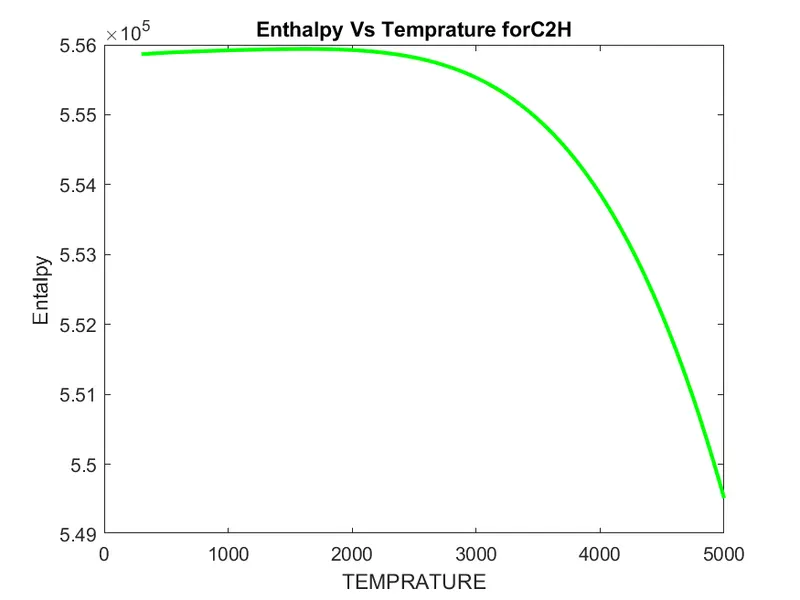
plot(T,s,'linewidth',2,'color','g')
title(sprintf('Enthalpy Vs Temprature for%s',species));
xlabel('TEMPRATURE')
ylabel('Entalpy')
cd(dir_name)
saveas(1,'CP_vs_T.png')
saveas(2,'h_vs_T.png')
saveas(3,'s_vs_T.png')
cd ..
end
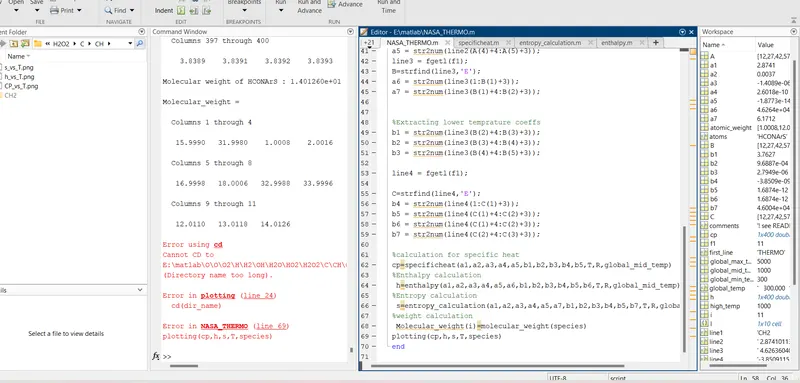
molecualr weight calculation files
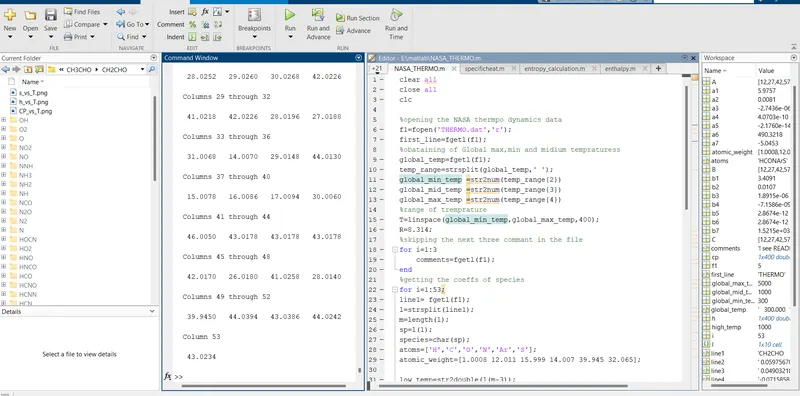
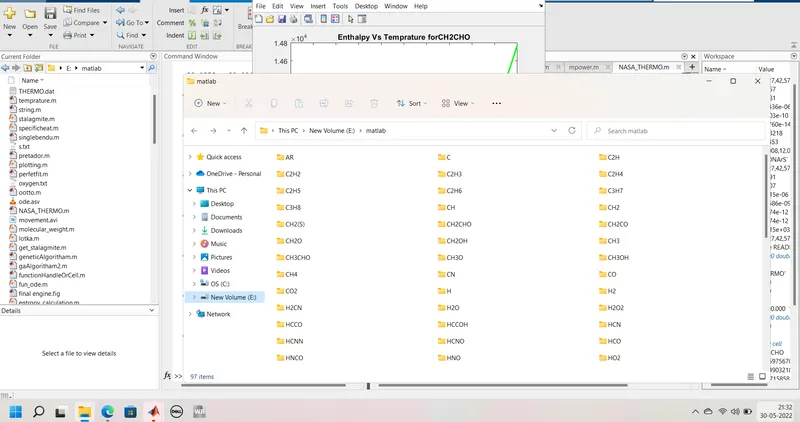
All ploted file are stored here