Project 1 - Parsing NASA thermodynamic data
NASA came up with polynomials that can be used to evaluate thermodynamic properties such as Cp, H and S. They have also documented the co-efficients that are required to evaluate these polynomials for 1000+ species.
To guide you we have broken down the problem into meaningful bits that you can work on individually.
1. Write a function that extracts the 14 co-efficients and calculates the enthalpy, entropy and specific heats for all the species in the data file. You will be reading this file NASA thermodynamic data(Tip: use fopen and fgetl). The formulae are shown below.
Here R is the universal gas constant, T is the temeprature
The FIRST 7 coefficients are HIGH-temperature coefficients and the SECOND 7 coefficients are LOW-temperature coefficients.
Also use the LOCAL TEMPERATURE RANGES which is unique for each individual species, not the GLOBAL TEMPERATURE RANGE.
2. Calculate the molecular weight of each species and display it in the command window.
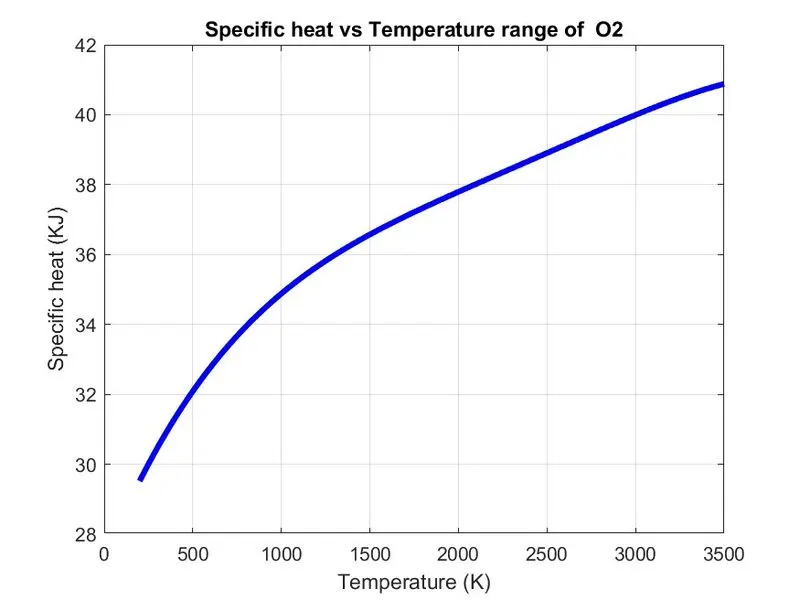
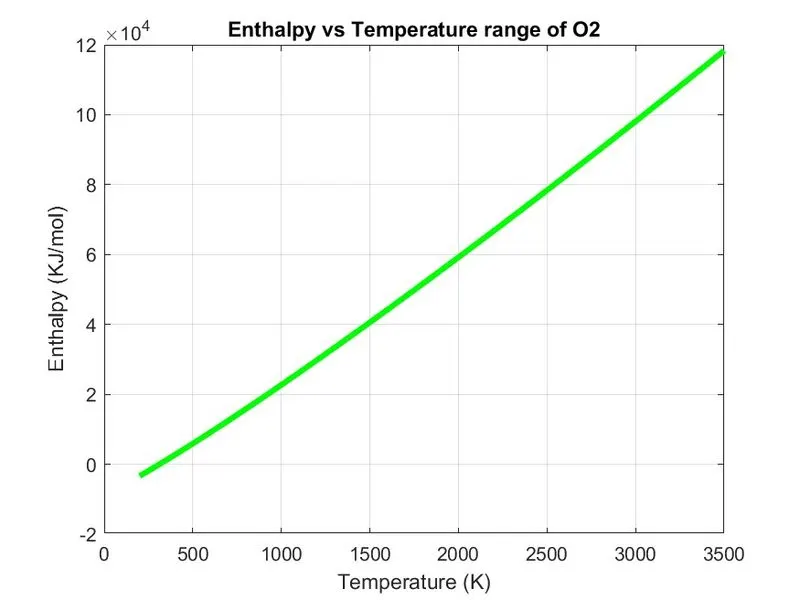
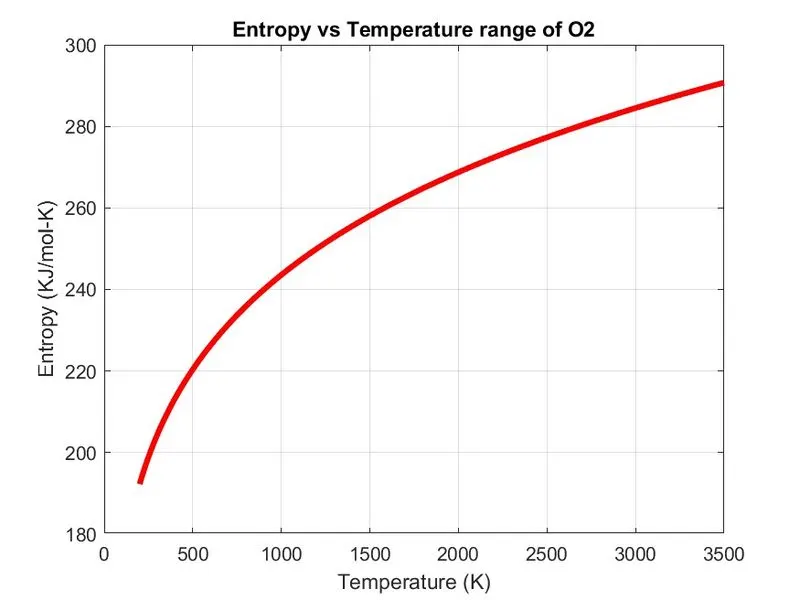
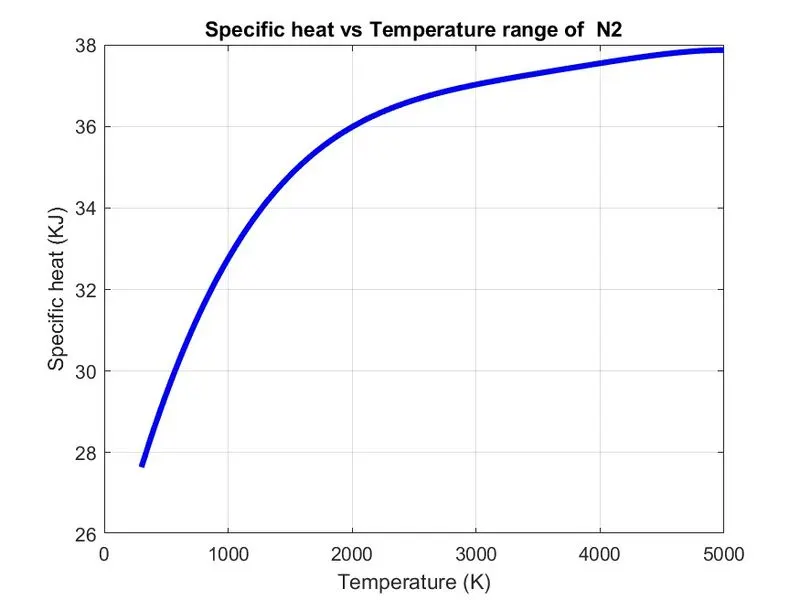
3. Plot the Cp, Enthalpy and Entropy for the local temperature range (low temperature : high temperature) specific for each species.
4. Save the plots as images with appropriate names and dump them in separate folders for each species with suitable name. All these should be generated automatically.
5. The main program that you will submit will just take the "THERMO.dat" file as an input and generate Cp, H and S plots.
Code for specific heat function
%Specific Heat Calculation Function
function Cp=Specific_heat(a1,a2,a3,a4,a5,a8,a9,a10,a11,a12,T,R,tempmid)

% calculating specific heat for higher and lower temperature respectively.
if (T<=tempmid)
Cp=(a8+(a9.*T)+(a10.*(T.^2))+(a11.*(T.^3))+(a12.*(T.^4)))*R;
else
Cp = (a1+(a2.*T)+(a3.*(T.^2))+(a4.*(T.^3))+(a5.*(T.^4)))*R;
end
end
Code for entropy function
% Entropy Calculation Function

function S=Entropy(a1,a2,a3,a4,a5,a7,a8,a9,a10,a11,a12,a14,T,R,tempmid)
% calculating entropy for higher and lower temperature respectively

if (T<=tempmid)
S=(a8.*log(T)+(a9*T)+((a10*(T.^2))/2)+((a11*(T.^3))/3)+((a12*(T.^4))/4)+a14)*R;
else
S=(a1.*log(T)+(a2*T)+((a3*(T.^2))/2)+((a4*(T.^3))/3)+((a5*(T.^4))/4)+a7)*R;
end
end
Code for enthalpy function
% Enthalpy Calculation function.

function H=Enthalpy(a1,a2,a3,a4,a5,a6,a8,a9,a10,a11,a12,a13,T,R,tempmid)
%Calculating enthalpy for higher and lower temperature respectively.

if (T<=tempmid)
H =R*T.*(a8+((a9*T)/2)+((a10*(T.^2))/3)+((a11*(T.^3))/4)+((a12*(T.^4))/5)+((a13./T)));
else
H=(a1+((a2*T)/2)+((a3*(T.^2))/3)+((a4*(T.^3))/4)+((a5*(T.^4))/5)+((a6./T))).*R.*T;
end
end
Code for molecular weight calculation function
% Molecular Weight Calculation Function
function MW=Molecular_weight(species)

% Defining Atomic Name of the species

atomic_name = ['H', 'C', 'O', 'N', 'Ar'];

% Hydrogen Carbon, Oxygen, Nitrogen, Argon

% Defining Atomic masses of main species

atomic_weight = [1 12 16 14 40];

MW = 0;  % Molecular weight starting range
position=0;
% Adding Atomic Number to obtain particular value

for i=1:length(species)  % Loop runs to the length of the species

for j=1:length(atomic_name) % Loop runs to the length of the atomic name

if (strcmp(species(i), atomic_name(j))) % function to compare 2 strings
    MW=MW+atomic_weight(j);
    position=j;
end
end
n = str2num(species(i));  % Finding more elements in the species and incrementing atomic weight of the species

if n>1
    MW=MW+atomic_weight(position)*(n-1);
end
end

end
EXPLANATION
- Firstly we create an Molecular weight_function MW and assigning its species input to that.
- Then define the main element of all 53 species in an array atomic_name that are 'H','C','O','N', 'Ar'.
- Then by taking the above main elements we will create thereatomic_weight array 1 12 16 14 40
- Then we will assign molecular starting range from MW to zero and then create "for" loop condition which runs to the length of the species and an another nested "for" loop is created which runs to the length of the string atomic_name
- Then we will create a condition using "If" condition and "strcmp" command to compare the species and atomic_name strings to calculate molecular masses if by comparison both string found same then we will assign its molecular weight.
- Now we will convert the string to numbers using "str2num" command and assign to then we run a condition of "if" loop to find whether the species contains more than one element and if there are more than 1 elements that is n>1 then we will Increment the atomic weight by multiplication of position and n-1 to the atomic weight array.
Main programe
clear all
close all
clc

% Input
R = 8.314; % Gas Constant (J / (mol - K))

% Reading data File
% Open and read THERMO.dat file
f1 = fopen('THERMO.dat', 'r')
get=fgetl(f1) ;

% Now reading Temperature from this file
temp = fgetl(f1);

% Splitting
s = strsplit(temp,' ');

% Converting strings cells into numbers
global_templow= str2num(s{2});
global_tempmid= str2num(s{3});
global_temphigh=str2num(s{4});


% Skipping 3 lines
fgetl(f1);
fgetl(f1);
fgetl(f1);

% Reading the species
for i = 1:53
    tline=fgetl(f1);
    A=strsplit(tline, ' ');   % Splitting cell into array
    species =(A{1});  % To read the name of the species


Q=strfind(tline,'G');
local_templow = tline(Q+3:55);
local_temphigh = tline(Q+13:65);
local_tempmid= tline(Q+23:75);

templow= str2double(local_templow); %Local Low Temperature

temphigh= str2double(local_temphigh); %Local High Temperature

tempmid= str2double(local_tempmid); %Local Mid Temperature


tline1= fgetl(f1);  % getting next line
% Finding the string E
a=strfind(tline1,'E');

% Finding first 7 higher and second & lower coefficients

% Finding the Higher coefficients
a1 = tline1(1:a(1)+3) ;
a1=str2num(a1);
a2 = tline1(a(1)+4:a(2)+3) ;
a2=str2num(a2);
a3 = tline1(a(2)+4:a(3)+3);
a3=str2num(a3);
a4 = tline1(a(3)+4:a(4)+3);
a4 = str2num(a4);
a5 = tline1(a(4)+4:a(5)+3) ;
a5=str2num(a5);

tline2=fgetl(f1);
b=strfind(tline2, 'E') ;
a6 = tline2(1:b(1)+3);
a6=str2num(a6);
a7 = tline2(b(1)+4:b(2)+3);
a7=str2num(a7);

% Finding lower coefficients
a8 = tline2(b(2)+4:b(3)+3);
a8=str2num(a8);
a9 = tline2(b(3)+4:b(4)+3) ;
a9=str2num(a9);
a10=tline2(b(4)+4:b(5)+3);
a10=str2num(a10);

tline3=fgetl(f1);
c = strfind(tline3, 'E');
a11 = tline3(1:c(1)+3);
a11 = str2num(a11);
a12 = tline3(c(1)+4:c(2)+3);
a12 = str2num(a12);
a13 = tline3(c(2)+4:c(3)+3);
a13 = str2num(a13);
a14 = tline3(c(3)+4:c(4)+3);
a14=str2num(a14);

% Temperature range
T=linspace(templow,temphigh,500);

% calculate specific heat
Cp = Specific_heat(a1,a2,a3,a4,a5,a8,a9,a10,a11,a12,T,R,tempmid);

% calculate Entropy
S = Entropy(a1,a2,a3,a4,a5,a7,a8,a9,a10,a11,a12,a14,T,R,tempmid);

% calculate Enthalpy
H = Enthalpy(a1,a2,a3,a4,a5,a6,a8,a9,a10,a11,a12,a13,T,R,tempmid);

% calculate Molecular Weight of the species.
MW=Molecular_weight(species);

% writing molecular weight file
MW_file = fopen( 'Molecular Weight.txt', 'w');
fprintf(MW_file,'Molecular weight of %s is %d', species, MW);
fclose(MW_file);       % closing the file

% Plotting Cp, H & S with temperature
% saving in a folder
cd('C:/Users/HP/Desktop/Project 1/species')    % changing directory
mkdir(species);          % creating directory
cd(species);

% Plot 1 | Cp vs T

figure(1)
plot(T, Cp, 'linewidth',3, 'color', 'b');
xlabel('Temperature (K)');
ylabel('Specific heat (KJ)');
title(sprintf('Specific heat vs Temperature range of  %s', species));
grid on
saveas(figure(1),'Specific Heat.jpg');

% Plot 2 | S vs T

figure(2)
plot(T,S,'linewidth', 3,'color','r');
xlabel('Temperature (K)');
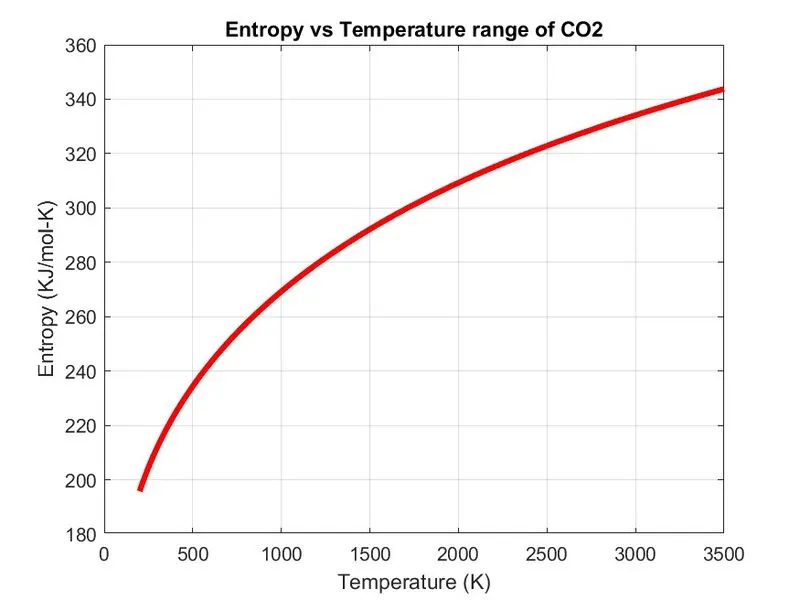
ylabel('Entropy (KJ/mol-K)');
title(sprintf('Entropy vs Temperature range of %s' , species));
grid on
saveas (figure(2),'Entropy.jpg');

%Plot 3 | H vs T

figure(3)
plot(T,H,'linewidth',3, 'color','g') ;
xlabel('Temperature (K)');
ylabel('Enthalpy (KJ/mol)');
title(sprintf('Enthalpy vs Temperature range of %s', species));
grid on
saveas(figure(3),'Enthalpy.jpg');

cd('C:/Users/HP/Desktop/Project 1'); %Changing directory to original matlab path
% Molecular weight
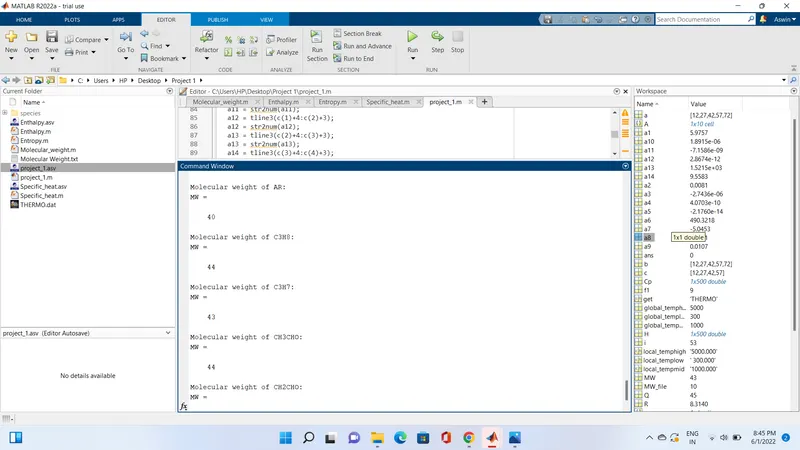
fprintf('Molecular weight of %s:',species)
MW=Molecular_weight(species)


end
Explanation of main programe
- clear all,close all and clc is used to clear all previous commands and plot
- 'fopen ' is used to open the file named 'dat'. 'r'is used for read mode.
- 'fgetl'is used to read the file line-by-line.
- For getting the Global temperature
'strsplit' command is used for splitting the string or character vectors at specified delimiter.
The global temperature info is stored in string so we use the command str2double so it returns the values in {} as a string. Which gives us the cell array. From which we can get the global temperature value. For skipping the next 3 command we use fgetl command.
- For getting temperature info
Species name is given as A{1}.
-
'for' loop is used to read all 53 species one by one and plot them to different folder.
- Extraction of 14 co-efficients
The coefficient locations are like 5 in 2 nd row, next 5 in 3 rd rowand restn the 4 th raw.
Now for extracting this we are going to locate the string 'E' first which is ipresent in each coefficent value. For that 'strfind' command is used. After finding the location of E tline1(1:a(1)+3) gives the values from 1 to 12 by adding +3 it will give the whole coefficient value. After getting the first coefficient , the second coefficient value starts from end of first coefficient value. by doing this we can extract the 14 coefficient values.
- 'linspace' is used to generate the temperature range.
- Calling functions
- Creating folder
Inorder to create a folder i have used the command mkdir which allows matlab to create a new folder to store the species data.
- Plotting the graph
Plot the graph between Temperature and specific heat, enthalpy vs temperature and entropy vs temperature.
saveas command is used to save the graph. cd command is used to define path to the folder where the data has to be stored.
fprintf command is used to show the molecular weight in command window.
Results
Graph for O2
N2
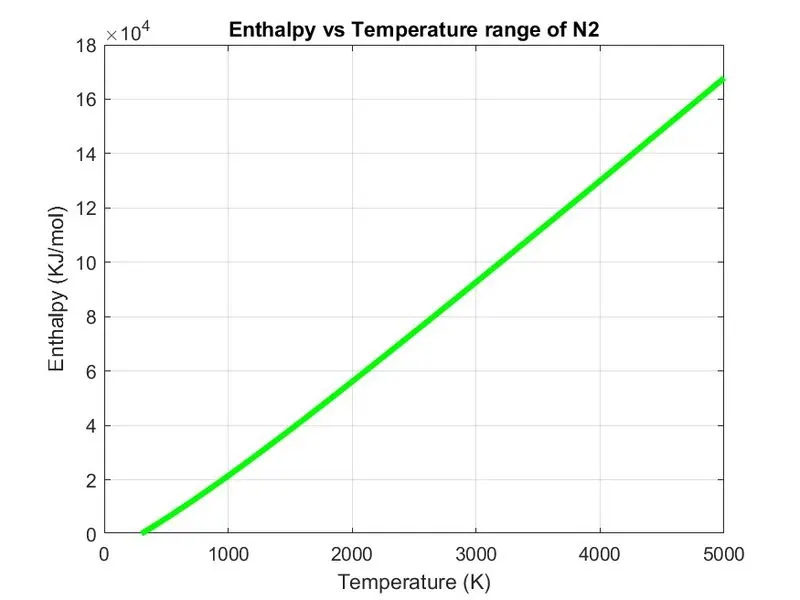
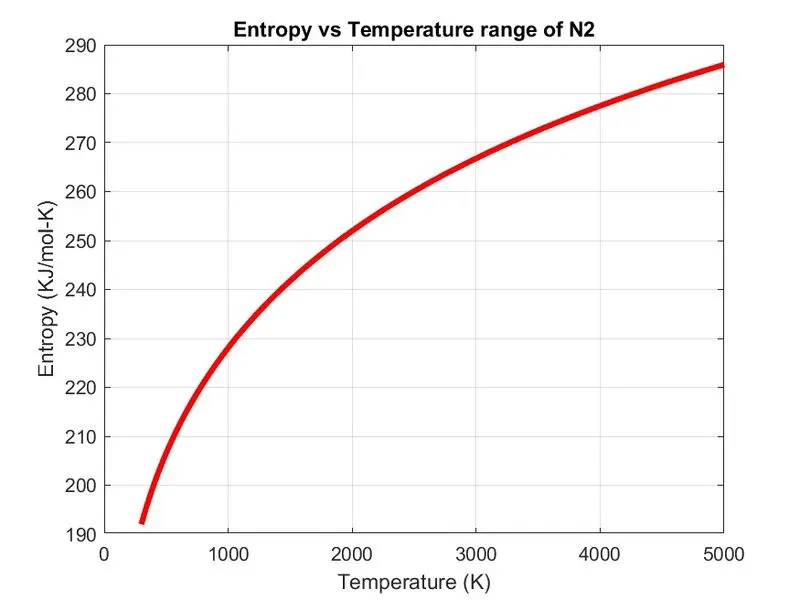
CO2
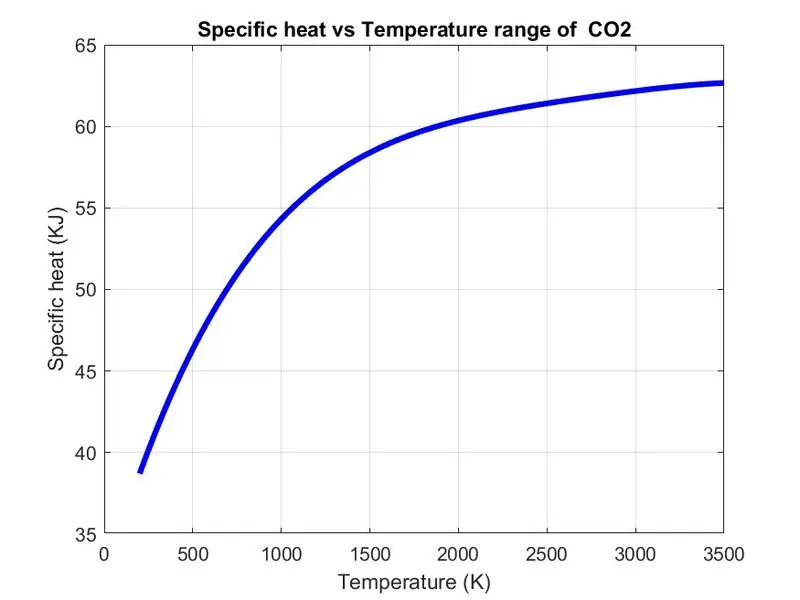
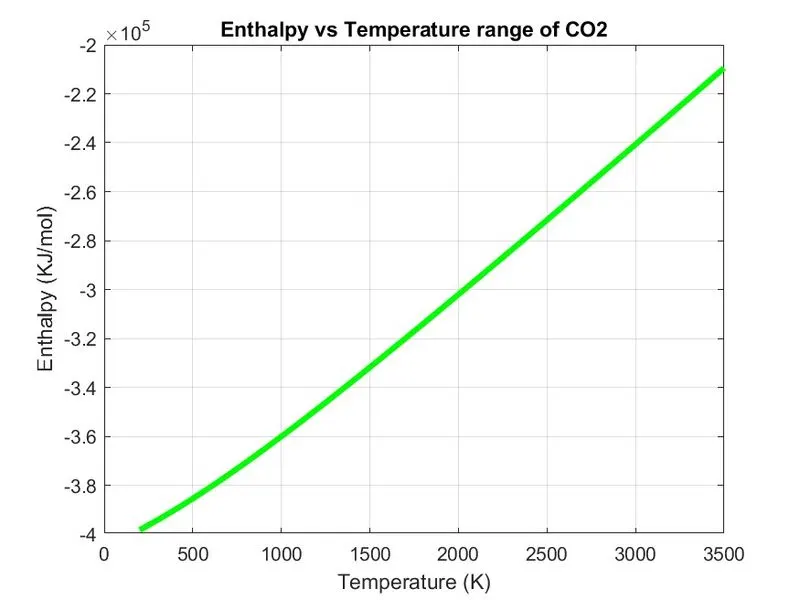
OTHER SCREENSHOTS
Showing molecular weight
Folders

Reference
Mathwork
Skill lync