Project 1 - Parsing NASA thermodynamic data
Aim:
1.To write a function that extracts the 14 co-efficients and calculates the enthalpy, entropy and specific heats for all the species in the data file.
2.To calculate the molecular weight of each species.
3.To Plot the Cp, Enthalpy and Entropy for the local temperature range (low temperature : high temperature) specific for each species.
Program:
close all
clear all
clc

% Opening the file and extracting the data
f1 = fopen('THERMO.dat','r')
q = fgetl(f1);
A = strsplit(fgetl(f1),' ');

% Extracting the global temperatures
global_low_temp = str2double(A{2});
global_mid_temp = str2double(A{3});
global_high_temp = str2double(A{4});
fgetl(f1);
fgetl(f1);
fgetl(f1);

% Getting input from user
n = input('Enter the compound name: ','s');
 while ~feof(f1)

     % Extracting the local temperatures
     line1 = strsplit(fgetl(f1),' ');
     if strcmpi(line1,'END')==1
         break
     end

     species_name = line1{1};
     if (strcmpi(n,species_name)==1)
         r=length(line1);
         l_low = str2double(line1{r-3});
         l_mid = str2double(line1{r-1});
         l_high = str2double(line1{r-2});

         % Extracting the coefficients
         line2 = fgetl(f1);
         strposl2 = strfind(line2,'E');
         a1 = str2double(line2(1:strposl2(1)+3));
         a2 = str2double(line2(strposl2(1)+4:strposl2(2)+3));
         a3 = str2double(line2(strposl2(2)+4:strposl2(3)+3));
         a4 = str2double(line2(strposl2(3)+4:strposl2(4)+3));
         a5 = str2double(line2(strposl2(4)+4:strposl2(5)+3));

         line3 = fgetl(f1);
         strposl3 = strfind(line3,'E');
         a6 = str2double(line3(1:strposl3(1)+3));
         a7 = str2double(line3(strposl3(1)+4:strposl3(2)+3));
         a8 = str2double(line3(strposl3(2)+4:strposl3(3)+3));
         a9 = str2double(line3(strposl3(3)+4:strposl3(4)+3));
         a10 = str2double(line3(strposl3(4)+4:strposl3(5)+3));

         line4 = fgetl(f1);
         strposl4 = strfind(line4,'E');
         a11 = str2double(line4(1:strposl4(1)+3));
         a12 = str2double(line4(strposl4(1)+4:strposl4(2)+3));
         a13 = str2double(line4(strposl4(2)+4:strposl4(3)+3));
         a14 = str2double(line4(strposl4(3)+4:strposl4(4)+3));

         % Range of temperature for which the Cp, H and S are calculated
         T = linspace(l_low,l_high,100);

         for i = 1:length(T)
             [c_p,H,S] = calculating_therm_properties(a1,a2,a3,a4,a5,a6,a7,a8,a9,a10,a11,a12,a13,a14,l_mid,T)
         end

         % Changing the directory and save the plots in that directory
         mkdir(species_name)
         cd(species_name)

         % Creating the plots
         figure(1)
         plot(T,c_p,'linewidth',1.5,'color','r')
         xlabel('Temperature(K)');
         ylabel('Specific Heat (J/kgK)');
         title('Specific Heat vs Temperature Plot')
         grid on
         m1 = 'Specific Heat of %s';
         m2 = species_name;
         m3 = sprintf(m1,m2);
         saveas(figure(1),sprintf('%s.png',m3))

         figure(2)
         plot(T,H,'linewidth',1.5,'color','g')
         xlabel('Temperature(K)');
         ylabel('Enthalpy (J/mol)');
         title('Enthalpy vs Temperature Plot')
         grid on
         m4 = 'Enthalpy(H) of %s';
         m5 = species_name;
         m6 = sprintf(m4,m5);
         saveas(figure(2),sprintf('%s.png',m6))

         figure(3)
         plot(T,S,'linewidth',1.5,'color','b')
         xlabel('Temperature(K)');
         ylabel('Entropy(J/K)');
         title('Entropy vs Temperature Plot')
         grid on
         m7 = 'Entropy of %s';
         m8 = species_name;
         m9 = sprintf(m7,m8);
         saveas(figure(3),sprintf('%s.png',m9))

         % Changing back to the working directory
         cd('D:\Project1_NASA_file_parsing')

         % Calculating the molecular weight
         [molecular_wt]=mw(species_name);
     end
end

 % Closing the file
 fclose(f1);
Explanation:
Initially the NASA data file is downloaded and save in the folder where the MATLAB scripting is carried out.
Then starting with the command in MATLAB to opne the file and extracting the data for the same.
f1=fopen('THERMO.dat','r') is the command to open and read that particular data.
Line 1 or q is the varible to get line 1 from the data file.
strsplit is separating the values in the folder through cells.
Now the extracting of the global temperatures categorizing it into various types like low,mid and high is done.
str2double(A{2})
str2double(A{3})
str2double(A{4})
These command reads the separated range of values from the cell which shows the values.
Similarly the fget1(f1) fetches the same from the above command.
getting the input from the user is done through the compound name available on the data file.
while~feof(fid) command read and display one line at a time until we reach the end of the file.Its the test carried out for the end of file.
If that particular compund name isn't available in the folder,this while command checks and end.
Extracting the local temperature, from the line 1 strsplit gets the data and then it compares the same before giving it as output.
Line28-33 executes the r=length of the string that is available on the cell as data. once the compund name is specified,it gets the data out and reads the entire length of that particular string and then executes.
Extracting the coefficients, here strpos is the string position and to find the E in the data file, the command is used.
Range of temperature for which the cp,H and S are calculated is commanded out with linspace.
Finally specifying that directory/folder name where the entire file parsing is available.
plots for the same is done commanding out with various parameters of the thermodynamics available.
Save figure command is added to the same.
Now calculating the molecular weight is done with the species name and the command is used as follows,[molecular_wt]=mw(species_name);
End and close the file.
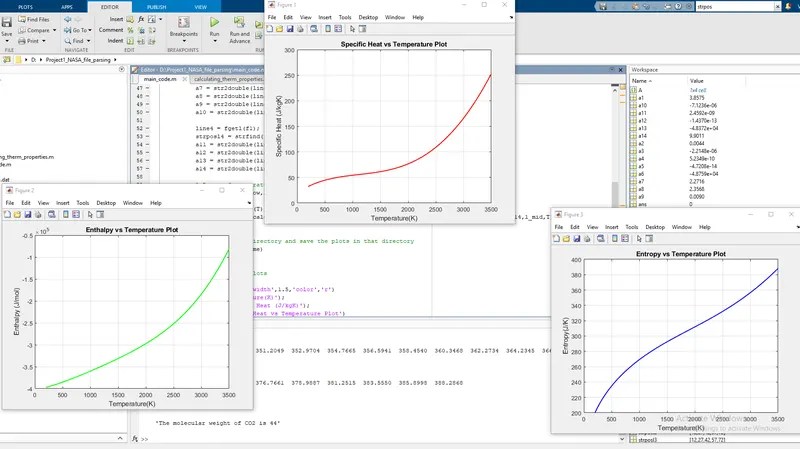
Screenshots:
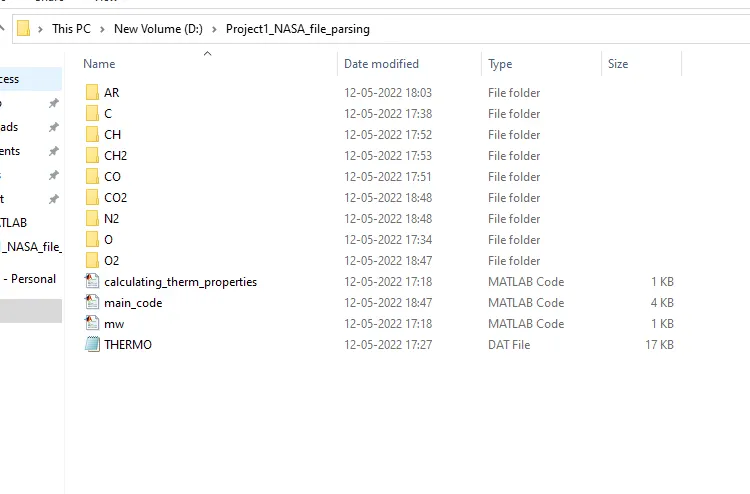
Screenshot2:
Result:
Scripted a function that extracts the 14 co-efficients and calculates the enthalpy, entropy and specific heats for all the species in the data file.
Calculated the molecular weight of each species.
Plotting is done for the follows, the Cp, Enthalpy and Entropy for the local temperature range (low temperature : high temperature) specific for each species.
The screenshots are attached for the subfolders/directories.