Project 1 - Parsing NASA thermodynamic data
File parsing :
It is the process of analysing a string of symbols either in natural language,computer language or data structures,conforming to the rules of formal grammer.The term parsing comes from the latin language,with computational linguistics the term is used to refer to the formal analysis of a computer sentence or other string of words into its constituents,resulting a prase tree showing syntax relation to each other which may contain sematic and other information.
specific heat:
It is the amount of heat per unit mass requried to raise temperature by one degree celsius.It is expressed has c
Cp/R = a1+a2 T + a3 T^2 + a4 T^3 + a5 T^4
Entrophy:
It is the measure of systems thermal energy per unit temperature that is available for doing unit work because work is obtained from ordered molecular motion,The amount of entropy is also measure of molecular disorder,or randomness of a system.
S/R = a1 lnT + a2 T + a3 T^2/2 + a4 T^3/3 + a5 T^4/4 +a7
Enthalapy:
It is the property of thermodynamic system,is equals to system internal energy plus the product of its pressure and volume in a system so has prevent mass transfer for the process at constant pressure,the heat absorbed is equals to change in enthalapy.
H/RT = a1 + a2 T/2 + a3 T^2 /3 + a4 T^3/4 + a5 T^4 /5 + a6/T
Explanation of the code:
1.Firstly we will input the parameter R and we will input a file THERMO.dat file and reading this file fopen command.
2.After we open fopen command which is used to open the file and fgetl command which is used to read the command line by line.
3.After we use fopen command we will assasing the variable called f1 thus the command fget(l) command acts like a line cursor ,which will retrive the next time while running the command for the second time and so on.
4. Now we will be skipping the next five lines to enter the pattern of values to the respective gas species.we will be using the for loop command to process the same for all gas species.
5.The name of the gas species we will be found out using 'findstr' command and for finding out the species we are going to locate the string which is present in after each species name.
6.And then we are going too use A(1:z(1)-1)which tells us the exact location of thr species name,using which the name of the gas species is stored in the variable species_name.
7.The local temperatures for the respective gas species is found similarly uding findstr command and we are going to locate the string using which we will find out the values of low temperature, mid temperature, high temperature which is assigned to the variables t1,t2and t3 respectively but the values we have achieved are string values so we have to change these string values to numeric values using str2num command.
8.Now we are going to extract the coefficients for the gas species in which the coefficinets locations are like in the 2 and 3 row and the rest in the 4 row.
9.We are going to extract the vlaues similarly like we did for finding out the local temperatures by using findstr and str2num commands and store it in the variables a1 to a14.For extracting we are going to locate the sting 'E' which is present in the each co-efficient and so it will be followed for all the co-efficient value and so it will be followed and for all the co-efficient values in the same line and then we can proceed for the next lines.
10.The values form a1 to a7 represents the high temperature co-efficinets and the vlaues from a8 to a14 represents low temperature co-efficients.
11.Temperature range vlaues from low temperature to high temperature is assigned using linspace command.
12. The for loop command is used to calculate the values of specific heat,enthalapy,entrophy and if-else command is also used to find out the requried values if the temperature values below mid temperature or above the mid temperature.
13.In order to calculate the molecular weight of the species we declare theh species elements in the form of cell array.Their atomic mass is declared in the form of array.Then initally molecular weight is declared as zero.
14.Now,for loop command is used to detect if there are more than ine species in the variables species_name and the respective values of the gas species are calculated and found out.
15.After the nested for loop the species_name which is in thw form of string is converted as number with strdouble command.The species_name which is now as number greater than 1,molecular weight is again calculated by having the atomic mass for the current species *n-1.
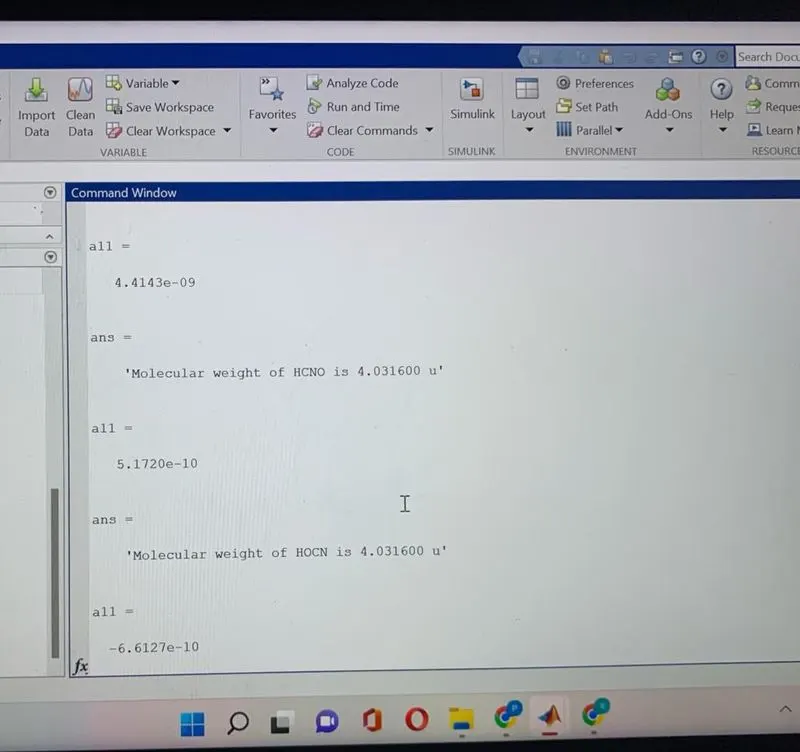
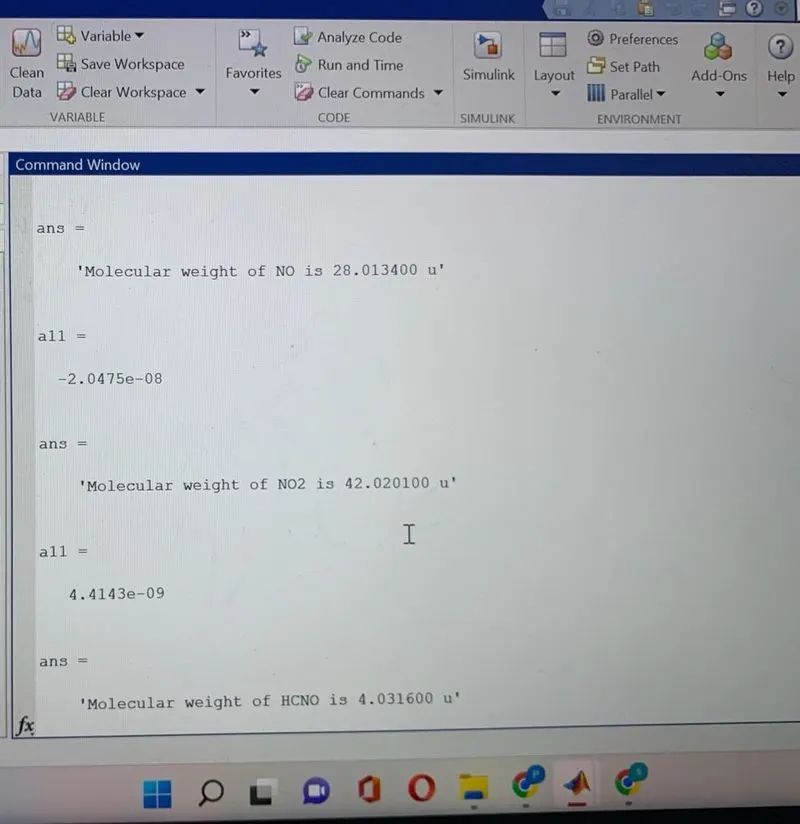
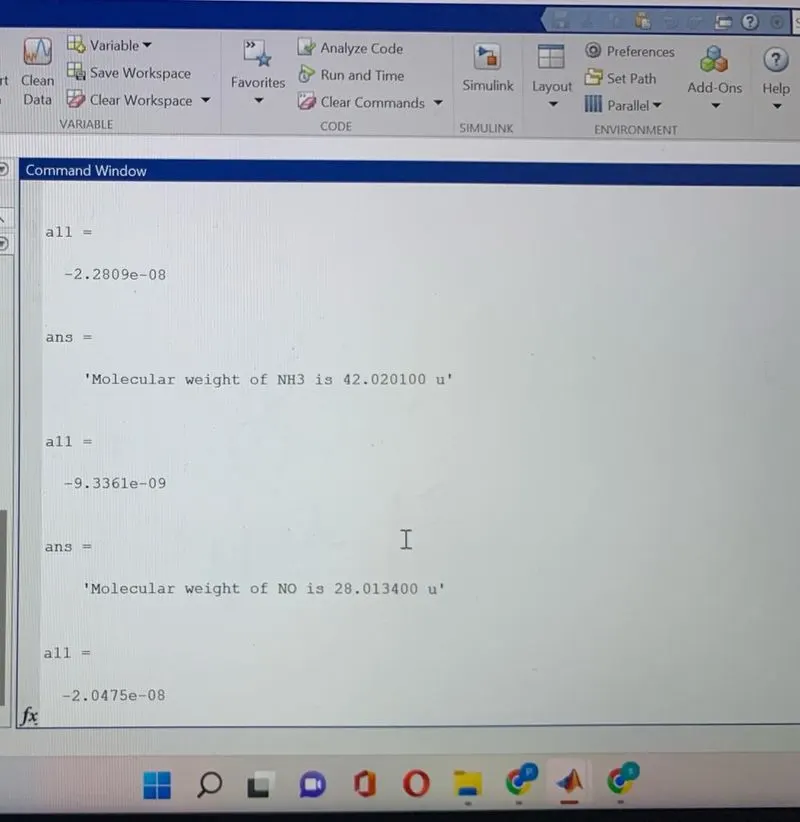
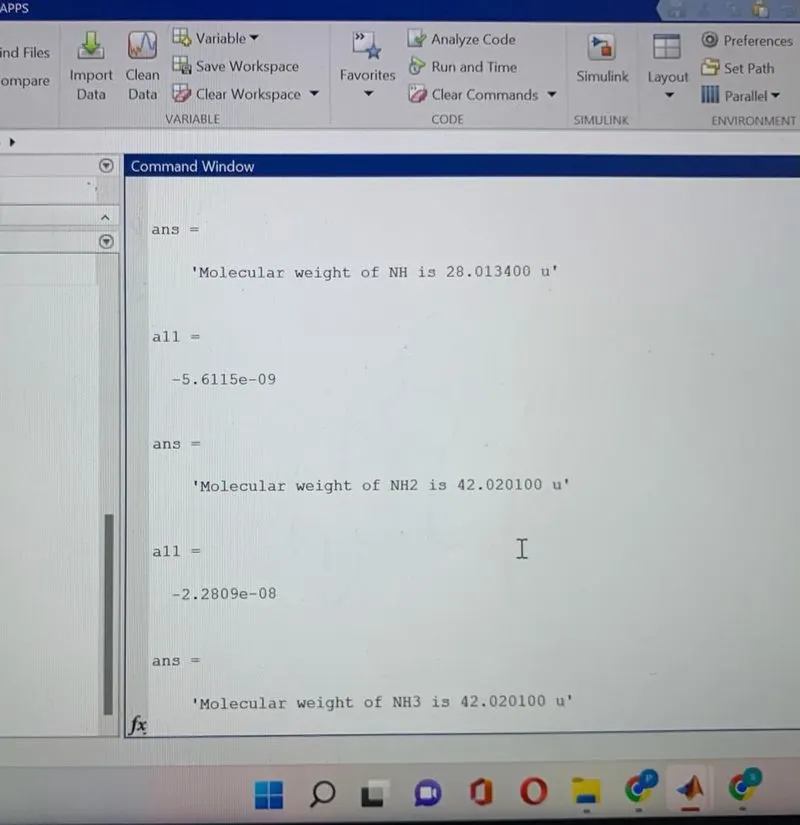
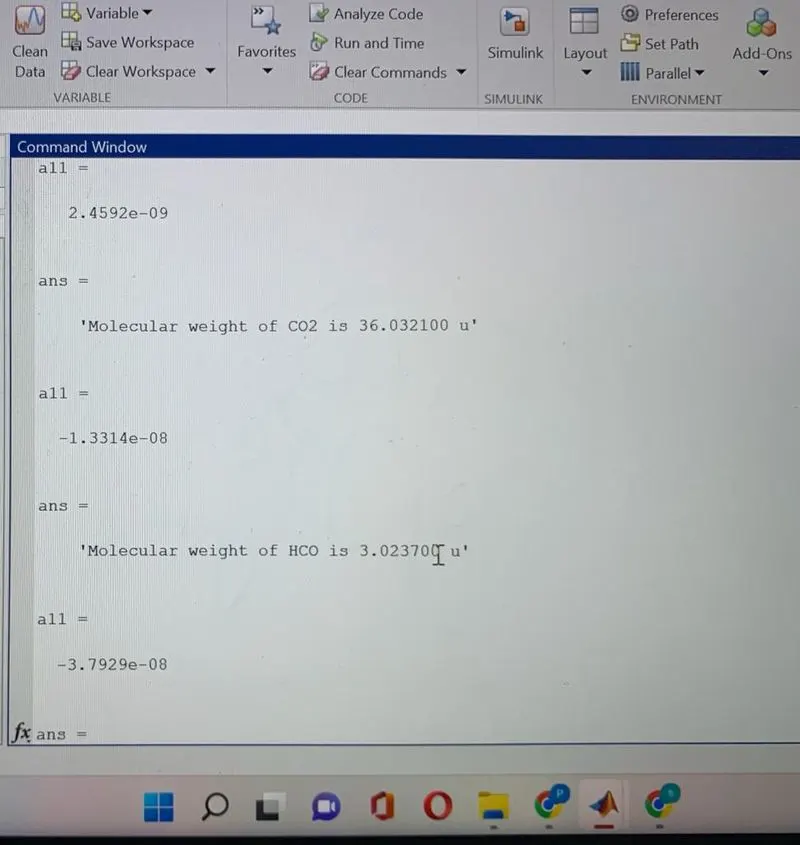
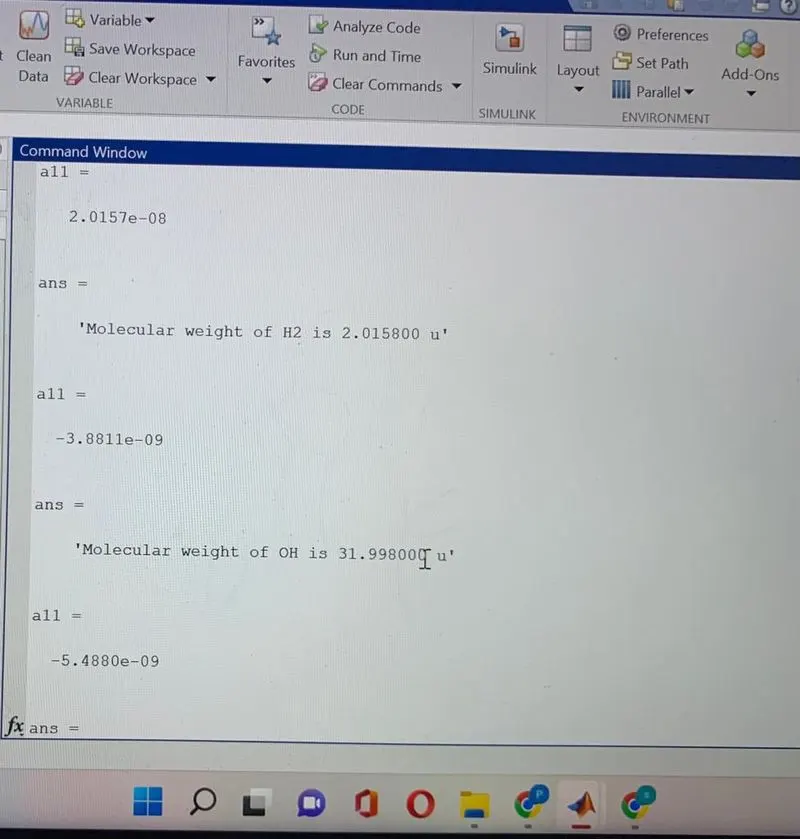
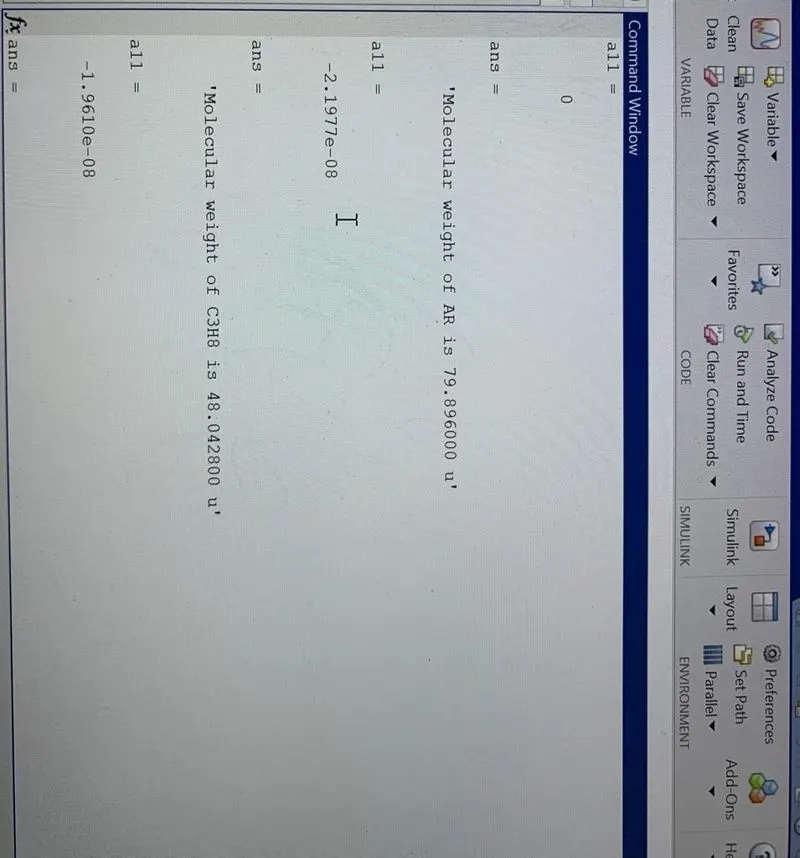
16.The value of the molecular weight is calculated for thr reverse gas species and is displayed in the command window.
17.Now,we are going to create plots for the obtained specific heat,enthaply and entrophy values andn save it in respective species_name folder automatically.
18.In order to create a new folder with species_name we are going to use mkdir command so that a new folder is created in the main folder.Now we have to change the current directory from the main folder to species_name folder so the cd command is used to di the same.
19.The plots for specific heat vs temperature,enthaply bs temperature and entrophy vs temperature is plotted and the labelling of axis and the naming of the title is also done along with the value of molecular weight.
20.To save the plots in the species_name folder,saveas command is used to save the plots in the current folder,after which to change the current directory to the main folder the old folder = cd() command is used.
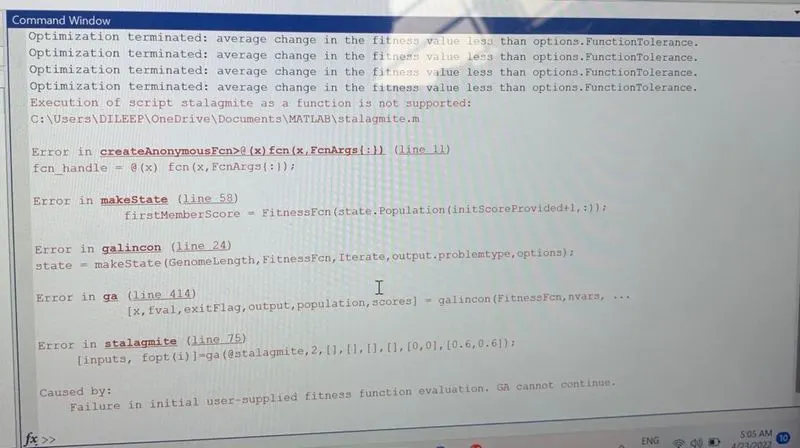
Errors faced while programming:
1.Execution of script has a function stalagmite is not supported.
2.Index number exceeds the number of array elements.
3.unable to change the current folder.
How to overcome errors:
1.when loading the stalagmite function always give the stalagmite functioin name correctly.
2. molecular weights and species elements should be equal in number.
3.The name of current folder you are saving give the name same has that of the current folder,\.
O2 graphs:
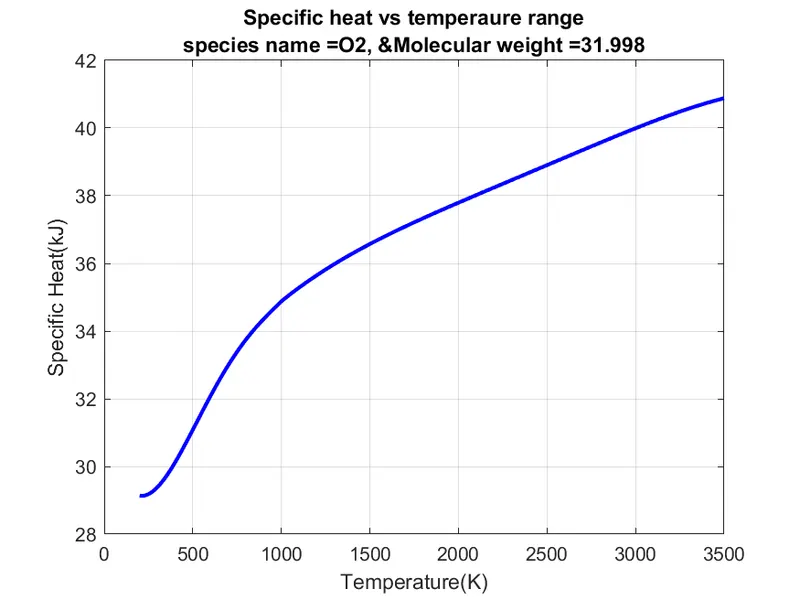
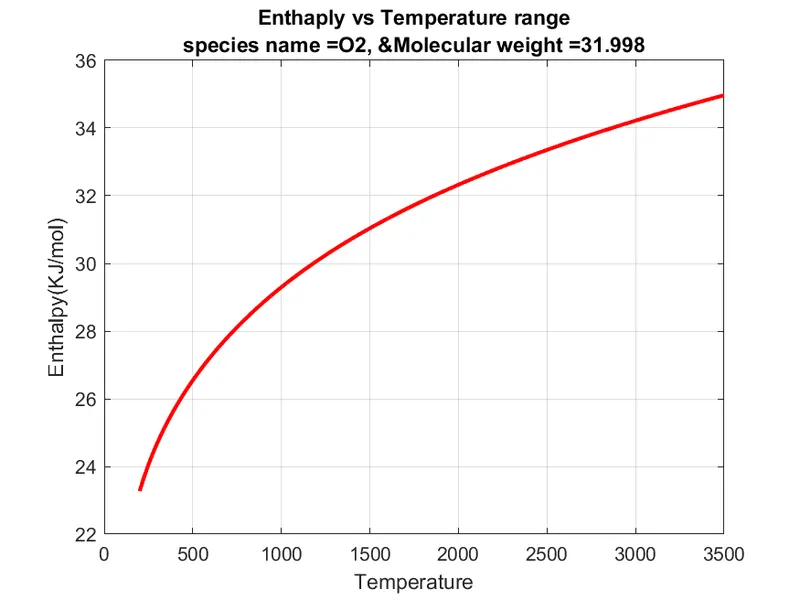
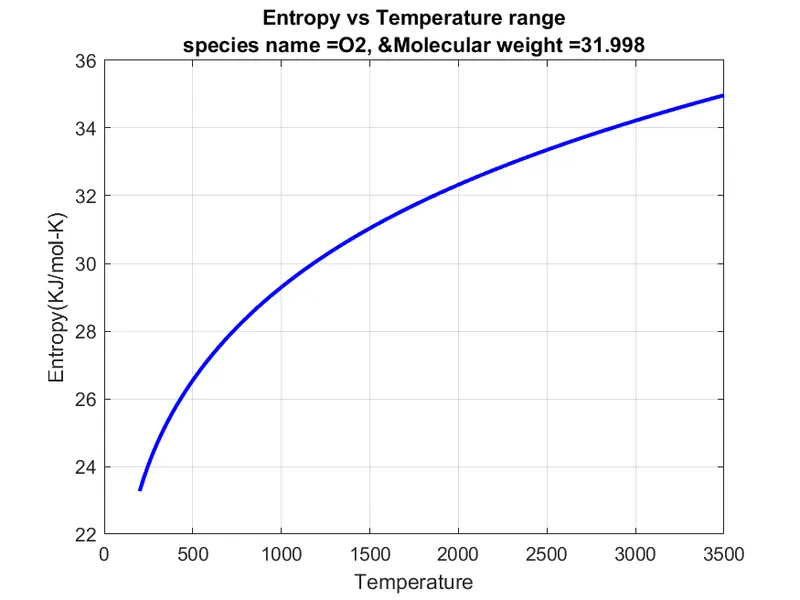
CO2 graph:
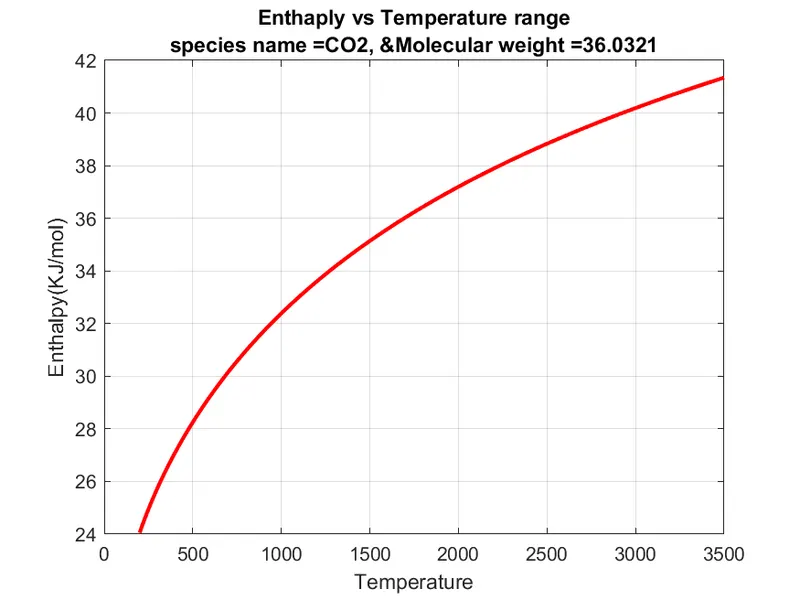
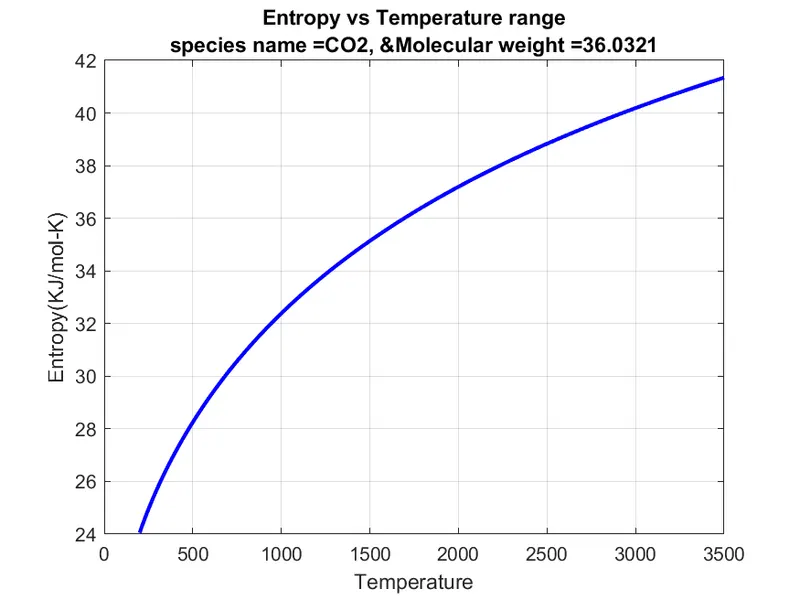
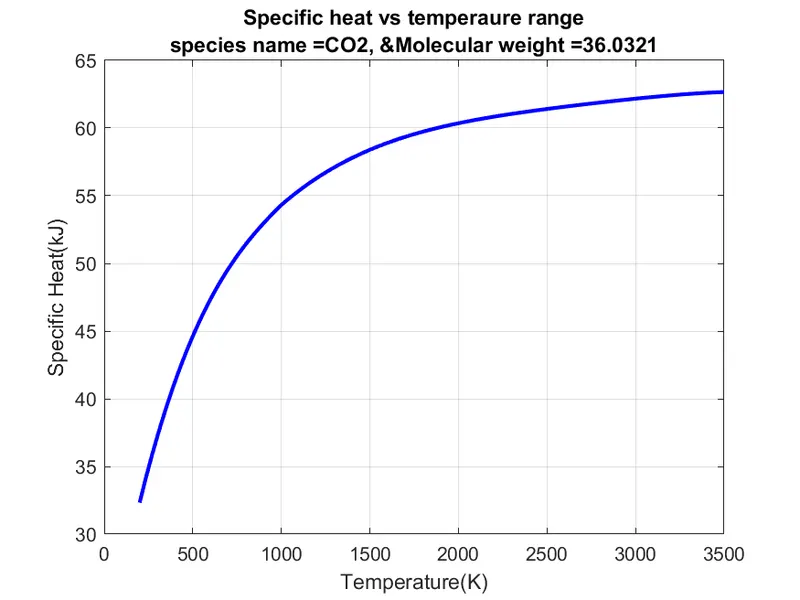
N2 graph:
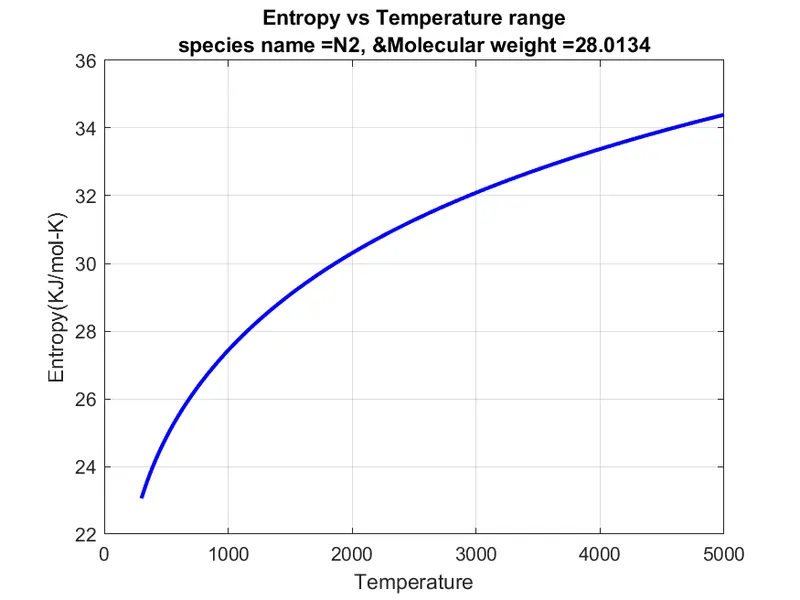
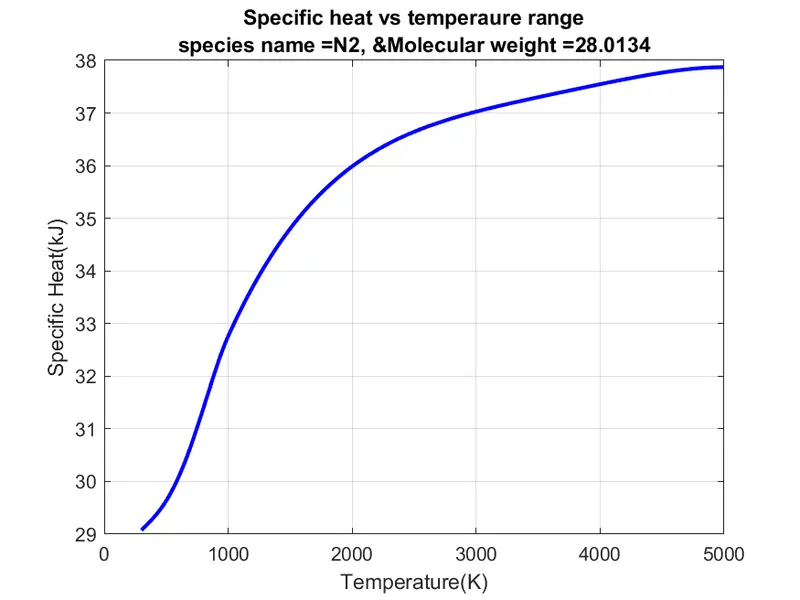
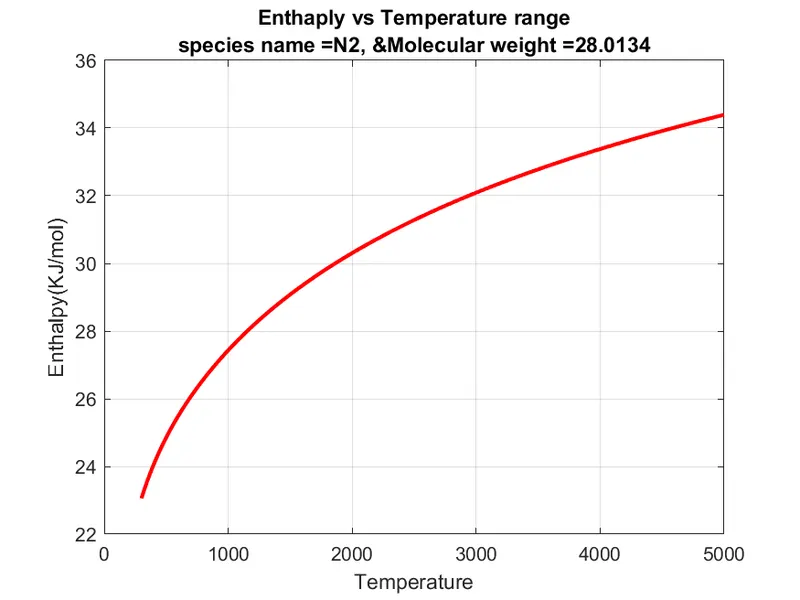
Folder containing species_name :

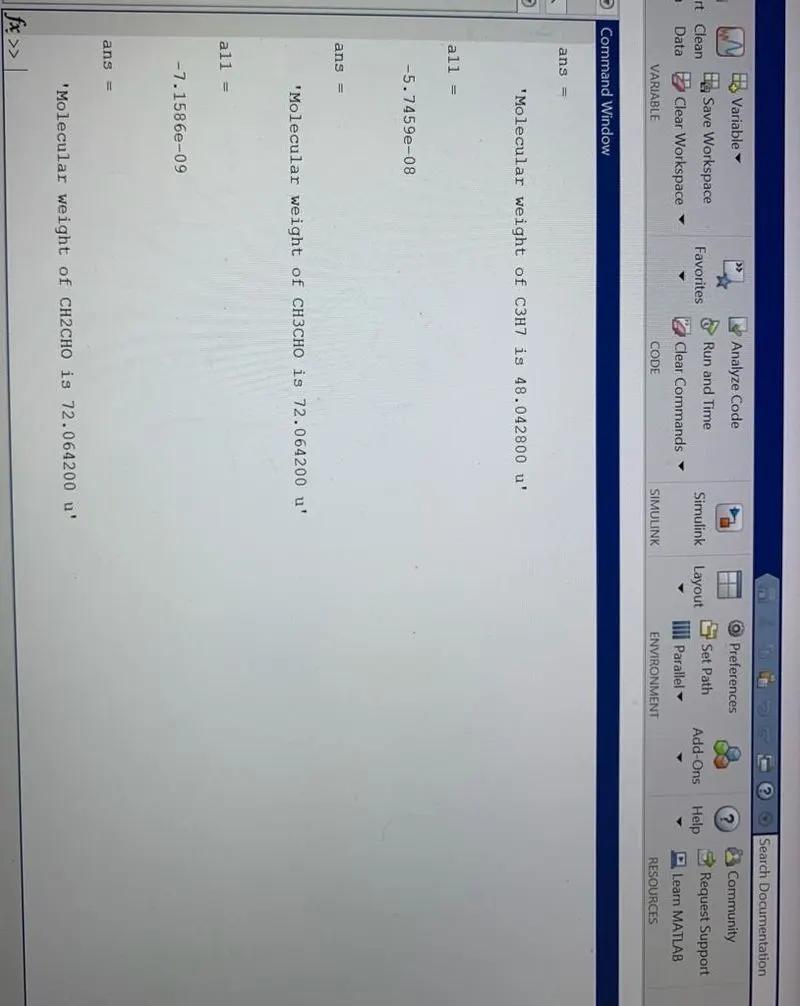
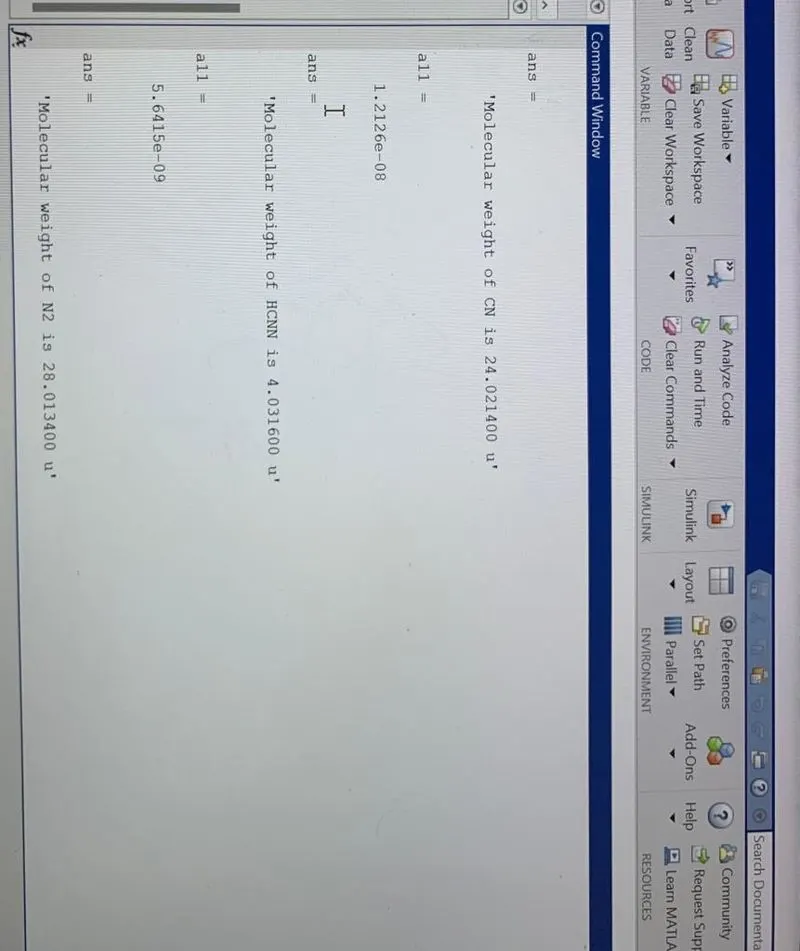
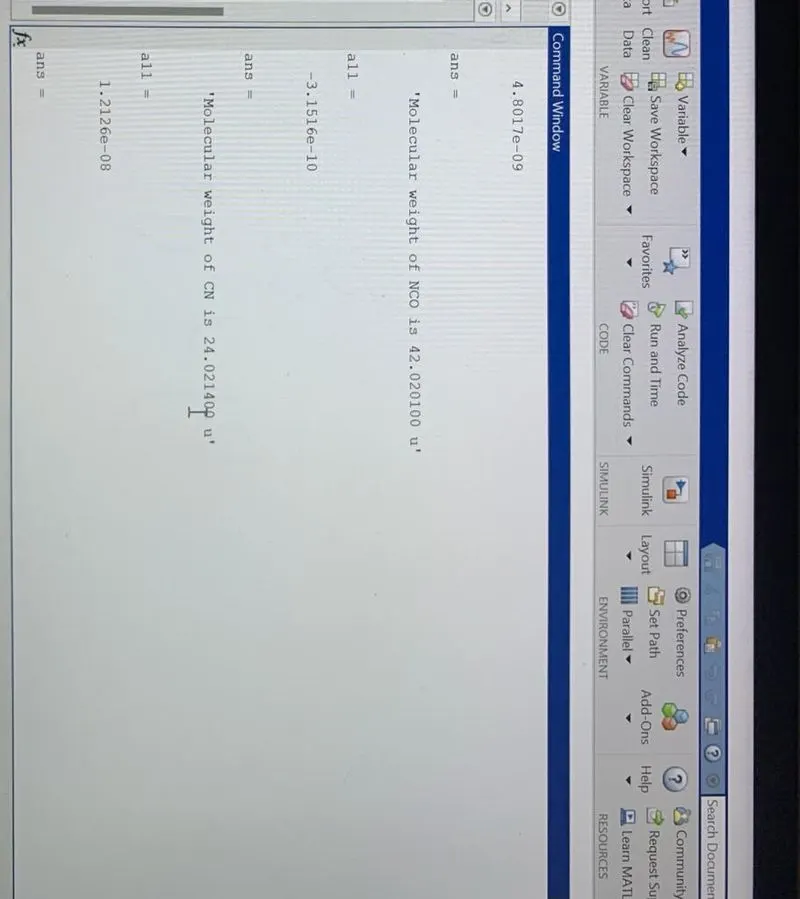
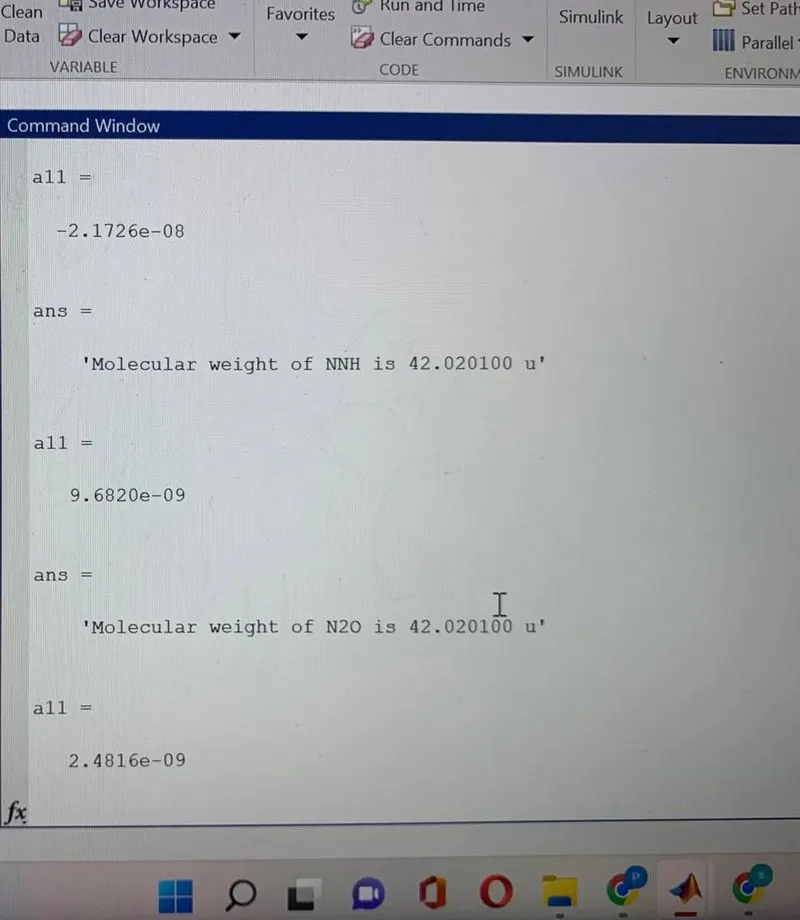
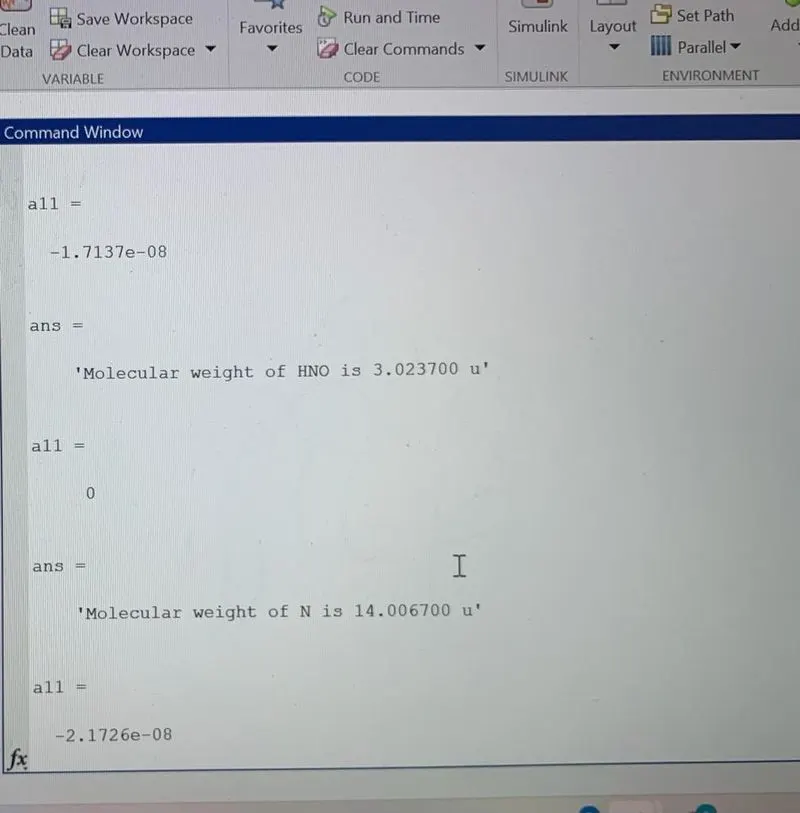
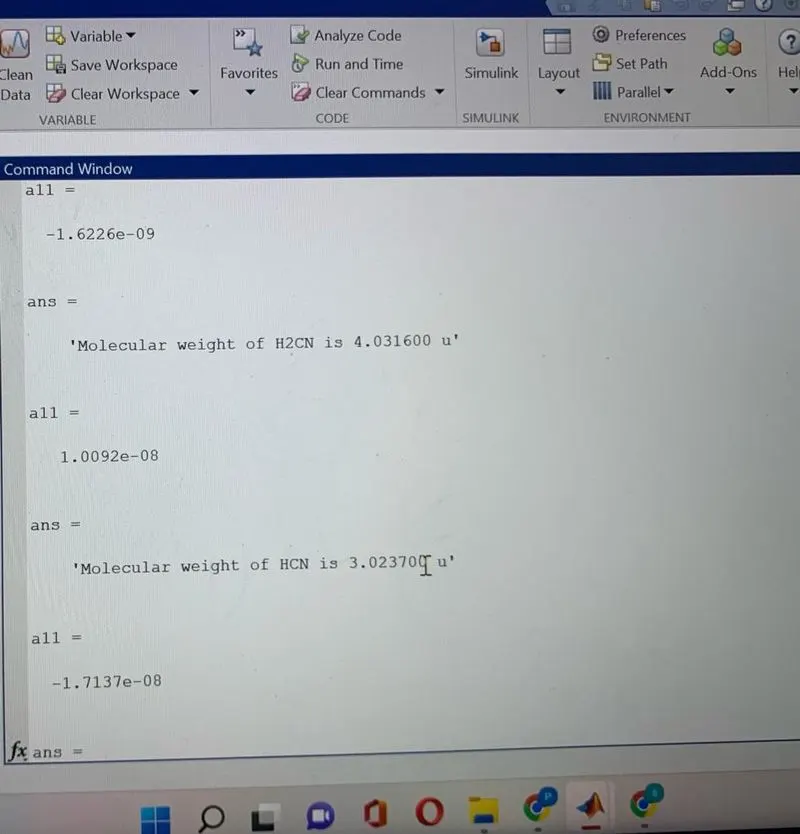
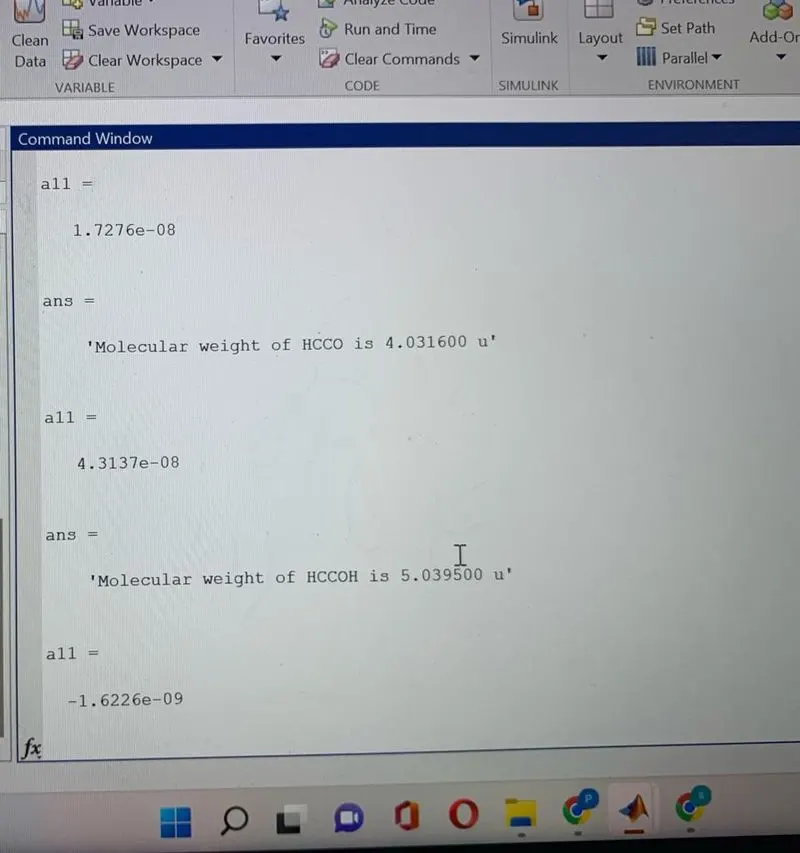
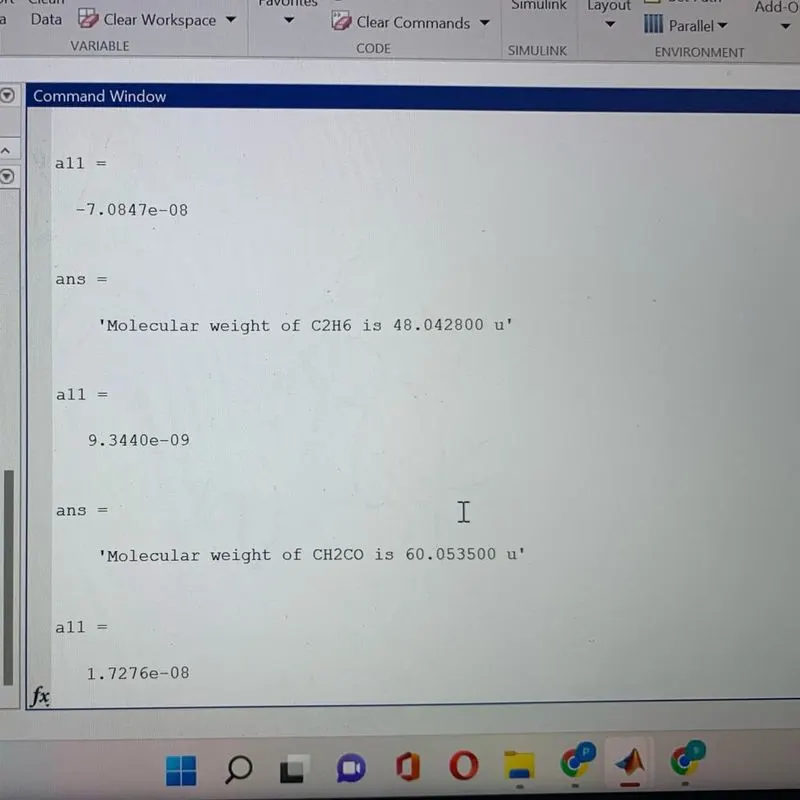
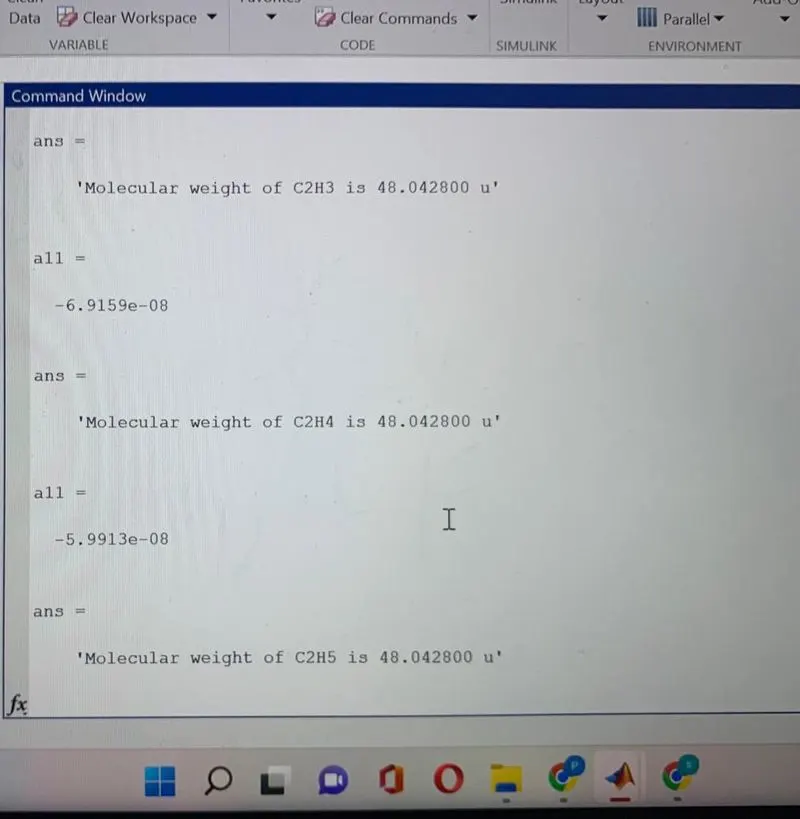
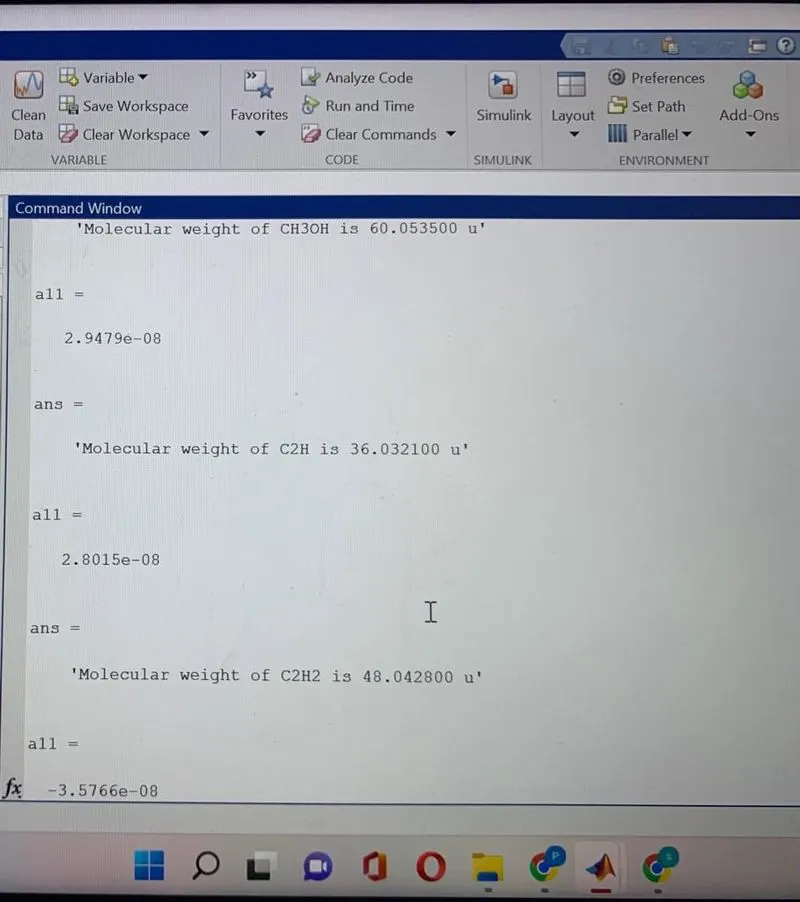
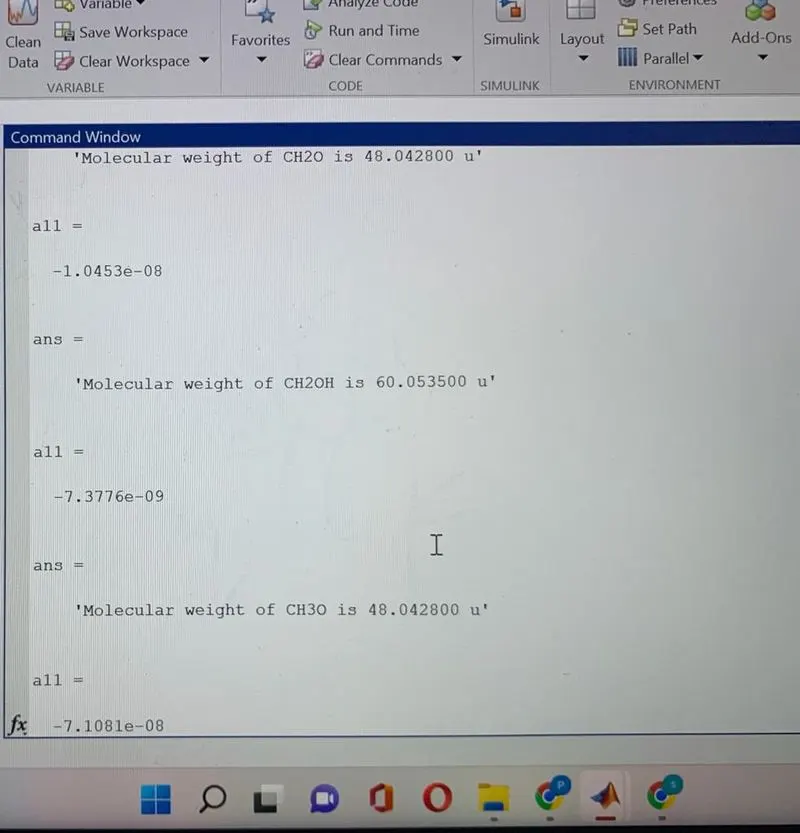
ERRORS :
clear all
close all
clc

%Input
R = 8.314; % k gas consatant

% reading data file
%open file and reading aThermo.data file
f1 = fopen('THERMO.dat','r');
fgetl(f1);
fgetl(f1);
fgetl(f1);
fgetl(f1);
fgetl(f1);

% extracting all species data

for i = 1:53


    % extracting name of gas species

    A = fgetl(f1);                 % reading the sixth line
    z = findstr(A,'  ');           % reading the species name
    species_name = A(1:z(1)-1);     % finding the species name

% extracting local temperatures of gas species

a = findstr(A,'.');           % finding string from lime
t1 = A(a(1)-3:a(1)+3);    % assining 't' variable for the localemperatures
t1  = str2num(t1);            % converting string in to number
t2  = A(a(3)-4:a(3)+3);
t2  = str2num(t2);
t3  = A(a(2)-4:a(2)+3);
t3  = str2num(t3);

% t1  = low temperature
% t2  = mid temperature
% t3  = high temperature


     %Finding First 7 higher and second 7 lower coefficients

     B = fgetl(f1);
     b = findstr(B,'E');

     a1 = B(1:b(1)+3);
     a1 =str2num(a1);
     a2 = B(b(1)+4:b(2)+3);
     a2 = str2num(a2);
     a3 = B(b(2)+4:b(3)+3);
     a3 = str2num(a3);
     a4 = B(b(3)+4:b(4)+3);
     a4 = str2num(a4);
     a5 = B(b(4)+4:b(5)+3);
     a5 = str2num(a5);

     C = fgetl(f1);
     c = findstr(C,'E');


     a6 = C(1:c(1)+3);
     a6 = str2num(a6);
     a7 = C(c(1)+4:c(2)+3);
     a7 = str2num(a7);

     % Finding lower coefficients
     a8 = C(c(2)+4:c(3)+3);
     a8 = str2num(a8);
     a9 = C(c(3)+4:c(4)+3);
     a9 = str2num(a9);
     a10 = C(c(4)+4:c(5)+3);
     a10 = str2num(a10);

     D = fgetl(f1);
     d = strfind(D,'E');
     a11 = D(1:d(1)+3);
     a11 = str2num(a11)
     a12 = D(d(1)+4:d(2)+3);
     a12 = str2num(a12);

     a13 = D(d(2)+4:d(3)+3);
     a13 = str2num(a13);
     a14 = D(d(3)+4:d(4)+3);
     a14 = str2num(a14);


     % first 7 are high temperature co- efficients from a1 to a7
     % second 7 are low temperature co_efficients from a8 to a14

     % creating the range from low to high values of local temperatures

     T = linspace(t1,t3,1000);

   for i = 1:length(T)

       if  T(i)>t2
       cp(i) = (a1+a2.*T(i)+a3.*T(i).^2+a4.*T(i).^3+a5.*T(i).^4)*R;
       H(i)  = (a1+(a2.*T(i))/2+(a3.*T(i)^2)/3+(a4.*T(i).^3)/4+(a5.*T(i).^4)/5+(a6./T(i)))*R.*T(i);
       S(i)  = a1.*log(T(i))+a2.*T(i)+(a3.*T(i).^2)/2+(a4.*T(i).^3)/3+(a5.*T(i).^4)/4+a7;
       else
           cp(i) = (a8+a9.*T(i)+a10.*T(i).^2+a11.*T(i).^3+a12*T(i).^4)*R;
           H(i) = (a8+(a9.*T(i))/2+(a10.*T(i).^2)/3+(a11.*T(i).^3)/4+(a12.*T(i).^4)/5+(a13./T(i)))*R.*1;
           S(i) = a8.*log(T(i)) + a9.*T(i)+(a10.*T(i)^2)/2+(a11.*T(i)^3)/3+(a12.*T(i).^4)/4+a14;
       end
   end

     %  molecular weight calculation

     elements = ['H','C','O2','N','A','S'];
     atomic_weight = [1.0079 12.0107 31.998 14.0067 39.948 32.065 ];
     mol_mass = 0;

     for l = 1 : length(species_name)
         for m = 1:length(atomic_weight)
             if strcmp(species_name(1),elements(m))
                 mol_mass = mol_mass + atomic_weight(m);
                 position = m;

             end
         end


         n = str2double(species_name(1));
     if n>1
         mol_mass = mol_mass + atomic_weight(position)*(n-1);

     end
     end


     % printing the molecular weight of the gas species in the command
     % window

     sprintf('Molecular weight of %s is %f u',species_name,mol_mass)

     % creating a folder to save the plots

     [status, msg, msgID] = mkdir(species_name);     % creating a new folder with the species name
     cd(sprintf(species_name)) % changing the directory to the folder of species


     % Plotting specific heat and temperature

     figure(1)
     plot(T,cp,'linewidth',2,'color','b');
     xlabel('Temperature(K)');
     ylabel('Specific Heat(kJ)');
     title({'Specific heat vs temperaure range',['species name =',species_name,', &Molecular weight =',num2str(mol_mass)]});
     grid on
     saveas(figure(1),'specific heat vs temp.png');

     %plotting entropy and temperature

     figure(2)
     plot(T,S,'linewidth',2,'color','b');
     xlabel('Temperature');
     ylabel('Entropy(KJ/mol-K)');
     title({'Entropy vs Temperature range',['species name =',species_name,', &Molecular weight =',num2str(mol_mass)]});

     grid on
     saveas(figure(2),'Entropy vs temp.png');

     % plotting enthalpy and temperature

     figure(3)
     plot(T,S,'linewidth',2,'color','r');
     xlabel('Temperature');
     ylabel('Enthalpy(KJ/mol)');
     title({'Enthaply vs Temperature range', ['species name =',species_name,', &Molecular weight =',num2str(mol_mass)]});
     grid on

     saveas(figure(3),'Enthalapy vs temp.png');

    old_folder = cd('C:\USERS\DILEEP\MATLAB DRIVE'  );  % Changing directory to original matlab path

end