Project 1 - Parsing NASA thermodynamic data
AIM: To write a code in MATLAB to parse the NASA thermodynamic data file and then calculate the thermodynamic properties of various gas species.
OBJECTIVE:
- To write a function that extracts the 14 coefficients and calculates the enthalpy, entropy, and specific heats for all the species in the NASA thermodynamic data file "Thermo.dat". The NASA polynomials have the form as shown below:

Where R is the universal gas constant, T is the temperature
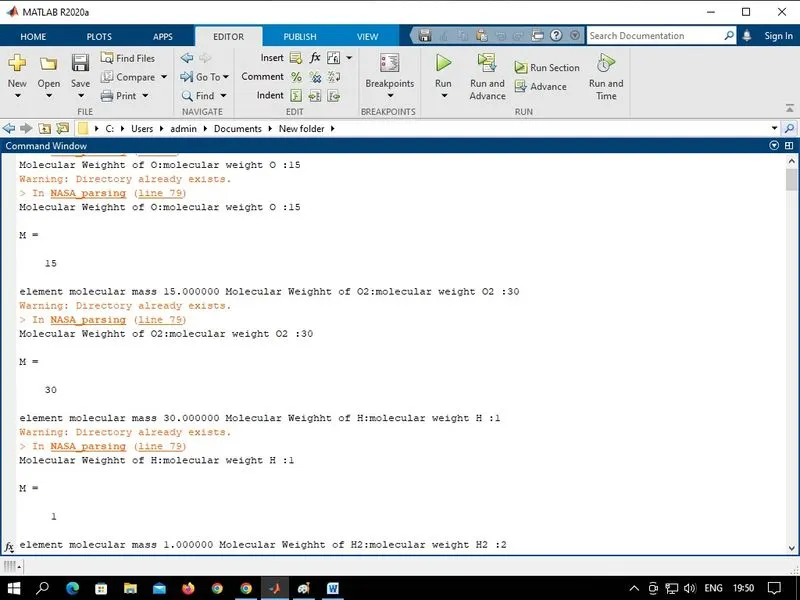
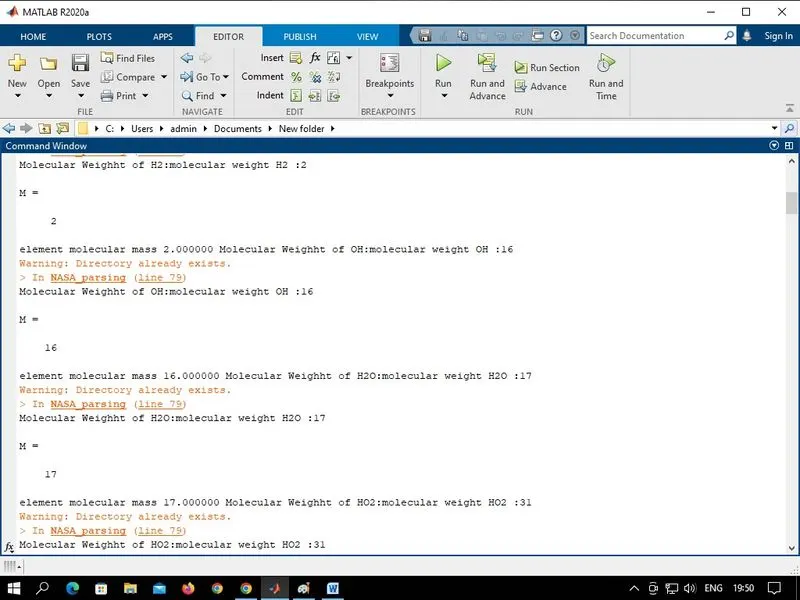
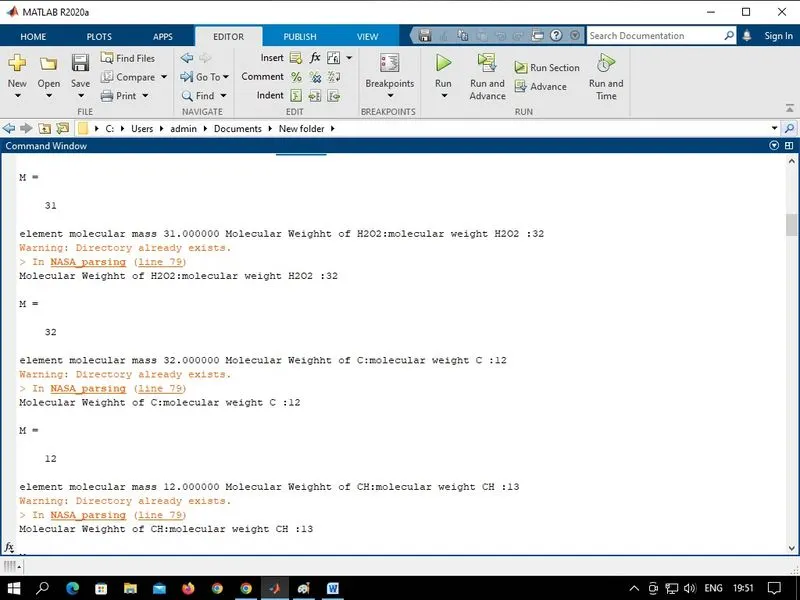
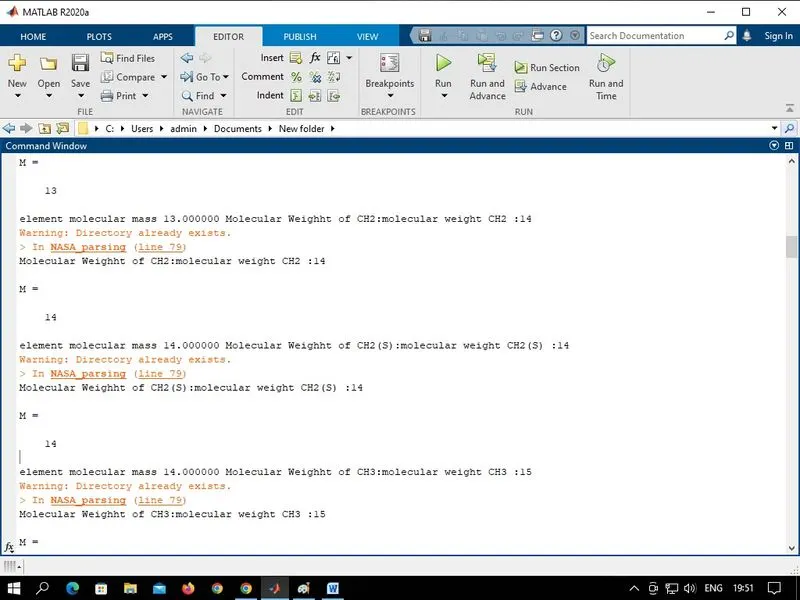
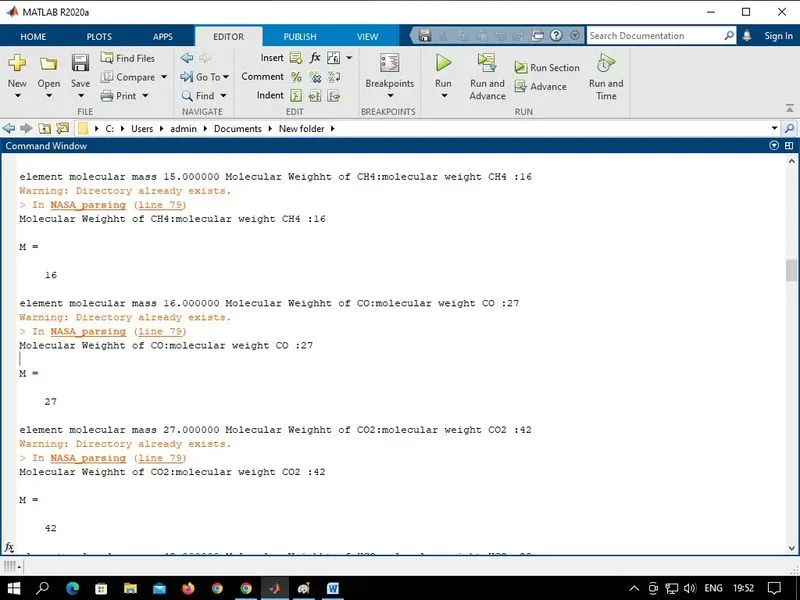
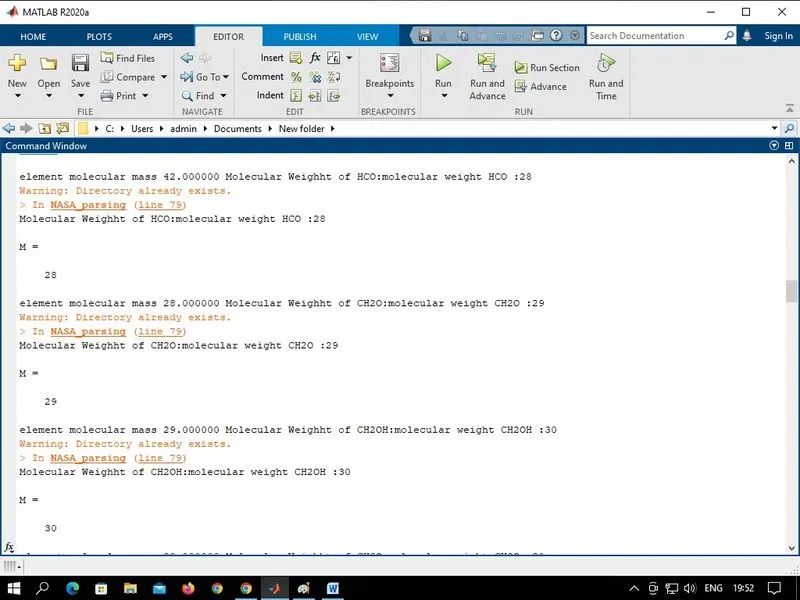
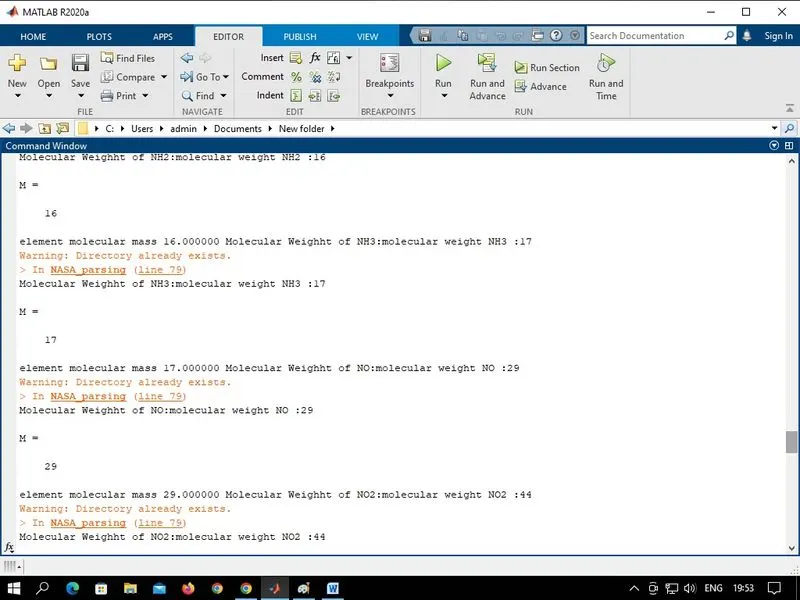
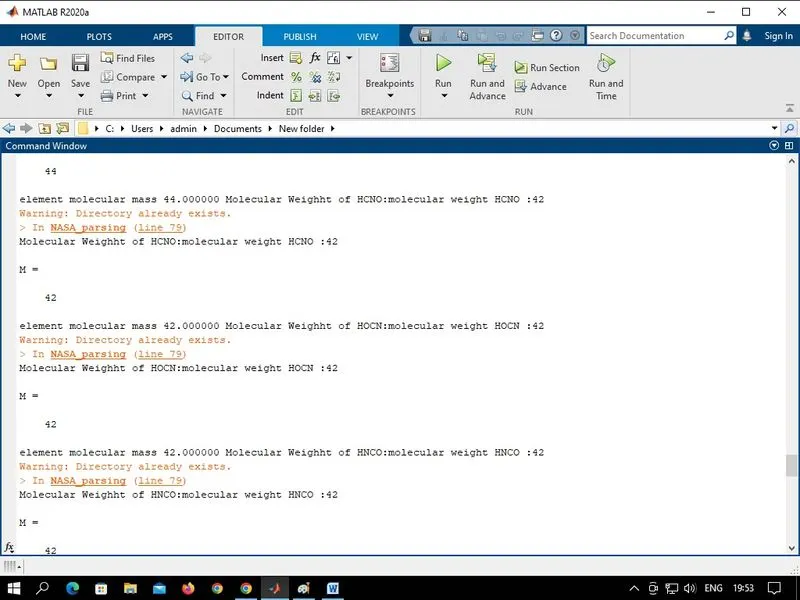
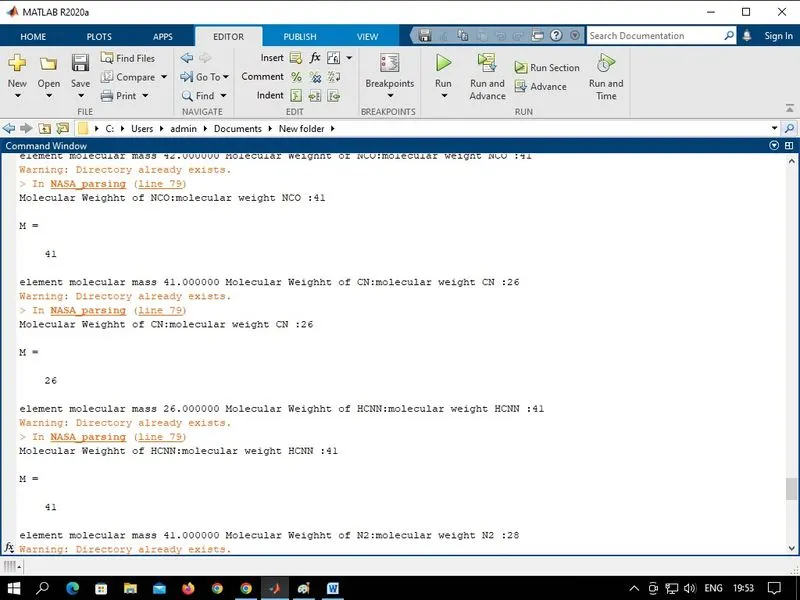
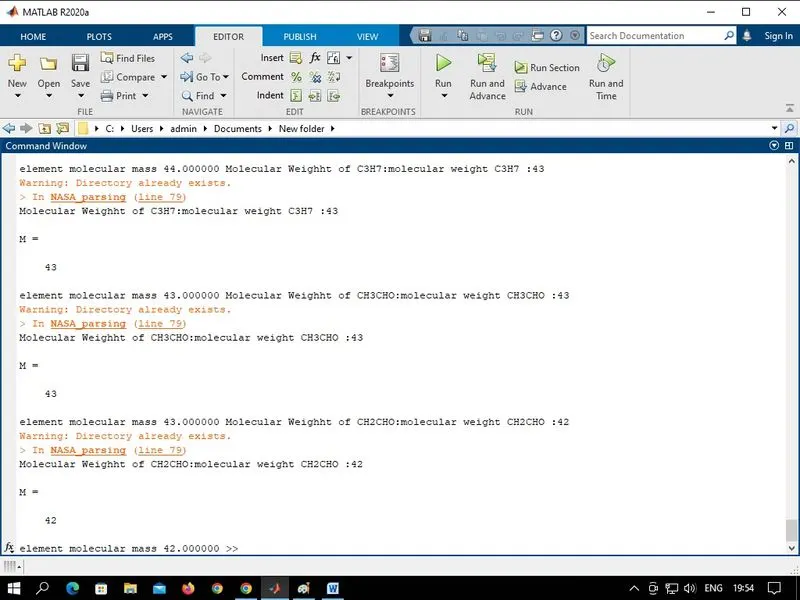
- To calculate the molecular weight of each element and display it in the command window.
- To plot the Specific heat(cp), Enthalpy(h), and Entropy(s) for the local temperature range (low temperature : high temperature) specific for each element.
- To save the plots as images with appropriate names and dump them in separate folders for each species with suitable name automatically.
FILE PARSING:
File parsing refers to how information can be read from a particular text file or any type of file and how that information can be used in a computer program.
Step 1 - Define the function. Step 2 - Create an InputParser object. Step 3- Add input to the scheme. Step 4-Set properties to adjust parsing. Step 5- Parse the inputs. Step 6- Use the inputs in function Step 7-Calling function.
NASA THERMODYNAMICS FILE
THERMO.dat file is a data file containing 14 coefficients for 53 different elements given by NASA these coefficients are utilized to calculate the specific heat enthalpy & entropy for a particular element. Each element has its own range of local temperature.

FUNCTION PROGRAMS:
SPECIFIC HEAT
Specific heat, the quantity of heat required to raise the temperature of one gram of a substance by one Celsius degree. The units of specific heat are usually calories or joules per gram per Celsius degree.
function [cp] = specific_heat(a1,a2,a3,a4,a5,b1,b2,b3,b4,b5,T,R,global_mid_temp)

if T <= global_mid_temp
    cp = R.*(b1+b2*T+b3*T.^2+b4*T.^3+b5*T.^4);
else
    cp = R.*(a1+a2*T+a3*T.^2+a4*T.^3+a5*T.^4);
end
end
ENTHALPY
It is a property of a thermodynamic system, is the sum of the system's internal energy and the product of its pressure and volume. It is a state function used in many measurements in chemical, biological, and physical systems at a constant pressure, which is conveniently provided by the large ambient atmosphere.
function [h] = enthalpy(a1,a2,a3,a4,a5,a6,b1,b2,b3,b4,b5,b6,T,R,global_mid_temp)

if T <= global_mid_temp
     h = R.*(b1+b2.*(T./2)+b3.*((T.^2)./3)+b4.*((T.^3)./4)+b5.*((T.^4)./5)+b6./T);
else
   h = R.*(a1+a2.*(T./2)+a3.*((T.^2)./3)+a4.*((T.^3)./4)+a5.*((T.^4)./5)+a6./T);
end
end
ENTROPY
Entropy is a scientific concept as well as a measurable physical property that is most commonly associated with a state of disorder, randomness, or uncertainty.
function [s] = entropy(a1,a2,a3,a4,a5,a7,b1,b2,b3,b4,b5,b7,T,R,global_mid_temp)

if T <= global_mid_temp
    s = R.*(b1.*log(T)+b2.*T+b3.*(T.^2/2)+b4.*(T.^3/3)+b5.*(T.^4/4)+b7);
else
    s = R.*(a1.*log(T)+a2.*T+a3.*(T.^2/2)+a4.*(T.^3/3)+a5.*(T.^4/4)+a7);
end
end
MOLECULAR WEIGHT
The molecular mass (m) is the mass of a given molecule: it is measured in dalton (Da or u). Different molecules of the same compound may have different molecular masses because they contain different isotopes of an element.
function [molecularweight] = molecular_weight(element_name)

atomic_name = ['H','C','N','O','A'];
fprintf('Molecular Weighht of ')
fprintf(element_name)
fprintf(':')

atomic_weight = [1 12 14 15 39];
molecularweight = 0;
%adding atomic number to obtain particular value
for i = 1:length(element_name);
    for j = 1:length(atomic_name);
        if strcmpi(element_name(i),atomic_name(j));
            molecularweight = molecularweight+atomic_weight(j);
            pos=j;
        end
    end
    n = str2num(element_name(i));
    if n>1
        molecularweight = molecularweight + atomic_weight(pos)*(n-1);
    end
end
fprintf('molecular weight %s :',element_name)
fprintf('%d',molecularweight)
disp(' ')
end
PROCEDURE:
FOR THE MAIN PROGRAM:
- As MATLAB is a case sensitive software, make sure of that during the programming. And clear and close all the previous data before
close all (closes all the previous plots )
clear all (clears all the variable data )
clc (clears the command window)
- Making a directory using 'mkdir' with location address.
- After that, reading the text file 'Thermo.dat' file and opening by using 'fopen' and 'r’ of reading command.
- For reading the line in a text file using 'fgetl'.
- To obtain the temperature range from the Thermo.dat, using 'strsplit' to split the temperature into a particular string cell.
- Used 'str2num' for converting string cell to numbers.
- Divided the temperature into a string and then converted to a number so that temperature values can be used separately to solve the NASA thermodynamics.
- Using ‘for & end' loops to skip the next three comment lines in the text file.
- Reading all the 53 species to plot specific hear (op), enthalpy(H), and entropy(s), with temperature values, and to find the molecular weights.
- Used 'for' loop to read 53 species.
- Used 'strfind' to find string.
- Using 'linspace' specified the temperature range from low to high. Adding universal gas constant value’R’.
- Extracted higher and lower temperare coefficient by reading line by line from the species.
- Calling specific heat, enthalpy, en ropy function codes. 16. Calculating Molecular weight.
Syntax Used during Coding
- Fopen : Open a file or obtain information about open files
- r : Open the file for reading
- fgetl: Read line from file
- strsplit: Split string or character vector at specified delimiter
- str2num: Convert character array or string to numeric array
- strfind: Find one string within another
- linspace: Generate linearly spaced vectors
- fprintf: Write formatted data to file
- pwd: Identify current directory
- mkdir: Make new directory
- cd: Change working directory
RESULTS:
MAIN PROGRAM
close all
clear all
clc

% input
R = 8.314; %gas constant

mkdir 'C:\Users\admin\Documents\New folder'
%to read the thermo.dat
%for header block
f1 = fopen('THERMO.dat','r');
heading = fgetl(f1);
%for the temperature line
global_temp =fgetl(f1);
t = strsplit(global_temp,' '); %spliting
global_low_temp = str2num(t{2});
global_mid_temp = str2num(t{3});
global_high_temp = str2num(t{4});

T = linspace(global_low_temp,global_high_temp,1000);

%for next 3 comment lines
comment1 = fgetl(f1);
comment2 = fgetl(f1);
comment3 = fgetl(f1);

%for species block
% their are 53 sets of the data
for i = 1:53
    line1 = fgetl(f1);
    L = strsplit(line1,' ');
    element_name = (L{1});

    line2 = fgetl(f1);
    A = strfind(line2,'E');

    a1 = str2num(line2(1:A(1)+3));
    a2 = str2num(line2(A(1)+4:A(2)+3));
    a3 = str2num(line2(A(2)+4:A(3)+3));
    a4 = str2num(line2(A(3)+4:A(4)+3));
    a5 = str2num(line2(A(4)+4:A(5)+3));

    line3 = fgetl(f1);
    B = strfind(line3,'E');

    a6 = str2num(line3(1:B(1)+3));
    a7 = str2num(line3(B(1)+4:B(2)+3));

    b1 = str2num(line3(B(2)+4:B(3)+3));
    b2 = str2num(line3(B(3)+4:B(4)+3));
    b3 = str2num(line3(B(4)+4:B(5)+3));

    line4 = fgetl(f1);
    C = strfind(line4,'E');

    b4 = str2num(line4(1:C(1)+3));
    b5 = str2num(line4(C(1)+4:C(2)+3));
    b6 = str2num(line4(C(2)+4:C(3)+3));
    b7 = str2num(line4(C(3)+4:C(4)+3));

    %specific heat
    cp = specific_heat(a1,a2,a3,a4,a5,b1,b2,b3,b4,b5,T,R,global_mid_temp);

    %enthalpy
    h = enthalpy(a1,a2,a3,a4,a5,a6,b1,b2,b3,b4,b5,b6,T,R,global_mid_temp);

    %entropy
    s = entropy(a1,a2,a3,a4,a5,a7,b1,b2,b3,b4,b5,b7,T,R,global_mid_temp);

    %calculating molecular weight
    molecularweight(i) = molecular_weight(element_name);

    molecular_list = fopen('molecualr weight.txt','a+');
    fprintf(molecular_list,'molecular weight of %s is %d \n',element_name,molecularweight);
    fclose(molecular_list);

    %saving the data
    cur_dir = pwd;
    mkdir(element_name);
    cd(element_name);

    %plotting
    %for specific heat
    figure(1);

    plot(T,cp,'linewidth',3,'color','r');
    title(sprintf('specific heat vs temperature for %s',element_name));
    ylabel('specific heat');
    xlabel('temperature');
    grid on;
    saveas(figure(1),'specific heat.jpg');


    %for enthalpy
    figure(2);

    plot(T,h,'linewidth',3,'color','b');
    title(sprintf('enthalpy vs temperature for %s',element_name));
    ylabel('enthalpy');
    xlabel('temperature');
    grid on;
    saveas(figure(2),'enthalpy.jpg')


    %for entropy
    figure(3);

    plot(T,s,'linewidth',3,'color','g');
    title(sprintf('entropy vs temperature for %s',element_name));
    ylabel('entropy');
    xlabel('temperature');
    grid on;
    saveas(figure(3),'entropy.jpg');

    cd(cur_dir);

    %molecular weight
    M = molecular_weight(element_name)
    f2 = fopen('moecular mass','w');
    fprintf('%s %s %f ','element','molecular mass',M);
    fclose(f2);
end
GRAPHS:
FOR O2
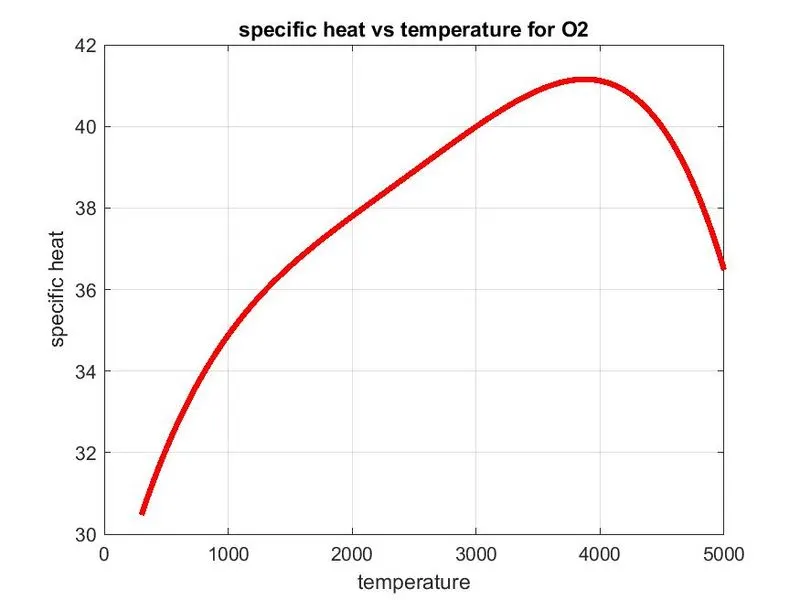
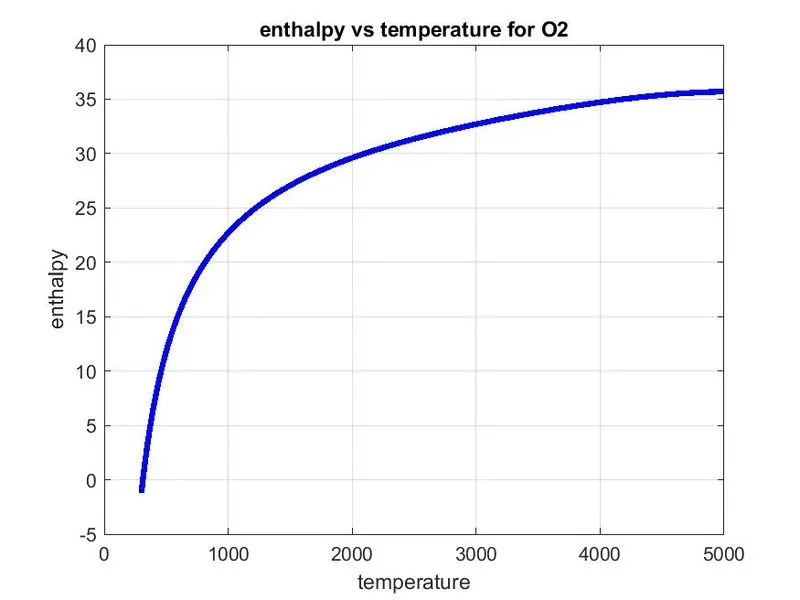
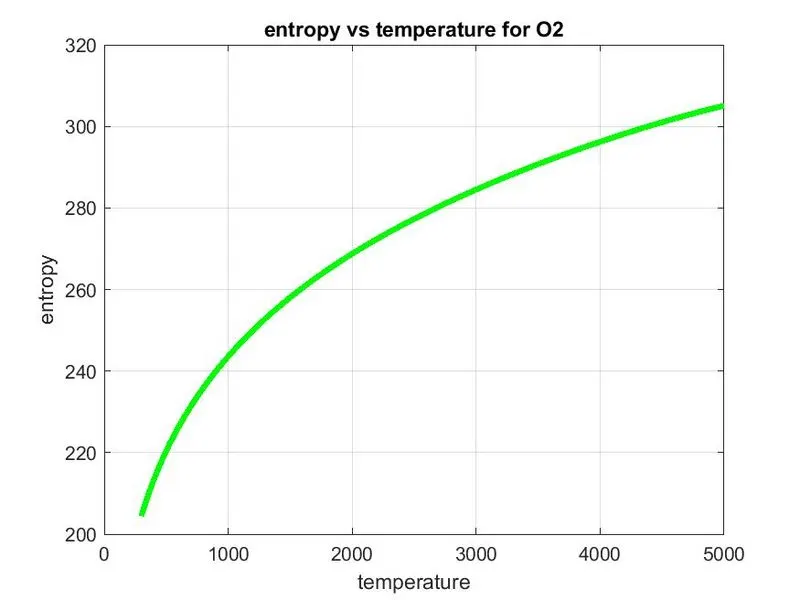
FOR N2
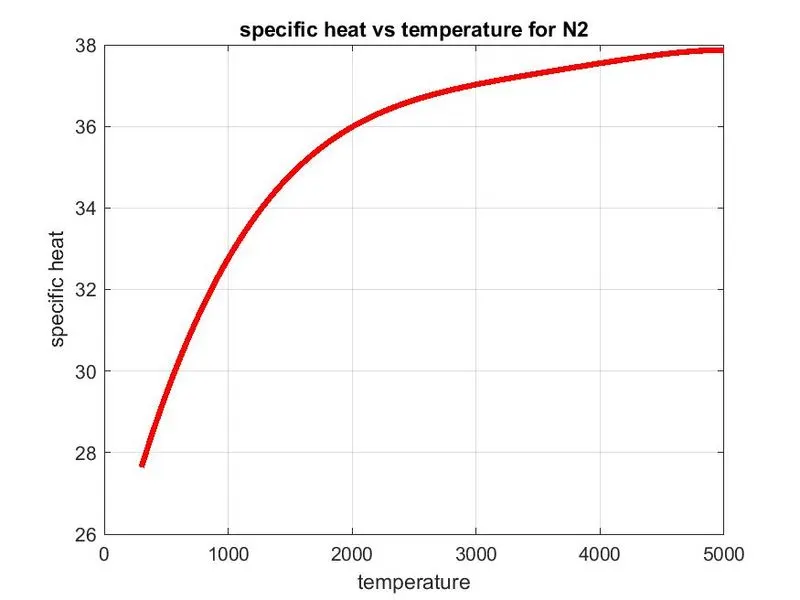
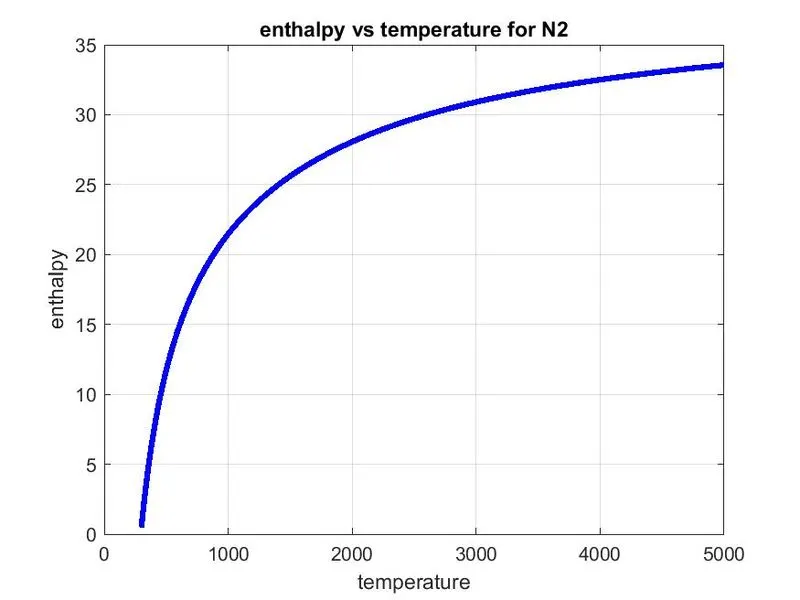
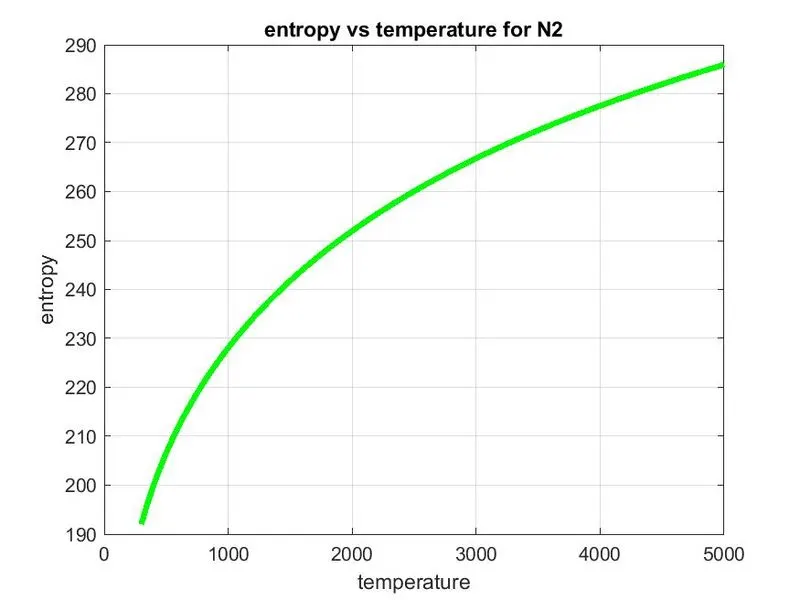
FOR CO2
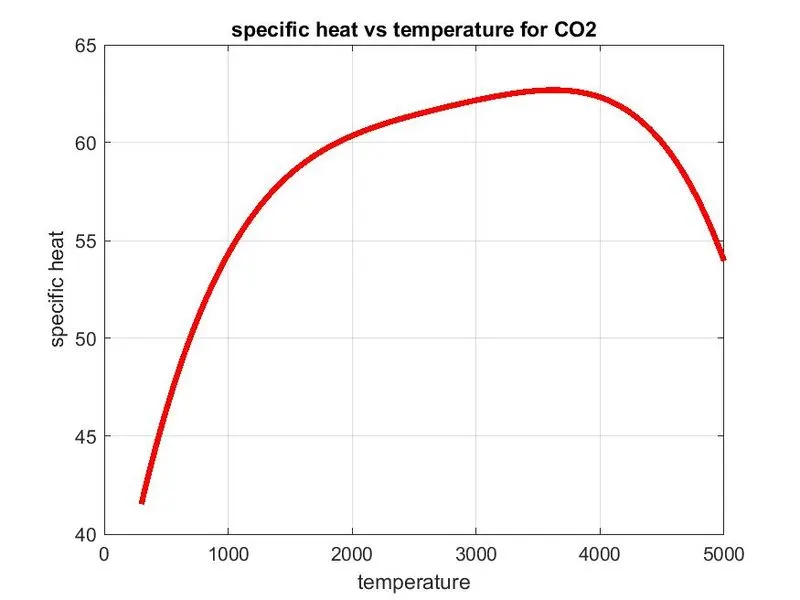
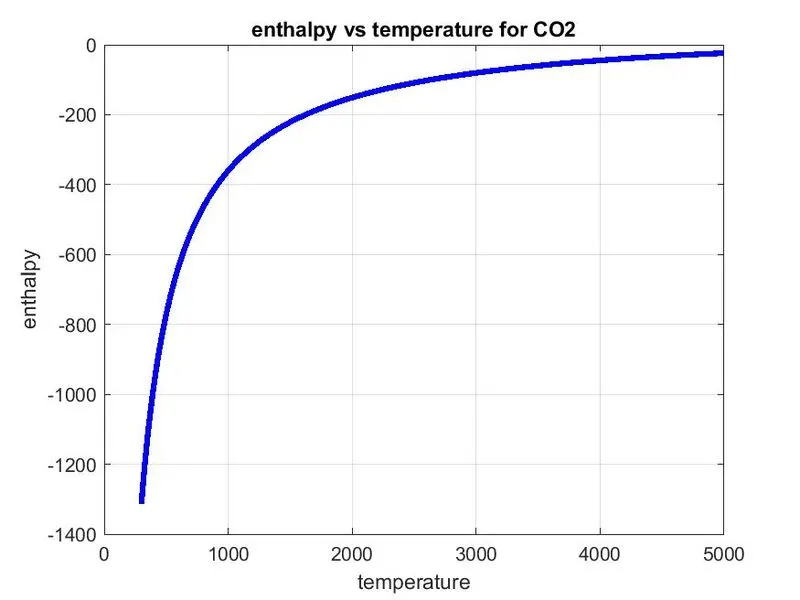
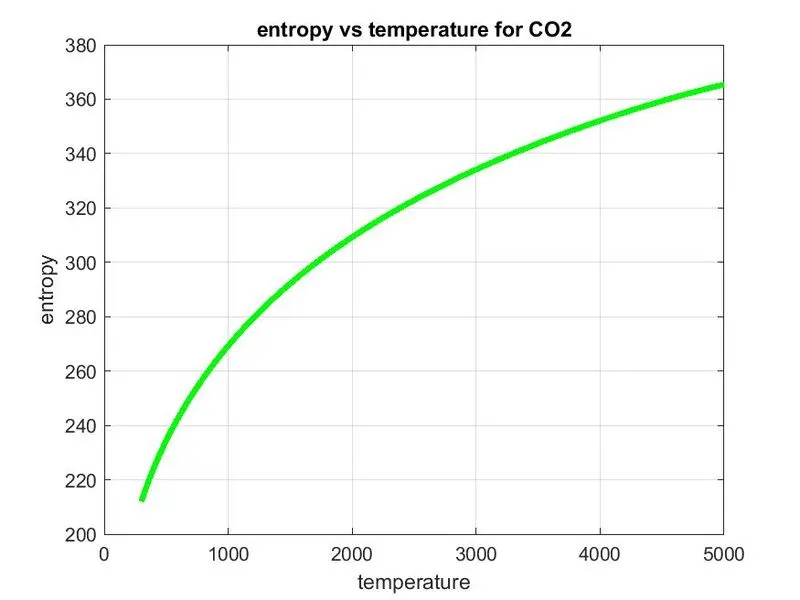
WORKSPACE:
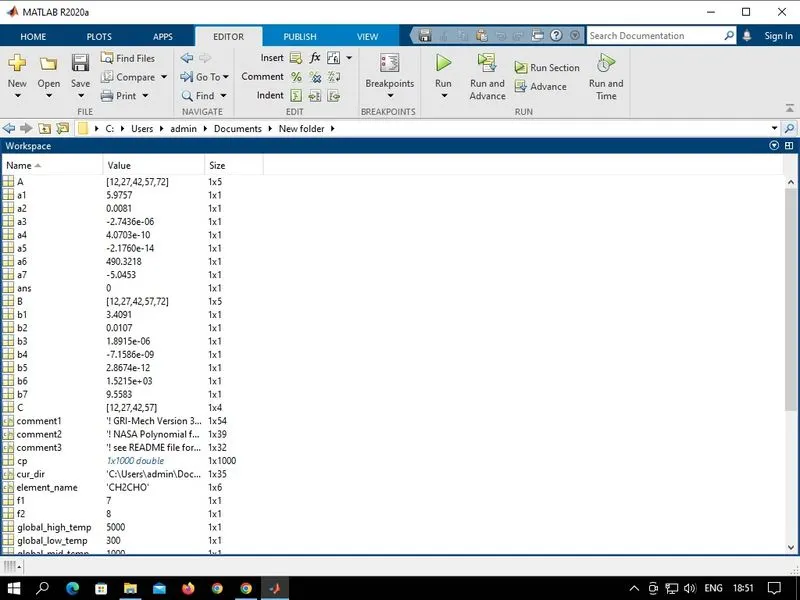
MOLECULAR WEIGHT: