Project 1 - Parsing NASA thermodynamic data
AIM:
1. Write a function that extracts the 14 co-efficients and calculates the enthalpy, entropy and specific heats for all the species in the data file.
2. Calculate the molecular weight of each species and display it in the command window.
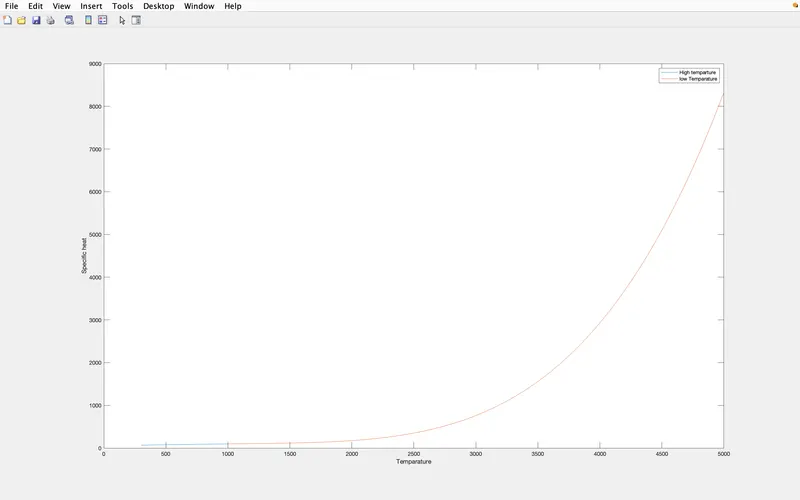
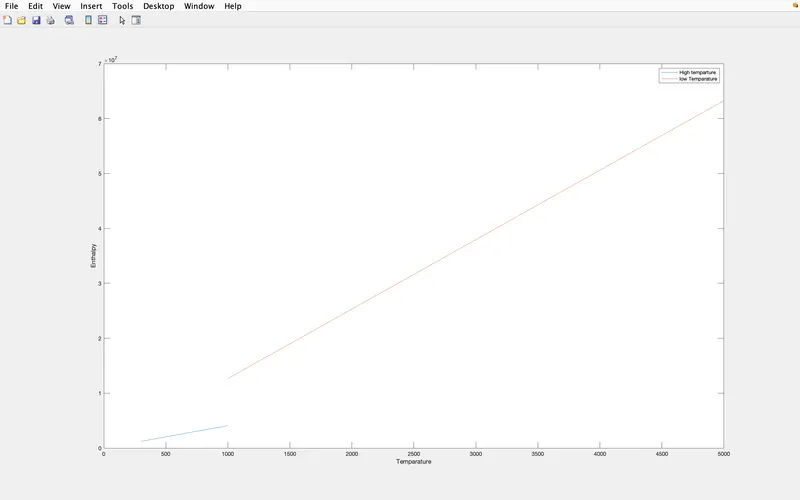
3. Plot the Cp, Enthalpy and Entropy for the local temperature range (low temperature : high temperature) specific for each species.
4. Save the plots as images with appropriate names and dump them in separate folders for each species with suitable name. All these should be generated automatically.
5. The main program that you will submit will just take the "THERMO.dat" file as an input and generate Cp, H and S plots.
OBJECTIVES:
• Write a function that extracts the 14 co-efficients and calculates the enthalpy, entropy and specific heats for all the species in the data file. You will be reading this file NASA thermodynamic data.

Calculate the molecular weight of each species
Plot the Cp, Enthalpy and Entropy for the local temperature range (low temperature: high temperature) specific for each species • Save the plots as images with appropriate names and dump them in separate folders for each species with suitable name. All these should be generated automatically.
Plots for 02, N2 and Co2 species.
CODE:
%CODE

clear all
close all
clc

f1= fopen('THERMO.dat','r');
fgetl(f1);

G_temp = str2num (fgetl(f1));

%Global temparture

G_Low = G_temp (1);
G_mid = G_temp (2);
G_high= G_temp(3);

for i = 1:3
    fgetl(f1);
end

R = 8.3145; %J/Mol*Km (units)

for j = 1:53

line = fgetl(f1);

A = strsplit(line,' ');

%species

species= (A{1});

% Local_temparture

Low = str2num(A{end-3});
High = str2num(A{end-2});
Mid = str2num(A{end-1});

%co-efficients

a_line = fgetl(f1);
a = findstr(a_line, 'E'); %#ok<*FSTR>

A1 = a_line (1:a(1)+3);
A1 = str2num (A1); %#ok<*ST2NM>
A2 = a_line (a(1)+4:a(2)+3);
A2 = str2num (A2);
A3= a_line (a (2)+4:a(3)+3);
A3= str2num (A3);
A4 = a_line (a(3)+4:a(4)+3);
A4 = str2num(A4);
A5 = a_line(a(4)+4:a(5)+3);
A5 = str2num (A5);

b_line = fgetl(f1);
b= findstr(b_line, 'E');

A6 = b_line (1:b(1)+3);
A6 = str2num (A6);
A7 = b_line (b(1)+4:b(2)+3);
A7 = str2num(A7);
A8 = b_line (b(2)+4:b(3)+3);
A8 = str2num (A8);
A9 = b_line (b(3)+4:b(4)+3);
A9 = str2num (A9);
A10 = b_line (b(4)+4:b(5)+3);
A10 = str2num (A10);

c_line = fgetl(f1);
c = findstr(c_line, 'E');

A11 = c_line (1:c(1)+3);
A11 = str2num(A11);
A12= c_line(c(1)+4:c(2)+3);
A12= str2num(A12);
A13 =c_line(c(2)+4:c(3)+3) ;
A13= str2num (A13);
A14 =c_line (c(3) +4:c(4)+3);
A14 =str2num (A14);

%Specific heat, Enthalpy, Entropy @ High temparture
T_H = linspace(Low, Mid, 100);
cp = (A1+(A2.*T_H)+(A3.*T_H.^2)+(A4.*T_H.^3)+(A5.*T_H.^4) )*R;
H = (A1+(A2.*T_H/2)+(A3.*(T_H.^2)/3) +(A4.*(T_H.^3)/4)+(A5.*(T_H.^4)/5)+A6.*T_H)*R;
S = (A1*log (T_H)+(A2.*T_H)+(A3.*(T_H.^2)/2)+(A4.*(T_H.^3)/3)+(A5.*(T_H.^4)/4) +A7)*R;

%Specific heat, Enthalpy, Entropy @ Low temparture

T_L = linspace (Mid, High, 100);
cp1 = R* (A8+ (A9.*T_L)+(A10.*T_L.^2)+(A11.*T_L.^3)+(A12.*T_L.^4));
H1 = R*(A8+ (A9.*T_L/2)+(A10.*(T_L.^2)/3)+(A11.*(T_L.^3)/4)+(A12.*(T_L.^4)/5)+A13.*T_L);
S1 = R* (A8*log (T_L)+(A9.*T_L)+(A10.*(T_L.^2)/2)+(A11.*(T_L.^3)/3) +(A12.*(T_L.^4)/4)+A14);

% To create a folder

str = sprintf('/Users/kauturisaikrishna/Desktop/file parsing', 'species');
%mkdir(['/Users/kauturisaikrishna/Desktop/file parsing',species'])
cd(str);

figure(1)
plot(T_H, cp)
hold on
plot(T_L,cp1)
hold off
xlabel('Temparature')
ylabel('Specific heat')
legend('High temparture', 'low Temparature')


figure(2)
plot (T_H,H)
hold on
plot (T_L,H1)
hold off
xlabel('Temparature')
ylabel('Enthalpy')
legend('High temparture', 'low Temparature')

figure(3)
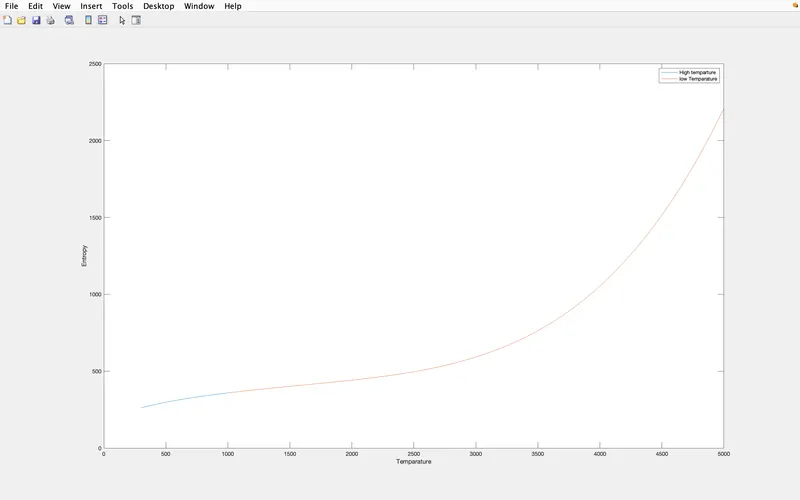
plot (T_H, S)
hold on
plot (T_L, S1)
hold off
xlabel('Temparature')
ylabel('Entropy')
legend('High temparture','low Temparature')

saveas(gcf, 'Specific heat')
saveas(gcf, 'Enthalpy')
saveas(gcf,'Entropy')

atomic_names = ['H', 'C', 'O', 'N', 'Ar'];
    atomic_weights = [1.00784, 12.0107, 15.999, 14.0067, 39.948];
    W=0;

    for i=1:length(species)
        for j=1:length(atomic_names)
            if species(i)==atomic_names(j)
                W=W+atomic_weights(j);
                position = j;
            end
        end
        n=str2num(species(i));
        if n>=1
            W=W+atomic_weights(position)*(n-1);
        end
    end
    fprintf('Molecular weight of %s = %f',species,W)
    disp(' ')
end
EXPLANATION :
Starting with clear all, close all and clc = By using fopen command we are opening the file of THERMO.dat and 'r'repersents to read the file. fgetl: is used to read the line in the file of which we have given and for every fget it will be reading the next line in the,file So the fgeti is used to read the line in the file.
By using the strsplit we are splitting the line with the reference of the space strsplit: Split string or character vector at specified delimiter
Delimiting characters, specified as a character vector, a 1-by-ncell array of character vectors, or a 1-by- string
array, Text specified in detiniter does not appear in the output C.
Specify multiple delimiters in a cell array or a string array. The strsplit function splits str on the elements of delimiter. The order in which delimiters appear in delimiter does not matter unless multiple delimiters begin a match at the same character in str. In that case stesplat splits on the first matching delimiter in otimiter,
Strsplit is used to split the line and it is assigned to the variable A so the A(1) is the species name and for the local_temp we ill be taking from the end.
str2num: Convert character array or string to numeric array and then we have to read the co-efficients which are from the next line and then by using tgeti read the next line and assigned to a variable to assign each value to a variable we used findstr findstr. Find strings within other strings.
We'll be finding the E in the string (line) and by refering that we ill be taking the separate value and assign to c variable as shown. We have to write a formula for low and high temperatures The FIRST 7 coefficients are HIGH-temperatur coefficients and the SECOND 7 coefficients are LOW-temperature coefficients.
Create two strings of atom symbol and the atomic weight as shown
Create a for loop to the length of the species convert the species to number by using stranum command with results species if it is number status will be it is true if it is an letter (element) the status will be 0.By applying if condition status == 0 indfind(elements == species (k)) we are finding the elements in species in the elements array by using find command then the molecular_wt = atomic_weight(ind) else molecular wt(k-1) is it will take the previous position of the species equals to number in the species multiply to the molecular wt(k-1) so that the previous position to the number in the species will be changed and then display the molecular_wt.
results and plots:
MOLECULAR WEIGHTS:
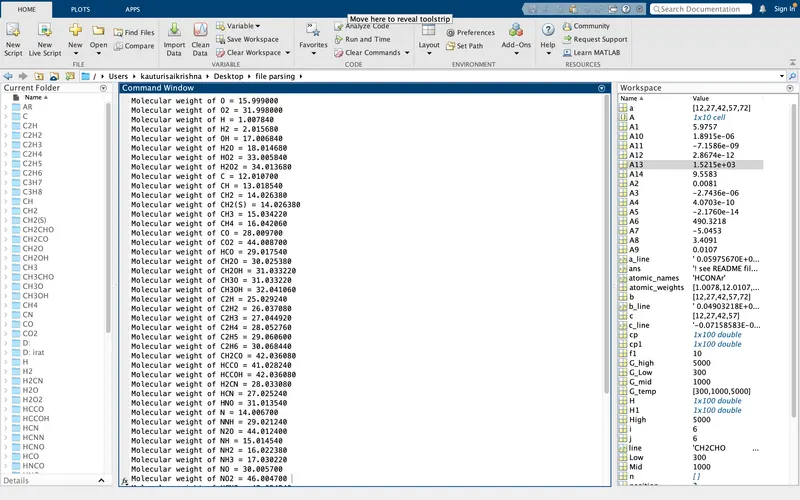
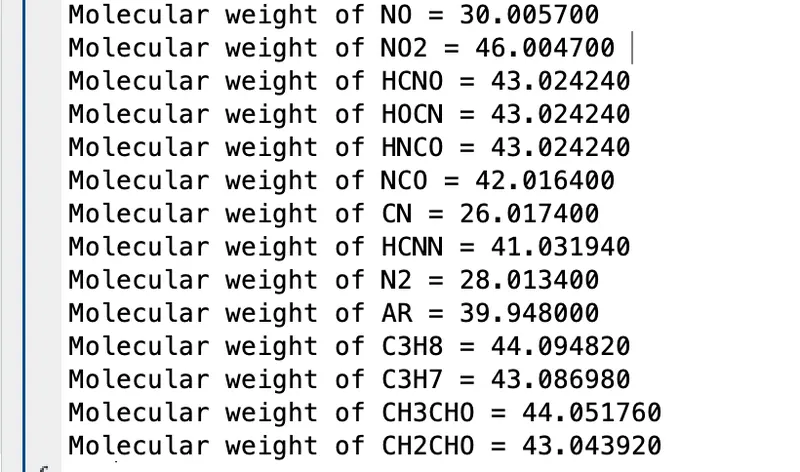
•molecular weight of each species display it in the command window.

• Save the plots as images with appropriate names and dump them in separate folders for each species with
suitable name is done AUTOMATICALLY
Plots for 02 ,N2 and Co2 species
Plots :
Specific heat:
ENTHALPY:
ENTROPY:
CONCLUSION:
Using Octave code, the necessary coefficients required to evaluate various thermodynamic parameters for different species are extracted from NASA thermodynamic data file. The specific heat, entropy & enthalpy for all the species are calculated and plotted against the local temperature range. The molecular weight is calculated for all the species.
Refererences:
https://in.mathworks.com/matlabcentral/answers/497882-parsing-text-files-for-beginners
https://skill-lync.com/student-projects/Parsing-NASA-thermodynamic-data-56600