Project 1 - Parsing NASA thermodynamic data
1. MATLAB CODE - [ FOR PARSING NASA THERMODYNAMIC DATA ]
clear all
close all
clc

f1 = fopen('THERMO.dat','r')

%Skip First Lines

skipline=fgetl(f1)

tline=fgetl(f1)
A=strsplit(tline,' ')
global_low_temp =str2num(A{2})
global_mid_temp =str2num(A{3})
global_high_temp =str2num(A{4})

%Skip Next Three Lines

for i=1:3
    skkipline=fgetl(f1)
end

%Calculate All Species Data

for i=1:53

% Consider Local Temperature
line1 =fgetl(f1)
[name,local_temp] =strtok(line1,'G')
species_name =strtok(name)
temp=strsplit(local_temp)

local_low_temp=str2double(temp{2})
local_mid_temp=str2double(temp{3})
local_high_temp=str2double(temp{4})

% Define Local Temperature Range

T= linspace(local_low_temp,local_high_temp,800)

%Taking Data of Species

tline_1 =fgetl(f1)
tline_2 =fgetl(f1)
tline_3 =fgetl(f1)

a=findstr(tline_1,'E')
b=findstr(tline_2,'E')
c=findstr(tline_3,'E')


% Here A values for High Temperature Coefficient
% Here B values for low Temperature Coefficient

a1=tline_1(1:a(1)+3)
A1=str2num(a1)

a2=tline_1(a(1)+4:a(2)+3)
A2=str2num(a2)

a3=tline_1(a(2)+4:a(3)+3)
A3=str2num(a3)

a4=tline_1(a(3)+4:a(4)+3)
A4=str2num(a4)

a5=tline_1(a(4)+4:a(5)+3)
A5=str2num(a5)

%

b1=tline_2(1:b(1)+3)
A6=str2num(b1)

b2=tline_2(b(1)+4:b(2)+3)
A7=str2num(b2)

b3=tline_2(b(2)+4:b(3)+3)
B1=str2num(b3)

b4=tline_2(b(3)+4:b(4)+3)
B2=str2num(b4)

b5=tline_2(b(4)+4:b(5)+3)
B3=str2num(b5)

%
c1=tline_3(1:c(1)+3)
B4=str2num(c1)

c2=tline_3(c(1)+4:c(2)+3)
B5=str2num(c2)

c3=tline_3(c(2)+4:c(3)+3)
B6=str2num(c3)

c4=tline_3(c(3)+4:c(4)+3)
B7=str2num(c4)

% Defining Universal Gas Constant

R=8.3145

%Calculate Specific Heat

Cp=specific_heat(A1,A2,A3,A4,A5,B1,B2,B3,B4,B5,R,T,local_mid_temp)

%Calculate Enthalpy

H=enthalpy(A1,A2,A3,A4,A5,A6,B1,B2,B3,B4,B5,B6,R,T,local_mid_temp)

%Calculate Entropy

S=entropy(A1,A2,A3,A4,A5,A7,B1,B2,B3,B4,B5,B7,R,T,local_mid_temp)


%Calculate Molecular Weight
atoms= ['H','C','O','N','R','S']
atomic_weight= [1 12 16 14 40 32 ]
MW=0
for i=1:length(species_name)
   for j=1:length(atoms)
       if strcmp(species_name(i),atoms(j))
           MW=MW+atomic_weight(j);
           dt=j;
       end
   end
n=str2double(species_name(i))

if n>1
       MW=MW+(atomic_weight(dt).*(n-1));
end
end
fprintf('Molecular Weight Of %s:%f',species_name,MW)
disp(' ')

%Creating File Directory To Save Plots

mkdir(species_name)
cd(species_name)

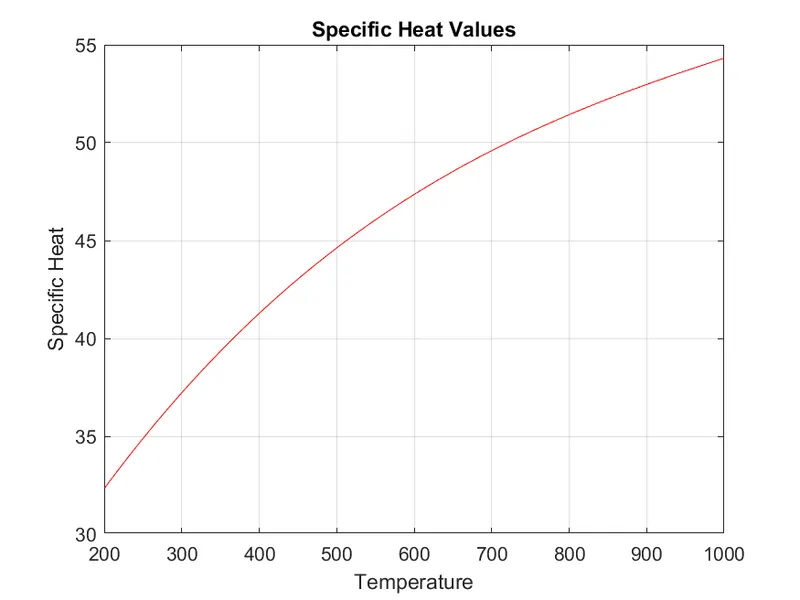
%Plot For Specific Heat
plot(T,Cp,'Color','r')
title('Specific Heat Values')
grid on
xlabel('Temperature')
ylabel('Specific Heat')
saveas(gcf,'Temperature vs Specific Heat.png')

%Plot For Enthalpy
plot(T,H,'Color','r')
title('Enthalpy Values')
grid on
xlabel('Temperature')
ylabel('Enthalpy')
saveas(gcf,'Temperature vs Enthalpy.png')

%Plot For Entropy
plot(T,S,'Color','r')
title('Entropy Values')
grid on
xlabel('Temperature')
ylabel('Entropy')
saveas(gcf,'Temperature vs Entropy.png')
cd(pwd)
cd ..
end
2. FUNCTION CODE FOR SPECIFIC HEAT
%Function Program for Specific Heat

function [Cp] =specific_heat(A1,A2,A3,A4,A5,B1,B2,B3,B4,B5,R,T,local_mid_temp)

if T>local_mid_temp
    Cp=(A1+(A2*T)+(A3*(T.^2))+(A4*(T.^3))+(A5*(T.^4))).*R
else
    Cp=(B1+(B2*T)+(B3*(T.^2))+(B4*(T.^3))+(B5*(T.^4))).*R
end
end
3. FUNCTION CODE FOR ENTHALPY
%Function Program for Enthalpy

function [H] =enthalpy(A1,A2,A3,A4,A5,A6,B1,B2,B3,B4,B5,B6,R,T,local_mid_temp)

if T>local_mid_temp
    H=R.*T.*(A1+(A2.*T)./2+(A3.*T.^2)./3+(A4.*T.^3)./4+(A5.*T.^4)./5+A6./T);
else
    H=R.*T.*(B1+(B2.*T)./2+(B3.*T.^2)./3+(B4.*T.^3)./4+(B5.*T.^4)./5+B6./T);
end
end
3. FUNCTION CODE FOR ENTROPY
%Function Program for Entropy

function [S] =entropy(A1,A2,A3,A4,A5,A7,B1,B2,B3,B4,B5,B7,R,T,local_mid_temp)

if T>local_mid_temp
    S = R.*(A1.*log(T)+A2.*T+(A3.*T.^2)./2+ (A4.*T.^3)./3+(A5.*T.^4)./4+A7)
else
    S = R.*(B1.*log(T)+B2.*T+(B3.*T.^2)./2+ (B4.*T.^3)./3+(B5.*T.^4)./4+B7)
end
end
4.FOLDER IMAGE OF EACH SPECIES

5. PLOTS OF O2
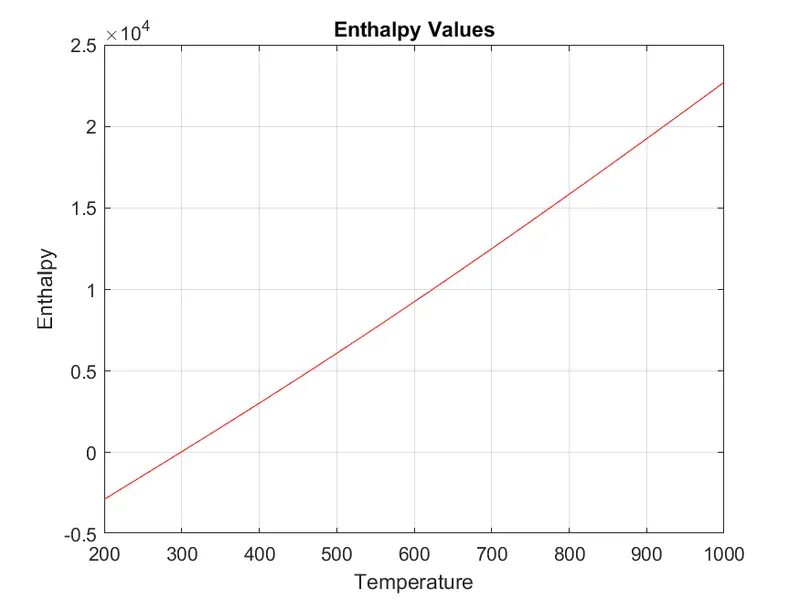
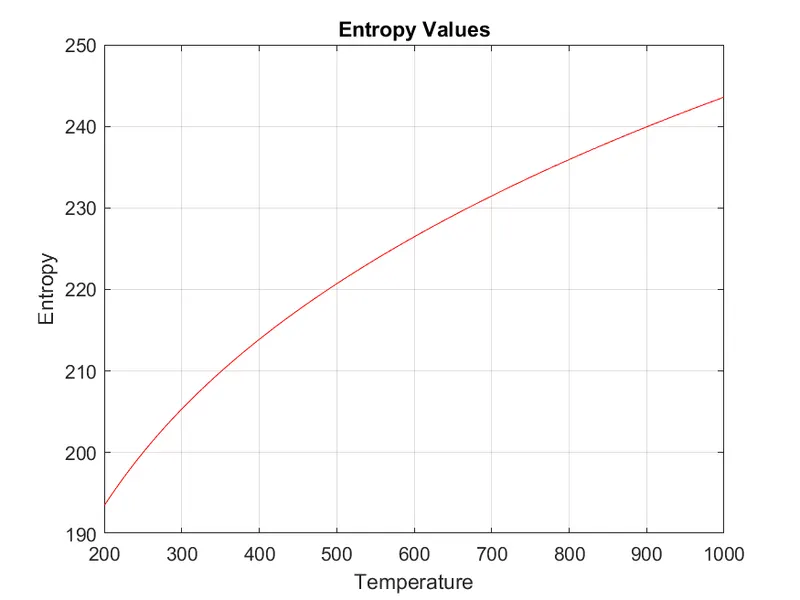
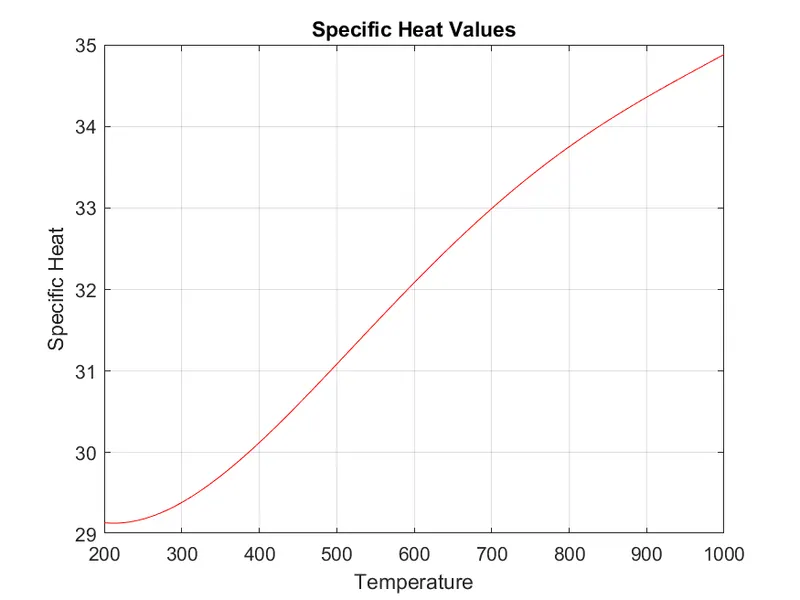
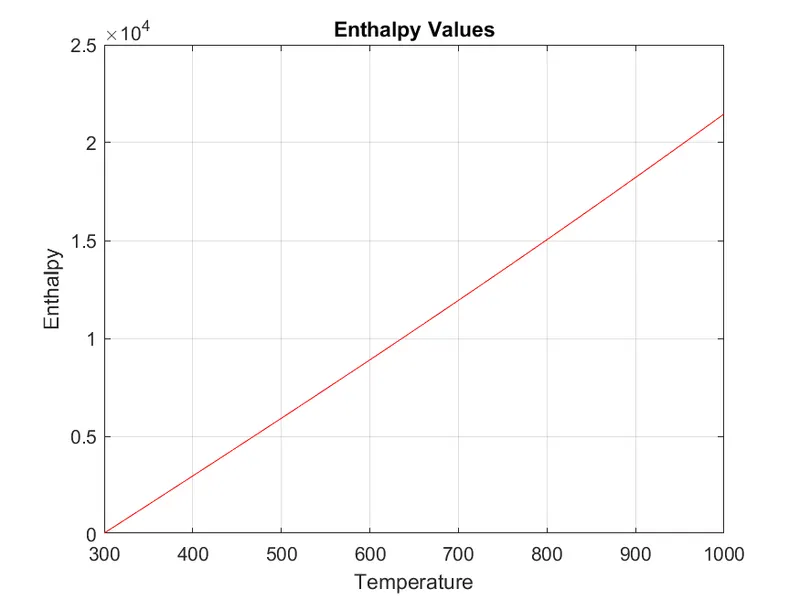
6. PLOTS OF N2
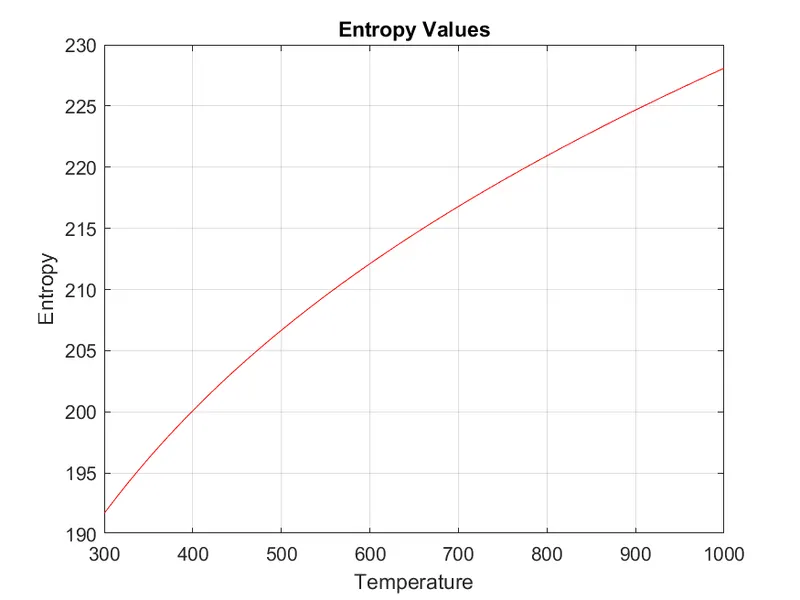
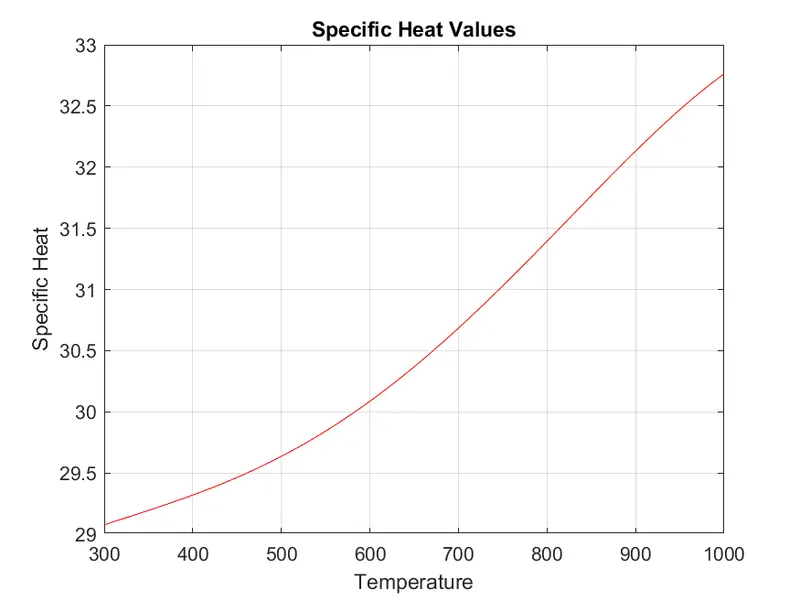
7. PLOTS OF CO2
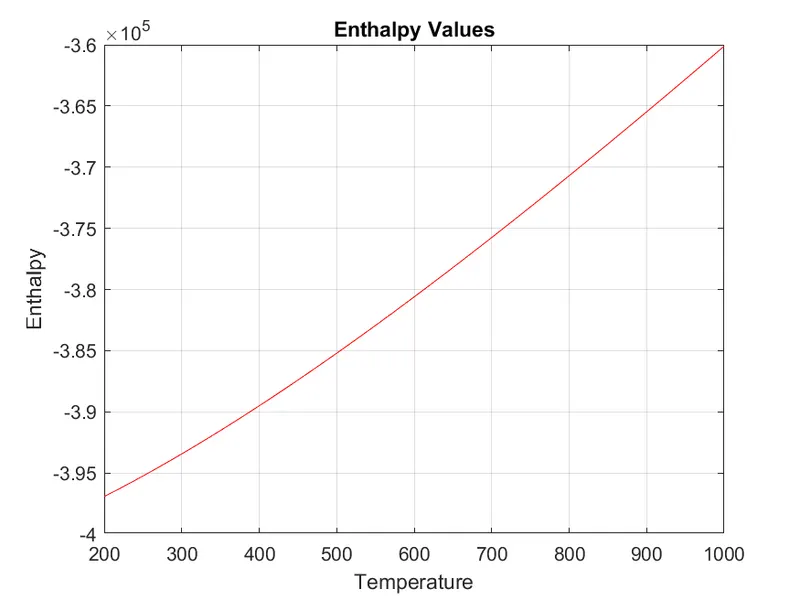
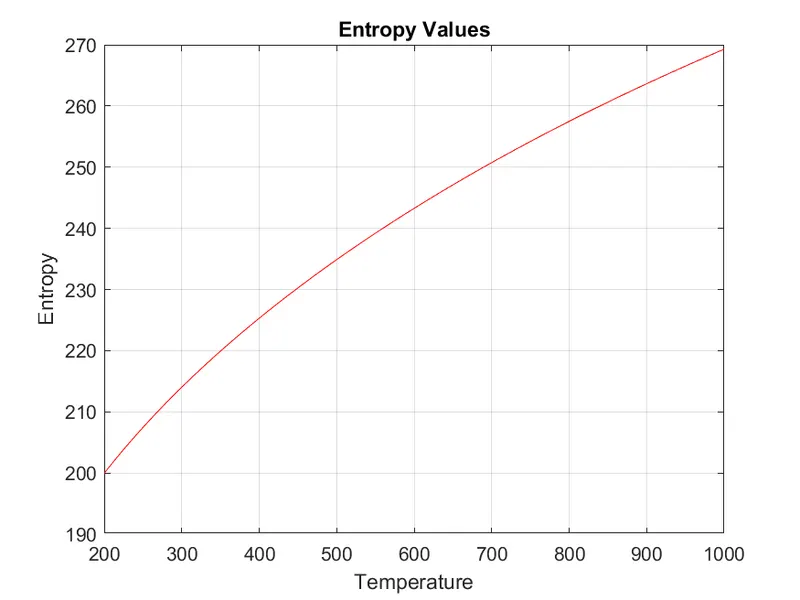
8. MATLAB CODE EXPLAINATION
clear all
close all
clc
f1 = fopen('THERMO.dat','r') Explaination - First we read the file named "THERMO.dat"
%Skip First Lines
skipline=fgetl(f1) Explaination - First we skip the first line
tline=fgetl(f1) Explaination - Call global temperatures from data file
A=strsplit(tline,' ') Explaination - Create cell string of global temperatures
global_low_temp =str2num(A{2}) Explaination - Create array string of global temperatures into number
global_mid_temp =str2num(A{3})
global_high_temp =str2num(A{4})
%Skip Next Three Lines Explanation - we skip the comment lines from data file provided
for i=1:3
skkipline=fgetl(f1)
end
%Calculate All Species Data Explanation - Collecting all species data through looping
for i=1:53
% Consider Local Temperature Explanation - Use of Local Temperature values for species to calculate temperature difference
line1 =fgetl(f1)
[name,local_temp] =strtok(line1,'G')
species_name =strtok(name)
temp=strsplit(local_temp)
local_low_temp=str2double(temp{2})
local_mid_temp=str2double(temp{3})
local_high_temp=str2double(temp{4})
% Define Local Temperature Range
T= linspace(local_low_temp,local_high_temp,800) Explanation - Define local temperature limits
%Taking Data of Species
tline_1 =fgetl(f1) Explanation - Use variables of species for calculation of coefficients
tline_2 =fgetl(f1)
tline_3 =fgetl(f1)
a=findstr(tline_1,'E')
b=findstr(tline_2,'E')
c=findstr(tline_3,'E')
% Here A values for High-Temperature Coefficient
% Here B values for low-Temperature Coefficient
a1=tline_1(1:a(1)+3)
A1=str2num(a1)
a2=tline_1(a(1)+4:a(2)+3)
A2=str2num(a2)
a3=tline_1(a(2)+4:a(3)+3)
A3=str2num(a3)
a4=tline_1(a(3)+4:a(4)+3)
A4=str2num(a4)
a5=tline_1(a(4)+4:a(5)+3)
A5=str2num(a5)
b1=tline_2(1:b(1)+3)
A6=str2num(b1)
b2=tline_2(b(1)+4:b(2)+3)
A7=str2num(b2)
b3=tline_2(b(2)+4:b(3)+3)
B1=str2num(b3)
b4=tline_2(b(3)+4:b(4)+3)
B2=str2num(b4)
b5=tline_2(b(4)+4:b(5)+3)
B3=str2num(b5)
c1=tline_3(1:c(1)+3)
B4=str2num(c1)
c2=tline_3(c(1)+4:c(2)+3)
B5=str2num(c2)
c3=tline_3(c(2)+4:c(3)+3)
B6=str2num(c3)
c4=tline_3(c(3)+4:c(4)+3)
B7=str2num(c4)
% Defining Universal Gas Constant
R=8.3145
%Calculate Specific Heat With help of Functions
Cp=specific_heat(A1,A2,A3,A4,A5,B1,B2,B3,B4,B5,R,T,local_mid_temp)
%Calculate Enthalpy With help of Functions
H=enthalpy(A1,A2,A3,A4,A5,A6,B1,B2,B3,B4,B5,B6,R,T,local_mid_temp)
%Calculate Entropy With help of Functions
S=entropy(A1,A2,A3,A4,A5,A7,B1,B2,B3,B4,B5,B7,R,T,local_mid_temp)
%Calculate Molecular Weight
atoms= ['H','C','O','N','R','S']
atomic_weight= [1 12 16 14 40 32 ]
MW=0
for i=1:length(species_name)
for j=1:length(atoms)
if strcmp(species_name(i),atoms(j))
MW=MW+atomic_weight(j);
dt=j;
end
end
n=str2double(species_name(i))
if n>1
MW=MW+(atomic_weight(dt).*(n-1));
end
end
fprintf('Molecular Weight Of %s:%f',species_name,MW)
disp(' ')
%Creating File Directory To Save Plots
mkdir(species_name)
cd(species_name)
%Plot For Specific Heat
plot(T,Cp,'Color','r')
title('Specific Heat Values')
grid on
xlabel('Temperature')
ylabel('Specific Heat')
saveas(gcf,'Temperature vs Specific Heat.png')
%Plot For Enthalpy
plot(T,H,'Color','r')
title('Enthalpy Values')
grid on
xlabel('Temperature')
ylabel('Enthalpy')
saveas(gcf,'Temperature vs Enthalpy.png')
%Plot For Entropy
plot(T,S,'Color','r')
title('Entropy Values')
grid on
xlabel('Temperature')
ylabel('Entropy')
saveas(gcf,'Temperature vs Entropy.png')
cd(pwd)
cd ..
end