Project 1 - Parsing NASA thermodynamic data
Function Program (Thermal Properties) :
% Defining the function
function [cp, h, s] = coeff_properties_func(a1,a2,a3,a4,a5,a6,a7,a8,a9,a10,a11,a12,a13,a14,T)
R = 8.314;
for i = 1:lenght(T)
    if T(i) < 300
        cp = (a1+a2.*T+a3.*T.^2+a4.T.^3+a5.*T.^4).*R;
        h = (a1+(a2.*T)./2+(a3.*T.^2)./3+(a4.*T.^3)./4+(a5.*T.^4)./5+(a6./T)).*R.*T;
        s = (a1.*log(T)+a2.*T+(a3.*T.^2)./2+(a4.*T.^3)./3+(a5.*T.^4)./4+a7).*R;
    else
        cp = (a8+a9.*T+a10.*T.^2+a11.*T.^3+a12.*T.^4).*R;
        h = (a8+(a9.*T)./2+(a10.*T.^2)./3+(a11.*T.^3)./4+(a12.*T.^4)./5+(a13./T)).*R.*T;
        s = (a8.*log(T)+a9.*T+(a10.*T.^2)./2+(a11.*T.^3)./3+(a12.T.^4)./4+a14).*R;
    end
end
end
Function Program (Molecular weight) :
% Defining the function
function [molecular_weight] = mol_wei_func(name_of_species)
SPECIES = upper(name_of_species);
constituents = {'H', 'C', 'N', 'O', 'A', 'S'};
atomic_weight = [1 12 14 16 40 32];

molecular_weight = 0;
for i = 1:length(SPECIES)
    for j = 1:length(constituents)
        if strcmp(SPECIES(i),constituents(j))
            molecular_weight = molecular_weight+atomic_weight(j);
            u = j;
        end
    end
    n = str2double(SPECIES(i));
    if n > 1
        molecular_weight = molecular_weight+atomic_weight(u)*(n-1);
    end
end
fprintf('molecular|_weight of %s: ',name_of_species);
fprintf('%d',molecular_weight);
fprintf(' ');
fprintf('amu');
end
Main Program :
% opening the file to read
f1 = fopen('THERMO.dat','r');

% Header of the file
Header = fgetl(f1);

% Global temperature value
global_temp_line = fgetl(f1);
a1 = strsplit(global_temp_line,' ');
global_low_temp = str2double(a1{2});
global_mid_temp = str2double(a1{3});
global_high_temp = str2double(a1{4});

% Comments in the data file
comment_1 = fgetl(f1);
comment_2 = fgetl(f1);
comment_3 = fgetl(f1);

% Extracting coefficients
for i = 1:53
    line = fgetl(f1);
    species = strsplit(line,' ');
    A = species(1);
    name_of_species = char(A);

%     Local temperature values
Local_temp_line = strsplit(line,'G');
% Extracting from first line
line1 = fgetl(f1);
l1 = strfind(line1,'E');
a1 = str2double(line1(1:(l1(1)+3)));
a2 = str2double(line((l1(1)+4):(l1(2)+3)));
a3 = str2double(line((l1(2)+4):(l1(3)+3)));
a4 = str2double(line1((l1(3)+4):(l1(4)+3)));
a5 = str2double(line((l1(4)+4):(l1(5)+3)));

% Extracting from second line
line2 = fgetl(f1);
l2 = strfind(line2,'E');
a6 = str2double(line2(1:(l2(1)+3)));
a7 = str2double(line2((l2(1)+4):(l2(2)+3)));
a8 = str2double(line2((l2(2)+4):(l2(3)+3)));
a9 = str2double(line2((l2(3)+4):(l2(4)+3)));
a10 = str2double(line2((l2(4)+4):(l2(5)+3)));

% Extracting from thrid line
line3 = fgetl(f1);
l3 = strfind(line3, 'E');
a11 = str2double(line3(1:(l3(1)+3)));
a12 = str2double(line3((l3(1)+4):(l3(2)+3)));
a13 = str2double(line3((l3(2)+4):(l3(3)+3)));
a14 = str2double(line3((l3(3)+4):(l3(4)+3)));

% Creating file to store all the plots for each species
Directory = mkdir(['D:MATLAB_PROGRAMMS NASA_FILES',name_of_species]);
% Creating array of temperature
T = linspace(global_low_temp,global_high_temp,500);

% For calculating thermodynamic function
[cp, h, s] = coeff_properties_func(a1,a2,a3,a4,a5,a6,a7,a8,a9,a10,a11,a12,a13,a14,T);

% Plotting between tem and spec_heat
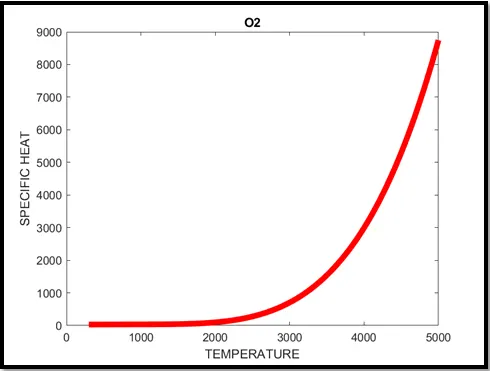
figure(1)
plot(T,cp,'linewidth',5,'color','r');
title(name_of_species);
xlabel('TEMPERATURE');
ylabel('SPECIFIC HEAT');

% Plottig between temp and enthalpy
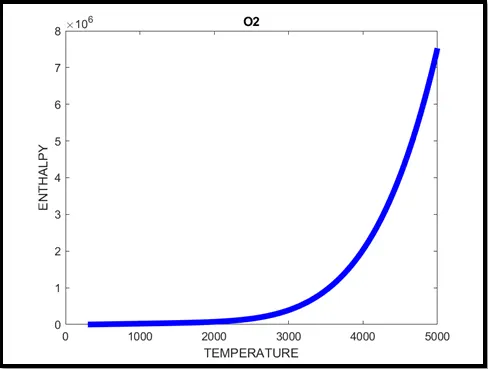
figure(2)
plot(T,h,'linewidth',5,'color','b');
title(name_of_species);
xlabel('TEMPERATURE');
ylabel('ENTHALPY');

% plotting between temp and entropy
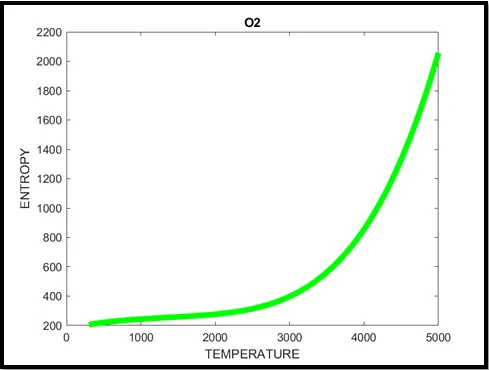
figure(3)
plot(T,s,'linewidth',5,'color','g');
title(name_of_species);
xlabel('TEMPERATURE');
ylabel('ENTROPY');

cd(['D:MATLAB_PROGRAMMS NASA_FILES',name_of_species]);

% Saving the plots
saveas(1,'specific heat.png');
saveas(2,'enthalpy.png');
saveas(3,'entropy.png');

% Changing the directory for calculating molecular weight
cd('D:MATLAB_PROGRAMMS NASA_FILES',name_of_species);
[molecular_mass] = mol_wei_func(name_of_species);
end
fclose(f1)
Output values :
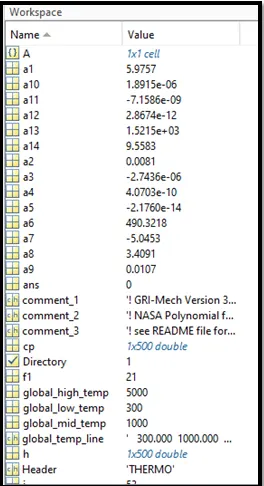
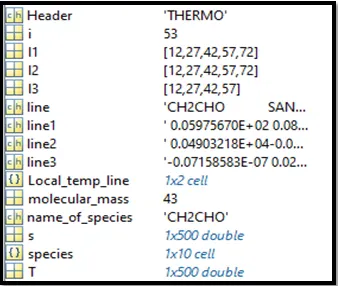
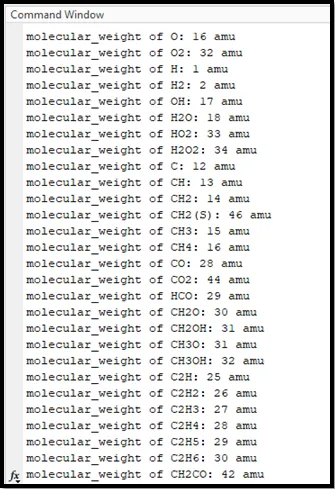
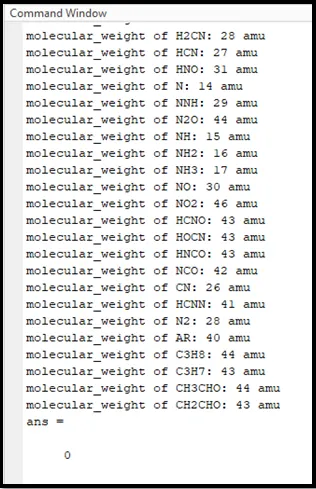
Molecular weights of Species:
Plot for 02:
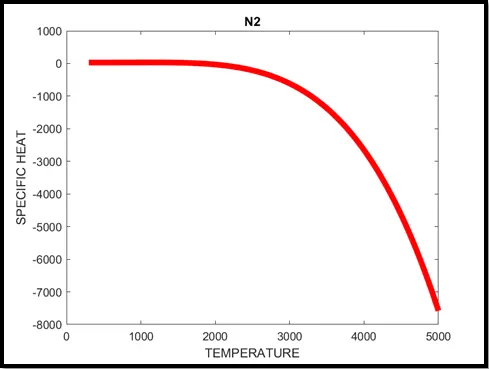
Plot for N2 :