Project-1: Modelling an electric Car with Li-ion battery
INTRODUCTION
An electric vehicle (EV) is a vehicle that uses one or more electric motors for propulsion. EVs first came into existence in the mid-19th century, when electricity was among the preferred methods for motor vehicle propulsion, providing a level of comfort and ease of operation that could not be achieved by the gasoline cars of the time. Internal combustion engines were the dominant propulsion method for cars and trucks for about 100 years.
Due to technology advancements and a greater focus on renewable energy and the possible decrease of transportation's influence on climate change, air pollution, and other environmental challenges in the 21st century, EVs have experienced a boom in demand side and hence in production also. Electric vehicles are one of the 100 best current ideas for combating climate change, according to Project Drawdown.
OBJECTIVES
The main objectives includes
- To design and model the EV.
- To design the controller.
- To match the performance of vehicle with desired performance.
- To model the EV considering the cost.
METHODOLOGY
To design the e-rickshaw following steps are to be followed
- Estimate the total load and kerb load acting on the vehicle.
- Estimate the environmental factors affecting the vehicle.
- Calculate the total load/force acting on the vehicle.
- Selection of motor.
- Battery selection.
- Power controller designing.
- Modelling of e-vehicle in Simulink.
- Performance of e-vehicle is evaluated through simulation.
- Configuration of model if required.
The project can be sectionized into three parts designing, modelling and simulation results. At the end of designing section all the data required for modelling will be availabale. And at the end of modelling section a complete virtual model of the vehicle will be made, In simulation section the vehicle performance is being evaluated and if any neccessary the model is configured and run again.
DESIGNING
1. Estimating the total physical parameters of vehicle
In this a rough vehicle model is made to know about the load and kerb weight.
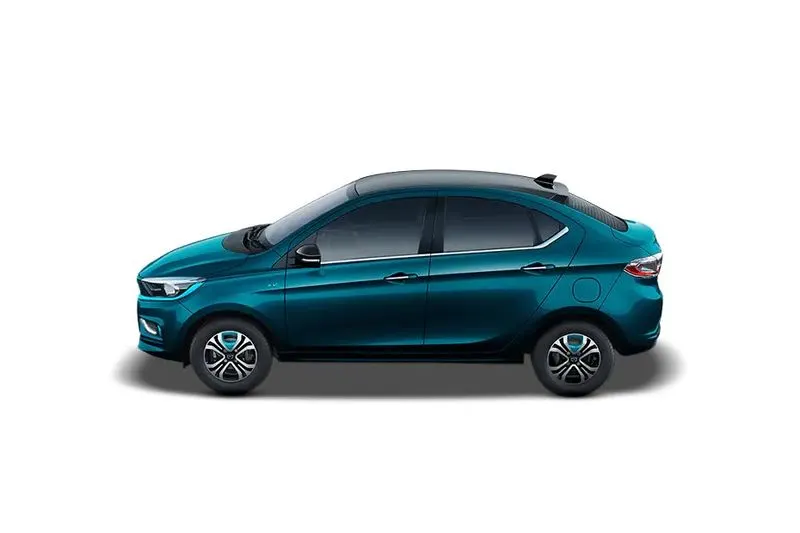
The battery is located under the boot of the vehicle and in middle. Hence the center of gravity lies low and near to the center, which helps in better riding comfort and stablity of the vehicle.
The physical parameters of the vehicle are
- Kerb weight 1000 kg
- Max passenger 4 nos.
- Max payload 350kg.
- Distance between front axle and CG = 1600mm
- Distance between rear axle and CG = 1400mm
| Sl no. | Parameter | Value |
| 1 | Coefficient of drag, `C_d` | 0.290 |
| 2 | Frontal Area, `A_f` | 2.240 |
| 3 | Coefficient of rolling friction, `C_R` | 0.010 |
| 4 | Air Density | 1.225 |
With these datas, the power required by the axle to support the vehicle motion is given from the vehicle power calculator.
a. Vehicle with max payload at 0 gradeability
In this condition, as a standard test the vehicle acquire speed of 60kmph in 10s from rest. Also taken gradeability to be zero.
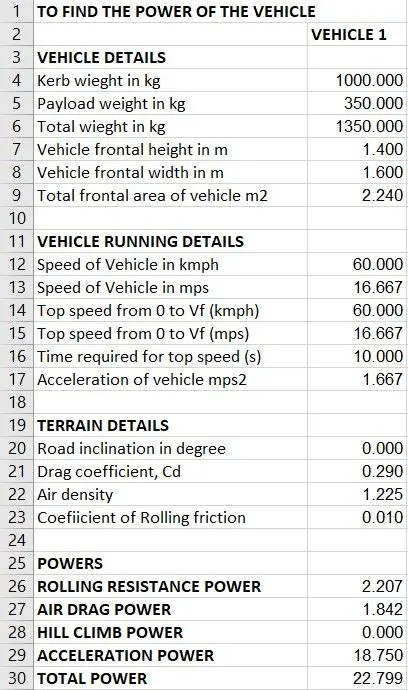
With this condition the vehicle requires 22.8kW power to run in this condition. If we keep all other parameters same and increasing the gradeability the power required will be increasing.
If we keep high rated motor the battery capacity also needs to be increased which will effect the cost of the vehicle, so an optimum power rating is taken to keep the cost, size and weight optimum.
b. Vehicle with max payload and grading of road is 10
The commercial vehicles are used in everywhere so it need to overcome the different terrains it includes offroad, grading of road, etc. Considering this the vehicle power is calculated for 10 deg garde and with a speed of 60kmph, also the acceleration is given as 60kmph in 40sec. The vehicle power required at this time will be the max power required.
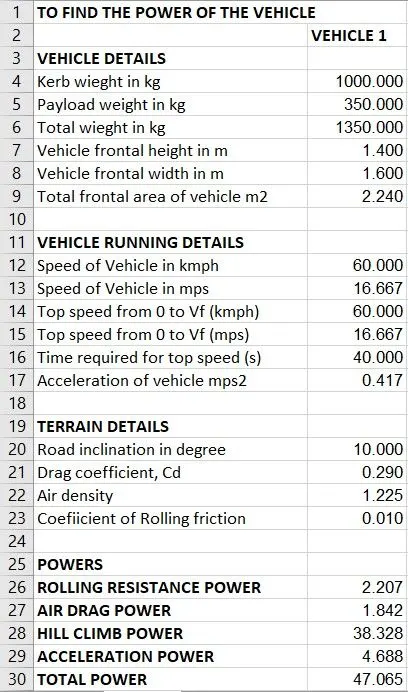
In this case the vehicle requires a power of 47kW, but selecting a motor for 47kW will be high power consuming, increased weight and size and hence cost. So the vehicle max power required is optimised to 35-40kW.
2. Selection of motor
From the above optimal constrain we keep the rated power of motor to be 35kW. With this 35kW motor engine its possible to take full payload at a speed of 60kmph in 10s. Which is a good performance.
The motor for this project is a 35kW PMDC motor, the motor parameters are given as
| Parameter | |
| Type | PMDC |
| Voltage (V) | 48 V |
| Rated Speed (RPM) | 3000 |
| Rated Torque (Nm) | 54 |
| Rated Power (kW) | 35 |
| Max. Rated Power (W) | 40 |
| Efficiency | >83% |
| No. of Poles | 8 |
| Insulation Class | Class B |
3. Selection of Battery
The battery is selected based on the hours of operation required. Most of the vehicles does not runs at rated power, based on the simulation result for a range of 150 km a 30kWh battery is required.
The battery parameter are selected as
| Parameter | |
| Type | Li-ion |
| Capacity | 30kWh |
| Nominal Voltage (V) | 320 |
| Ampere-hour (Ah) | 93.75 |
| Cycle life | >2000 |
4. Controller designing
The controller is required to drive the motor taking power from the battery. A motor controller is a device or group of devices that can coordinate in a predetermined manner the performance of an electric motor. A motor controller might include a manual or automatic means for starting and stopping the motor, selecting forward or reverse rotation, selecting and regulating the speed, regulating or limiting the torque, and protecting against overloads and electrical faults. Motor controllers may use electromechanical switching, or may use power electronics devices to regulate the speed and direction of a motor.
In EV the motor controller is a micro-controller based controller. The MCU consist of
- Microcontroller
- Micro processor
- PWM generator
- ADC
- Tx/Rx
- DC-DC converter (H-bridge)
- Feedback loop
H-bridge
An H-bridge is an electronic circuit that switches the polarity of a voltage applied to a load. These circuits are often used in robotics and other applications to allow DC motors to run forwards or backwards.
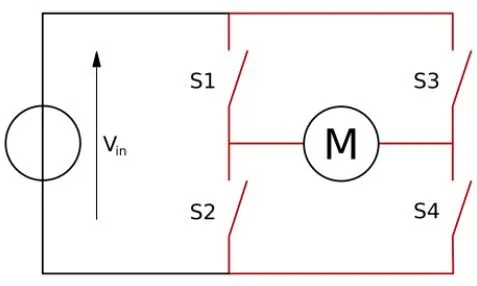
The H-bridge arrangement is generally used to reverse the polarity/direction of the motor, but can also be used to 'brake' the motor, where the motor comes to a sudden stop, as the motor's terminals are shorted, or to let the motor 'free run' to a stop, as the motor is effectively disconnected from the circuit.
The PWM signals helps in controlling the ON and OFF of the SC switches. By controlling the switches H-Bridge can control the output voltage and current flow direction, so it can act as a DC-DC bidirectional converter.
The microprocessor process the inputs to generate the PWM signals, these PWM signals controlls the DC-DC converter to control the voltage, current or power output. A feedback circuit is given from output DC to controller input to make the output stable, which is achieved by a PID controller inside the microcontroller.
MODELLING
A neat model has to be build incorporating the above design value. An e-rickshaw model has made in MATLAB Simulink as shown below
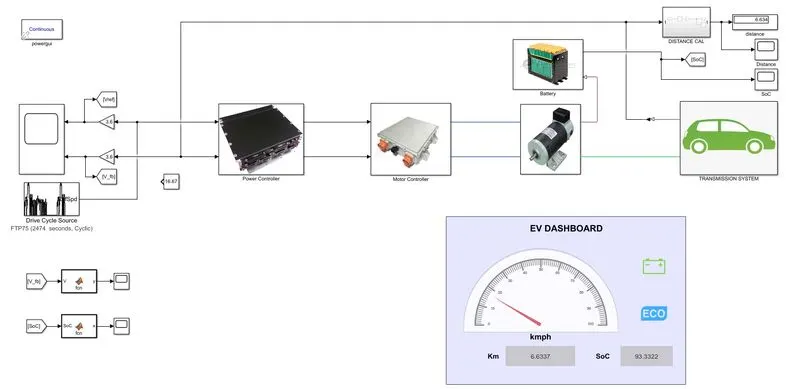
The model consist of
- Drive Cycle - a cycle representing speed v/s time plot, which act as the driver input command.
- Speed Governor - The speed governor helps in maintaining the speed under 25kmph as per rule.
- Longitudnal Driver - these block is a micro-controller block, it intakes the command and process the output whether acceleration or decceleration required, it uses PID controller to process the output.
- Motor controller - motor controller is an essential part, as it controlls the motor input power based on the command signal from longitudnal driver.
- Motor unit - It consist of the driving motor/engine.
- Battery - Consist of the battery for powering the engine and auxillary parts.
- Transmission system - These block represent the physiscal model of the e-rickshaw.
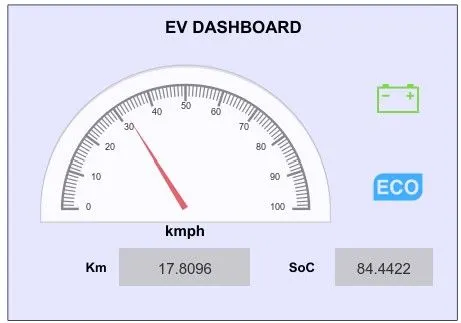
- Dashboard - It shows the real time speed, distance covered, SoC of battery, driving mode and overheat indicators.
a. Modelling of transmission system
In this the rickshaw physical parameters are modelled including the environmental fastors like wind speed, gradeability, rolling resistance etc.
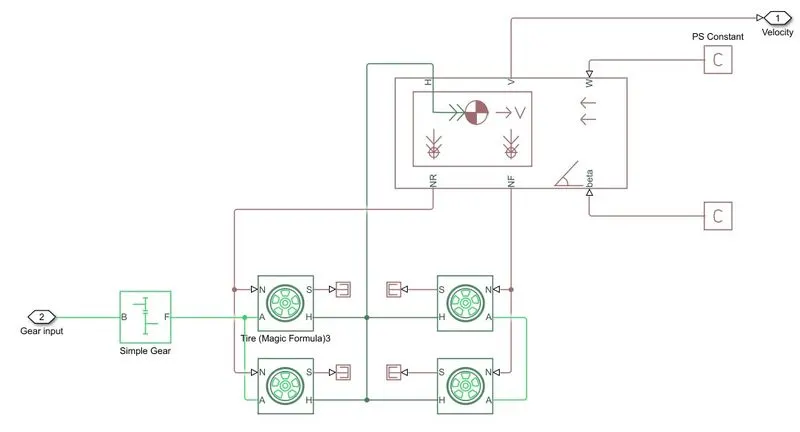
The vehicle is rear axle drive, so the gear is connected to the rear axle/wheel.
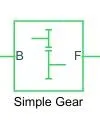
- Simple gear NF/NB = 5
Tire is modelled using the block 'Tire magic formula', in that the parameter entered are
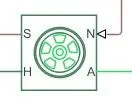
- Main
- Rated vertical load = 3000 N
- Peak longitudnal force at rated load = 3500 N
- Slip at peak force at rated load = 10 %
- Geometry
- Rolling radius = 0.3m
- Rolling resistance
- Constant coefficient = 0.014
The vehicle parameters and enivironmental factors are added in the 'vehicle body' block.
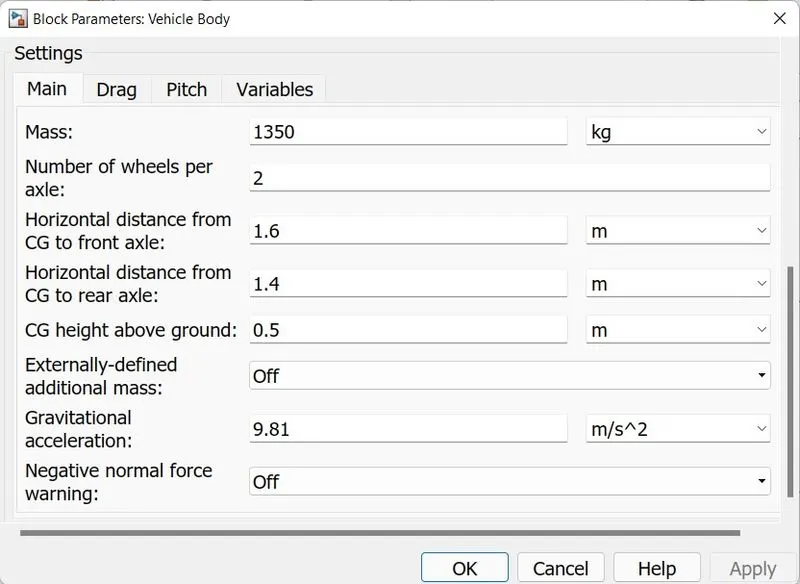
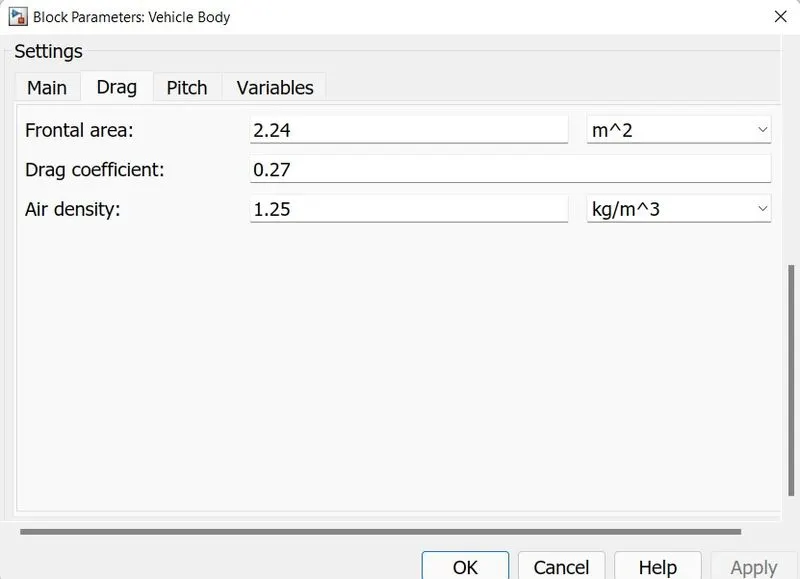
The wind velocity and grade of road is added externally. The final velocity of the vehicle is obtained from the block.
b. Modelling of Motor
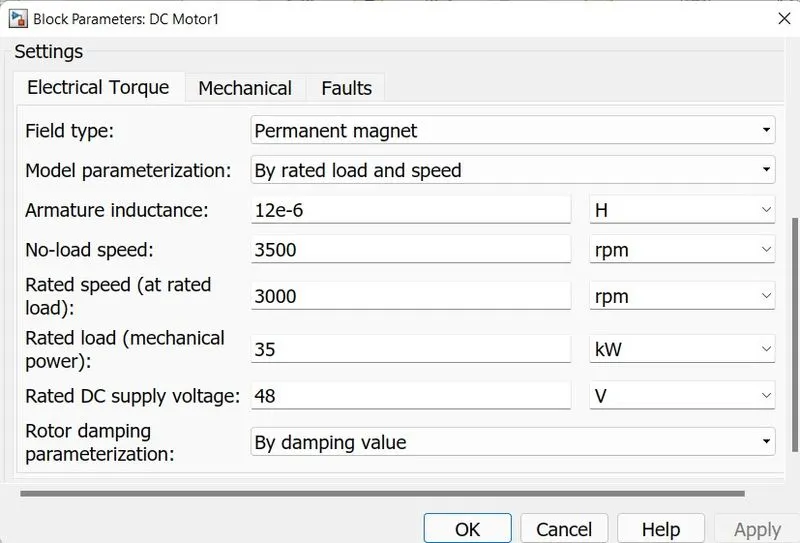
The motor is modelled by a 'DC motor' block. It consist of two parts electrical and mechanical part. The electrical part is connected to the output of the Motor control unit and mechanical part is connected to the rear axle via gear.
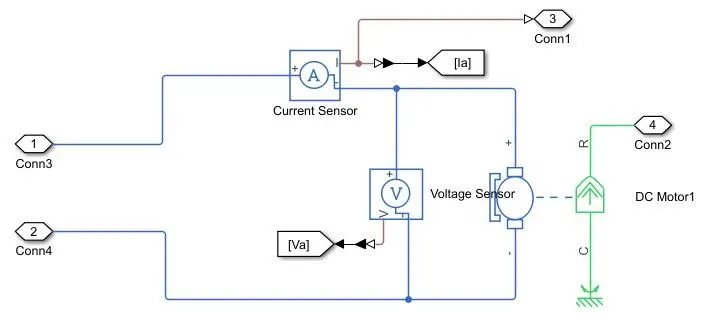
The designed rating of motor has discussed earlier, with the same rated parameters the DC motor is modelled.
Powertrain blockset used in this MCU subsytem are
- DC Motor
- Voltage Sensor
- Current Sensor
c. Modelling Battery
Battery is the main source of the power for the EV, so earlier we designed the battery required for the e-rickshaw. The battery pack includes a battery and a SoC estimater.
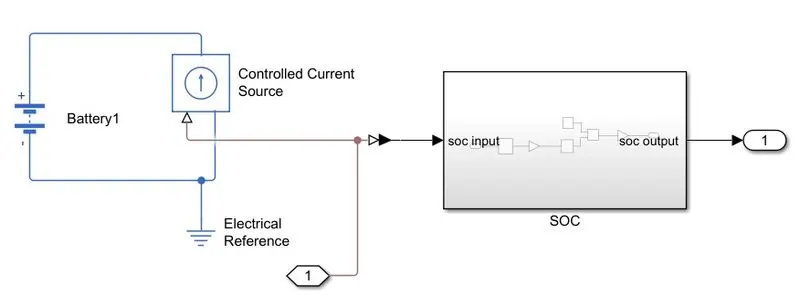
The battery parameters include
- Nominal voltage: 96V
- Ampere-hour rating: 50Ah
d. Modelling of MCU (Motor Control Unit)
MCU is the most important part of EV which connects Battery and Motor. The amount of power given to motor is determined by the controlling signals from the Longitudnal driver controller.
Modelling of MCU include as a bidirectional DC-DC converter (H-Bridge), which helps in transferring power from battery to motor while accelerating and motor to battery while deccelerating.
The H-Bridge works based on PWM signals, the PWM signals are generated by the PWM generator based on the control signal from the longitudnal driver controller.
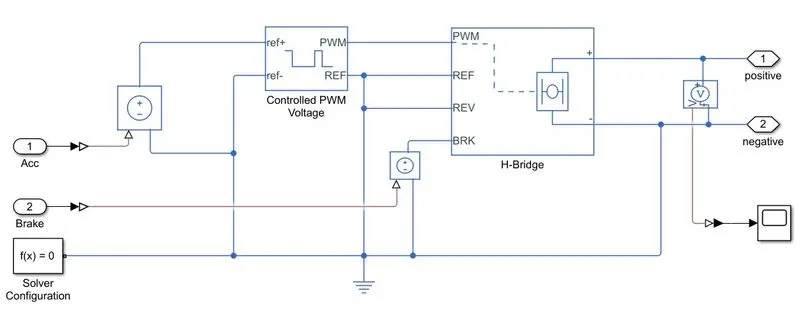
The Controlled PWM voltage produces PWM signals for the switches in H-Bridge. The parameters selected for the PWM generator are
- Frequency - 10kHz
- Input scaling
- 0% duty cycle = 0V
- 100% duty cycle = 2V
- Output voltage amplitude = 5V
The H-Bridge act as a DC-DC converter the input DC power from battery source is converted to DC power with variable voltage and current based on the control signals.
e. Modelling of Power Controller Unit (PCU)
The PCU is the main controlling unit of the vehicle, it determines the working of MCU. The controlling signals are generated based on the vehicle feedback and driver's input. By comparing both the inputs the control signals are generated from the PCU to MCU.
The type of controller used here is a PI controller. The model of PCU is
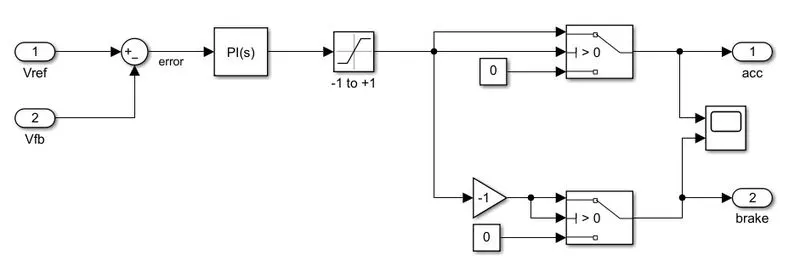
Working of model
- The reference velocity (Vref) and feedback velocity (Vfb) are the inputs of the controller.
- The error is calculated by the sum block. If the Vref > Vfb, the error is positive and if Vref<Vfb, the error is negative.
- The error signal is then pass to PI controller for disturbace rejection, regulation and command tracking. The output of PI varies based on the level of error, if error is high it create a signal at high amplitude.
- The error signal is passed to saturation block. The block saturates all signal above +1 and below -1. So the output signal lies between -1 and +1.
- As the +ve error signals are used when vehicle needs acceleration and -ve signal when vehicle needs decceleration. To seperate both signals a switch with threshold voltage 0V is selected. When the error signal is positive the acceleration control signal is same as that of signal and brake control signal will be zero and vice-versa.
The P and I gain values of PI controller is need to design, so the error signals are fast settled and response of the system is faster. For this in PI controller block, PI tuning is available. The following steps will allow you to tune the PI.
- First connect the input reference velocity to a constant velocity source (eg. 60kmph as in this model), otherwise linearisation of the system is not possible.
- Select PID controller from library.
- Open the block
-
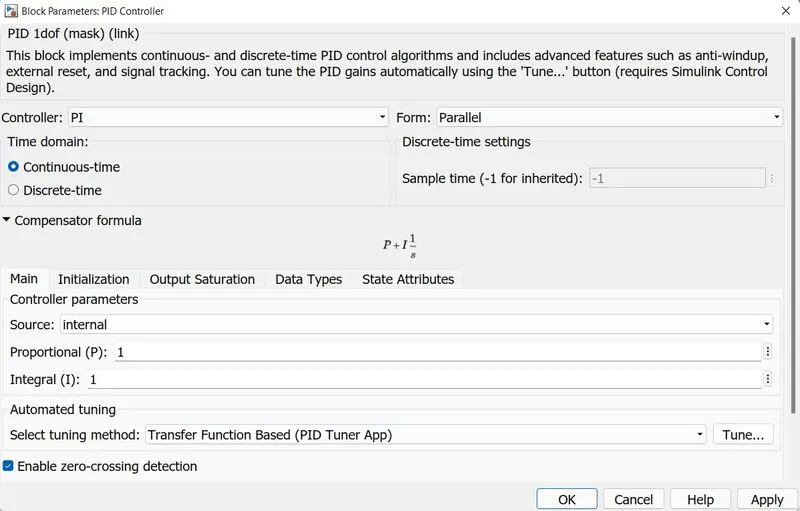
- Select PI from the controller section.
- Select Apply.
- Now select Tune option in bottom right corner.
- A new window will be open.
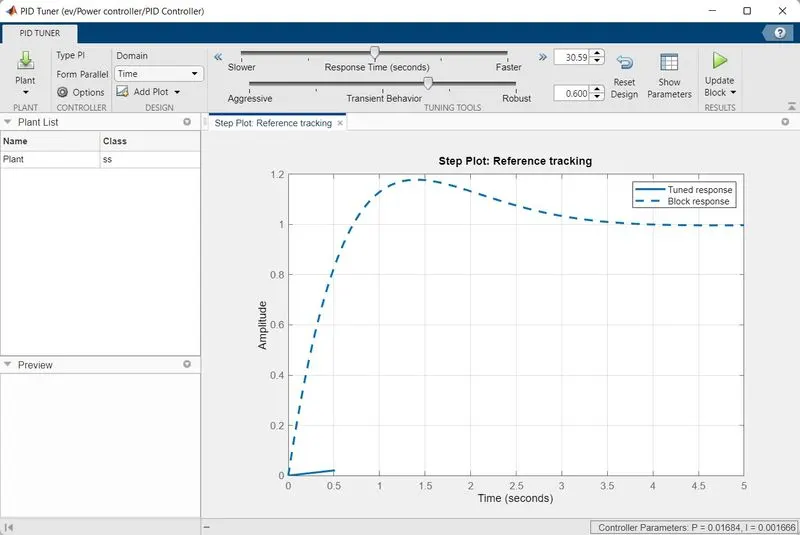
- Now adjust the Response time and Transient time based on the requirement.
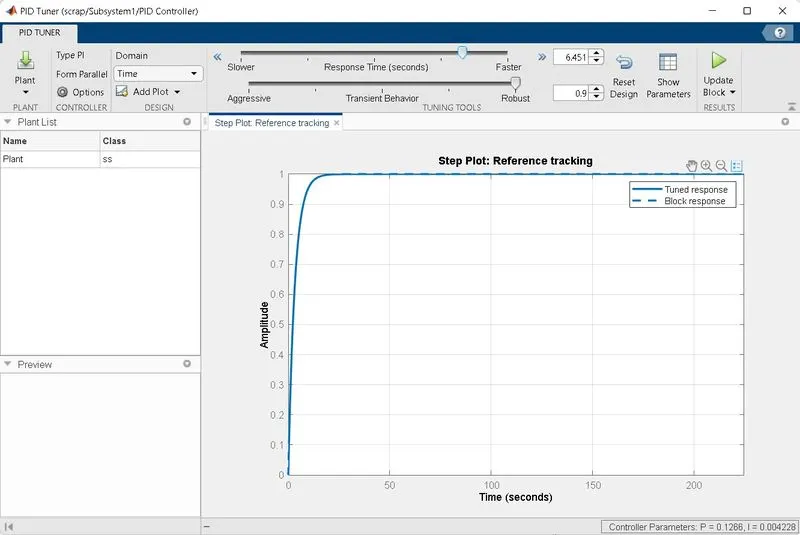
- After adjusting click on update block.
- The PID controller will be updated and the Kp and Ki values will be updated. The values of Kp and Ki are
- Ki = 0.126614491635261
- Kp = 0.00422813138800294
- Now click on OK.
The system response of above controller is shown as
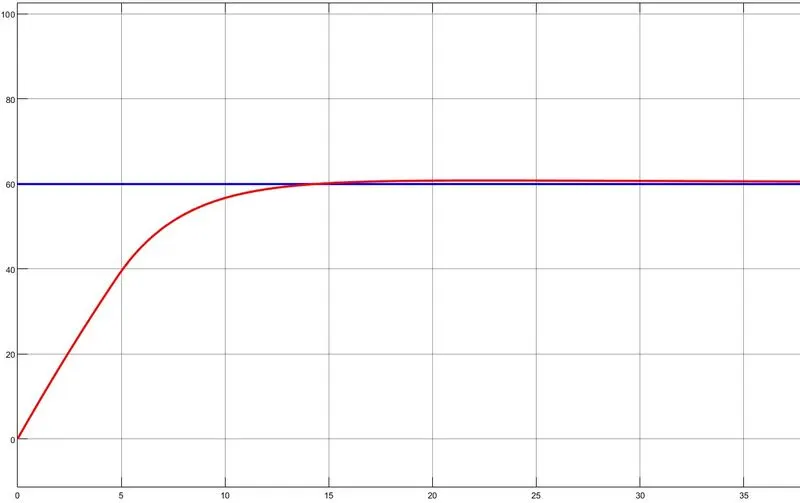
The system response takes 12s to settle. If we increase the response faster the system will go for overshoot and makes the sytem to oscillate more, this will create hunting effect for the vehicle.
g. Drive Cycle
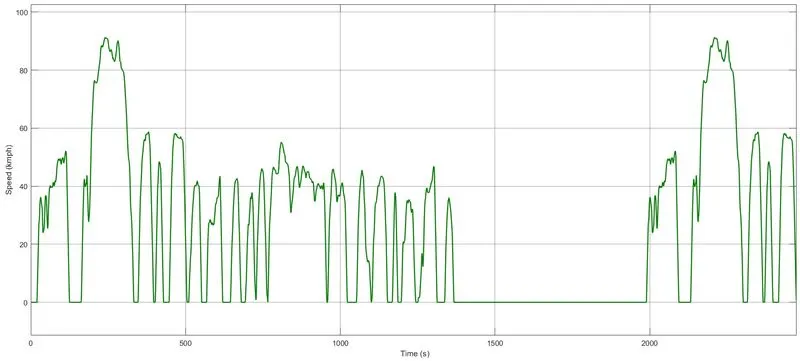
Drive cycle determines the pattern by which the e-rickshaw is travelled, in this model to simulate we required a drive cycle, so in this simulation FTP-75 drive cycle is selected.
h. Dashboard
The dashboard is an important part of vehicle, it is the way by which vehicle interacts with the driver about the running status of the vehicle. It includes
- Speedometer
- Odometer
- SoC meter
- Driving mode indicator
- Blue - underpower
- Green- ratedpower- greater efficiency
- Orange - overpower
- Low battery alert
SIMULATION AND RESULTS
With the above parameters and drive cycle lets run the simulation.
Considering a FTP75 cycle to check whether the vehicle follows the FTP drive cycle pattern.
a. Speed response
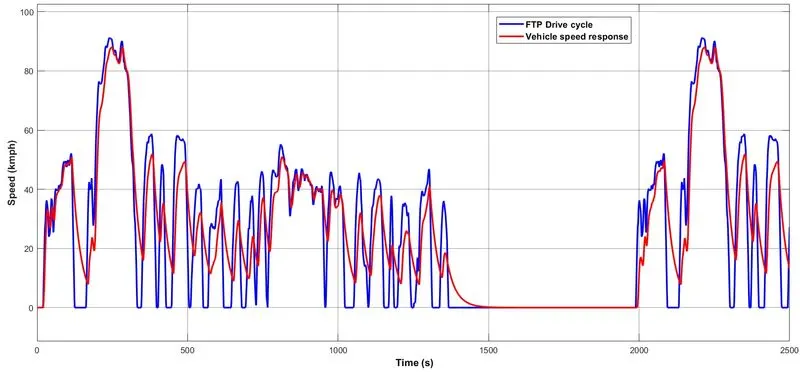
In this output it can see that the vehicle follows the FTP75 drive pattern. The following observation can be made from above results
- Vehicle acceleration requirement is met and minimum time lag in reaching the maximum speed is observed.
- The decceleration is met by regenerative braking.
- The decceleration is lagging due to lack off mechanical brake.
- Small dip in maximum speed is observed.
b. Energy consumption
The energy consumed by the motor can be calculated in two part
- Energy consumed during acceleration
- Energy conserved during regenrative braking
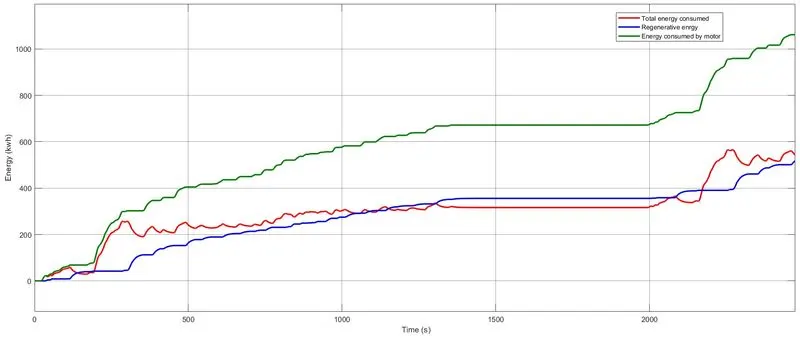
From the above result the following observation can be made
- Energy required to drive the vehicle = 1062kWh
- Energy conserved during regenrative braking = 517.5kWh
- Total Energy required = 544.5kWh
- By having regenerative braking the Energy required by the vehicle can be reduced. In this 517.5kWh energy has saved by regenerative braking and thus the range of vehicle is extended.
c. SoC of battery
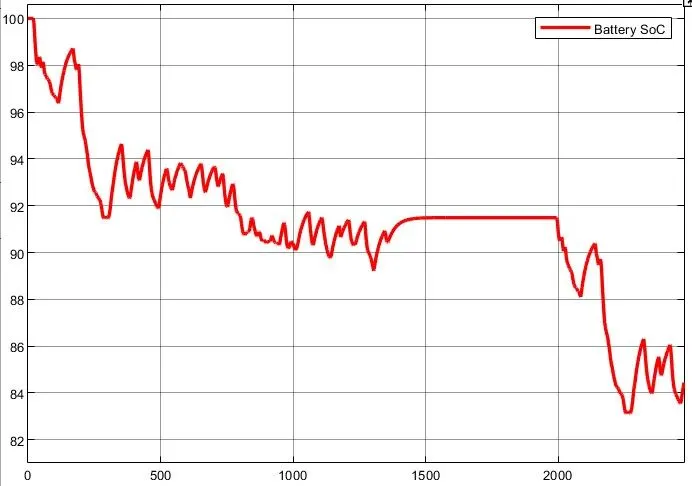
The SoC of battery decrease during driving and increases during regenrative braking. The final SoC is 84.44%.
d. Dashboard details
The dashboard shows the distance travelled by the vehicle during FTP75 driving cycle.
- Total distance travelled = 17.81 km
- Battery SoC level is healthy shown in green
- Final SoC level is 84.44%.
Condition 2: WOT till SoC is 0%
The model is simulated for WOT at 60kmph (max speed of e-rickshaw) till the SoC becomes zero.
a. Speed response
The speed is made 60 kmph at starting testing with WOT.
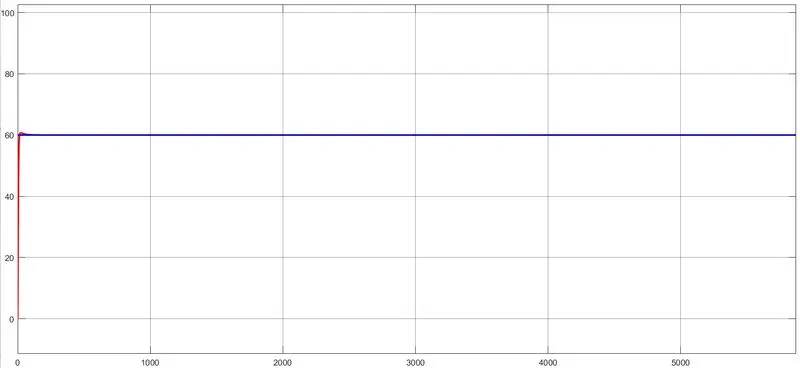
The vehicle takes 14s to reach maximum speed of 60kmph. The simulation is made run to 5870 second with constant velocity input of 60kmph.
b. Energy consumption
As the vehicle is made to move at constant velocity there will be no decceleration and the acceleration command is given to vehicle by the controller to keep the velocity at 60kmph to overcome the rolling, air drag and grading resistance. The power consumed by motor is constant as the resistance parameter is constant, so the energy rise is at a constant rate.
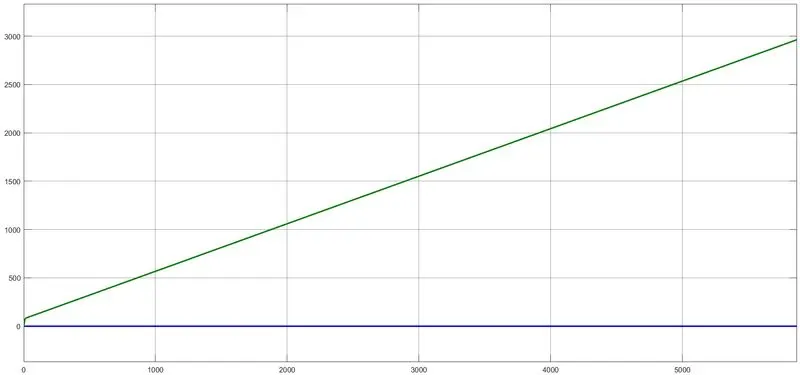
From the above result it is clear that the energy consumed by motor and total energy consumed is same. the regenerative energy (blue) is zero, as there is no braking in this simulation has done.
Total energy consumed is 2963kWh.
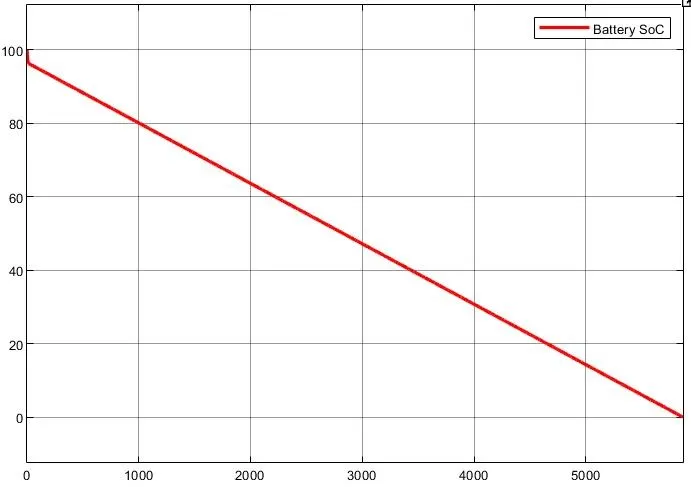
c. SoC of battery
As there is no regenerative energy, the battery will be only in discharging mode.
d. Dashboard
The dashboard readings at ending of the simulation is shown as
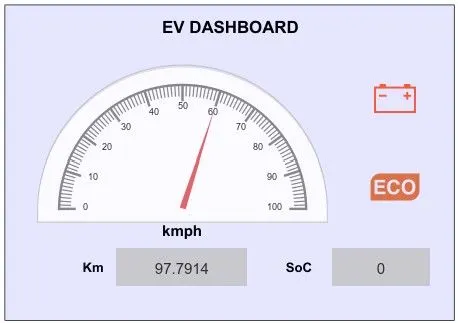
From the dashboard following inference can be made.
- The ECO is in orange color, because the speed is at maximum.
- The battery sign is in red colour, because the SoC of the battery is below 10%.
- Total distance travelled by the vehicle is 97.8km.
- Final SoC is 0%.
CONCLUSION
The EV car is designed and modelled. The working of the model is beiing evaluated in MATLAB Simulink software.
The main objective of the project was to design the power controller unit, the designed PCU is working properly with fast response and under stable condition. The PI controller was tuned for maximum fast response with stability as a constrain. The model works fine for WOT test and FTP-75 drive cycle.
The vehicle with maximum payload can achieve speed of 60kmph in just 14s. Thus the power delivery of the vehicle is also in best performance with a 35kW motor. To reduce the cost of EV the battery capacity is limited to 30kWh, which can be further improved to higher capacity if cost can increase.
Thus the EV designed in MATLAB Simulink software simulates fine, and the speed of the vehicle tracks the drive cycle input given to the vehicle.