Project-1: Modelling an electric Car with Li-ion battery
AIM OF THE PROJECT :
Modelling an Electric Car with Li-Ion Battery using various Driving Source as a Speed Reference
OBJECTIVES :
- System level configurations
- Model parameters
- Results
- Conclusion.
INTRODUCTION :
An electric vehicle (EV) is one that operates on an electric motor, instead of an internal-combustion engine that generates power by burning a mix of fuel and gases. Therefore, such as vehicle is seen as a possible replacement for current-generation automobile, in order to address the issue of rising pollution, global warming, depleting natural resources, etc. Though the concept of electric vehicles has been around for a long time, it has drawn a considerable amount of interest in the past decade amid a rising carbon footprint and other environmental impacts of fuel-based vehicles.
Benefits of Electric vehicle:
- They produce no tailpipe emissions, so are better for the planet.
- better utilise the electricity network
- help EV owners avoid higher-cost charging periods
- help EV owners avoid higher-cost charging periods
- help support the integration of more small and large-scale renewable energy systems into the electricity grid
- The cost of the electricity required to charge an EV is around 40% less than the cost to use petrol for a similar sized vehicle driving the same distance. The cost will be lower if you charge your EV from your solar PV system or at free charging stations.
- An Electric Vehicle (EV) has fewer moving parts than a conventional petrol/diesel car. Servicing is relatively easy less frequent and overall cheaper than a petrol/diesel vehicle. All EV batteries degrade (become less efficient). Most car manufacturers warrant EV batteries to not degrade below a certain level for around eight years. It may become necessary to replace a battery in an EV in the time you own it.
In India, the first concrete decision to incentivise electric vehicles was taken in 2010. According to a Rs 95 crore scheme approved by the Ministry of New and Renewable Energy (MNRE), the government announced a financial incentive for manufacturers for electric vehicles sold in India. The scheme, effective from November 2010, envisaged incentives of up to 20 per cent on ex-factory prices of vehicles, subject to a maximum limit. However, the subsidy scheme was later withdrawn by the MNRE in March 2012.
In 2013, India unveiled the National Electric Mobility Mission Plan (NEMMP) 2020' to make a major shift to electric vehicles and to address the issues of national energy security, vehicular pollution and growth of domestic manufacturing capabilities. Though the scheme was to offer subsidies and create supporting infrastructure for e-vehicles, the plan mostly remained on papers. While presenting the Union Budget for 2015-16 in Parliament, then finance minister Arun Jaitley announced faster adoption and manufacturing of electric vehicles (FAME), with an initial outlay of Rs 75 crore. The scheme was announced with an aim to offer incentives for clean-fuel technology cars to boost their sales to up to 7 million vehicles by 2020.
Another way EVS are different is that range and efficiency aren't directly related. That's because of charging losses, roughly 85 to 90 percent of the total energy that comes from the wall makes it into the battery pack. That's why ther are two terms used: efficiency, which can be expressed in MPGe, includes charging losses, while consumption, the energy use while driving, doesn't include them.
The EV range test is done at a steady 75 mph, because highway driving is where range matters most. If ones looking to cover 500 or 1000 miles in a day, it necessarily has to be done at high speeds. There's just not enough hours in the day to do otherwise. Even the shortest-range EV can manage more than 7 hours of slogging through city traffic at a average speed of, say, 15 mph. Also, unlike a gas-powered vehicle, an EV's consumption increases dramatically as speeds rise. Of course, as with all cars, aerodynamic drag inflates with the square of speed, but EVS are particularly affected as all but the Porsche Taycan lack multiple gears. So, a higher vehicle speed means the electric motor is spinning at a faster and less-efficient point.
Block Diagram of Electric Vehicle :
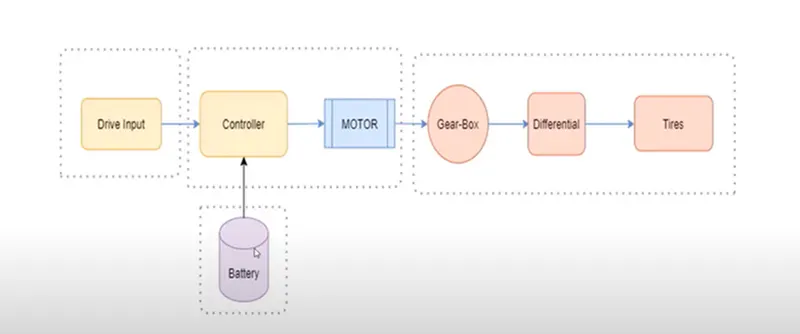
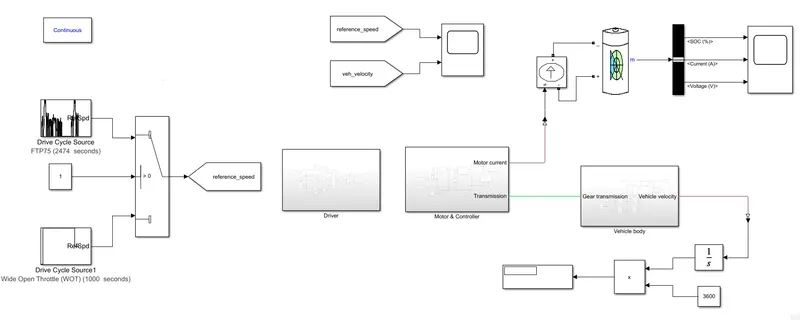
The Electric vehicle model is made using MATLAB/Simulink. This model is a complete representation of an Electric vehicle which is built using Powertrain blocksets. The major subsytem of this model are as follows:-
i) Drive Cycle Source
ii) Driver
iii) Motor and Controller
iv) Battery
v) Vehicle Dynamics (Vehicle Body).
SIMULINK MODEL OF ELECTRIC CAR WITH LI-ION BATTERY :
1) Drive Cycle Source:-
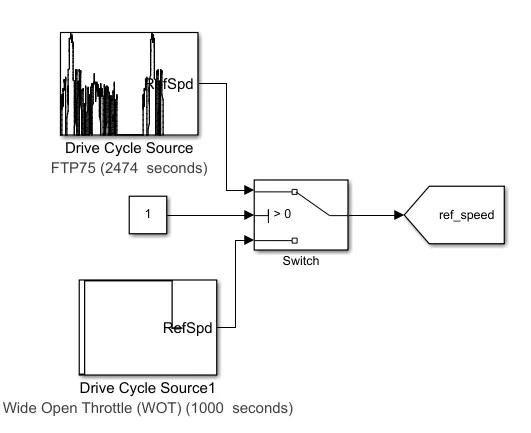
Here in this project i have used two Drive cycle source which are FTP-75 and Wide Open throttle (WOT). Also i have used switch in between the two drive cycle source so that at one time only one source is applicable to the model. Constant value 0 and 1 is used to change over between the Drive cycle source. With constant value 1 FTP 75 drive cycle is selected and with 0 WOT.
(1). a) FTP-75 (2474 Cycle) :- Fedral Test Procedure 75 drive cycle is used to estimate the range distance travelled by an Electric Vehicle in a single charge.
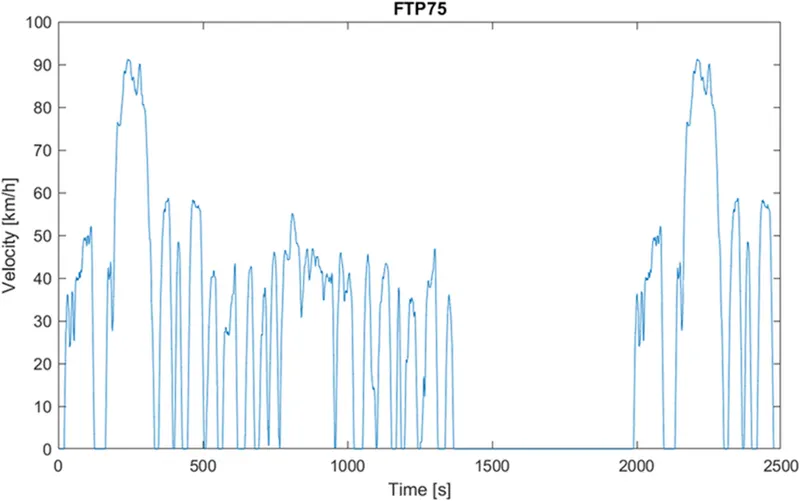
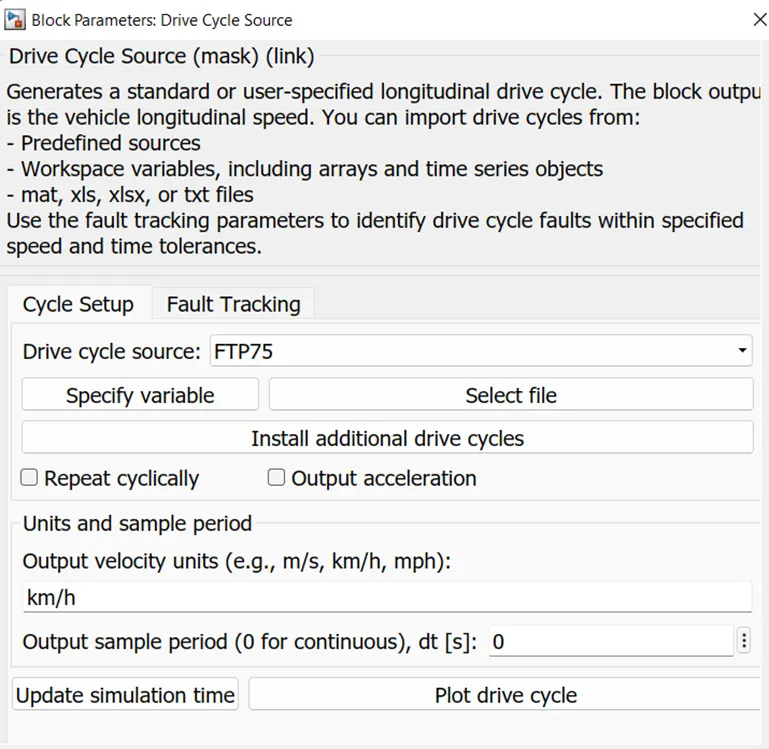
Here the model simulation or run time will be 2474 sec as per the standard.
(1). b) WOT (Wide Open Throttle) :- It is used to generate the user specific or longitudnal drive cycle. The block output is the vehcile longitudnal speed. Here in my case I have declared parameter of WOT as :-
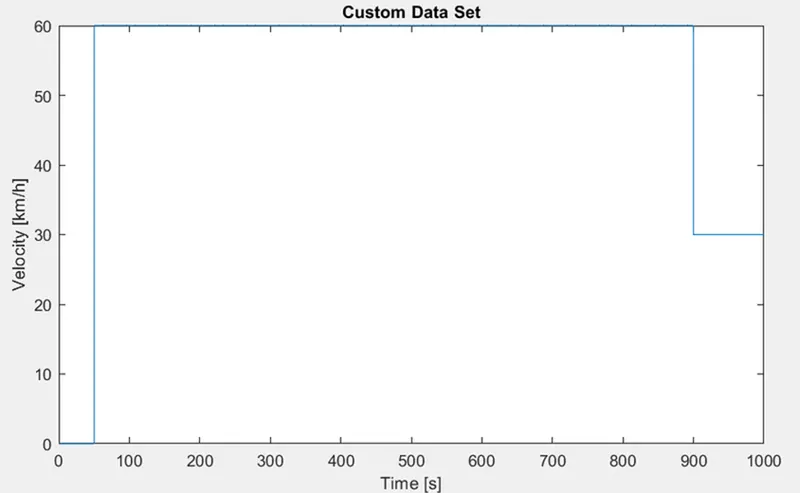
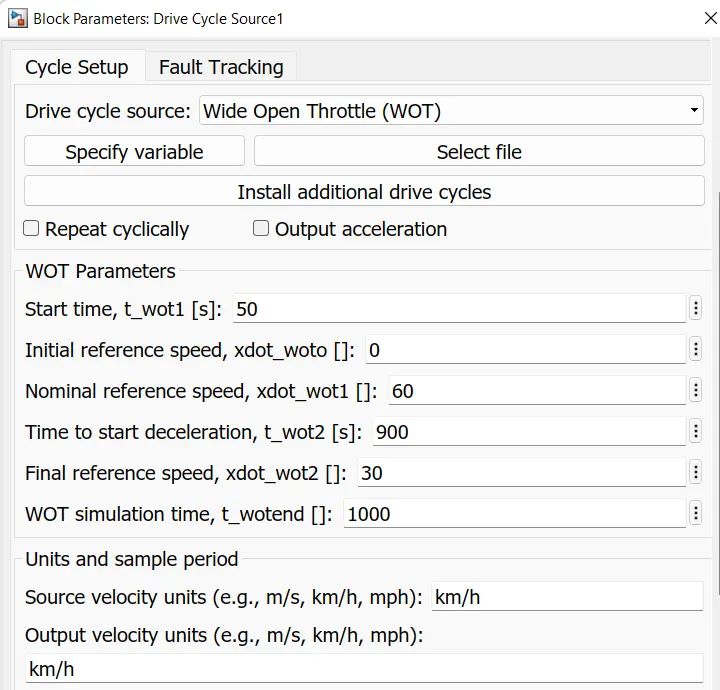
Here the model is simulated for 1000 sec.
2) Driver:-
For the modelling purpose PID and PI are widely used for speed control. While Modeeling an Electric Vehicle we are having a reference speed whixh is generated from the drive cycle input. After the completition of the simulation process we have to check whether the actual vehicle velocity matches the refrence speed or not.
A PID controller typically works on the principle of adjusting or tuning the proportional, integral, or derivative terms. The difference between these variables is evaluated and part of the input signal is fed back to the device as a feedback control signal. This value is generally known as the correction factor.
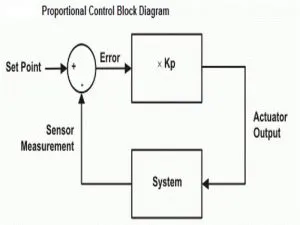
(a) Proportional Tuning:- This type of tuning involves adjusting or correcting the desired signal proportional to the current error signal e(t). The error signal is the difference between the setpoint or the target value and the actual value. The current error signal is further multiplied with the pre-calculated proportional constant to obtain the output. If the error value is equal to zero, the controller output value is also zero.
(b) Integral tuning:- I-controllers make use of integral tuning to generate the output signal to manipulate various physical parameters. This type of tuning tends to integrate the error signal with respect to time until a minimum or zero value of the error is achieved. In case of a negative error value, the integral control tends to decrease the output. The speed of response and the stability of the system; however, get affected during the process.
The integral gain of the ‘I’ controllers, usually denoted by Ki, is indirectly proportional to the speed of response of the system. This means that if the integral gain is increased, the speed of response of the system gets reduced by a comparable value. Similarly, the integral gain is directly proportional to the steady-state error. This means that the steady-state error gets reduced by reducing the integral gain of the controller and vice versa.
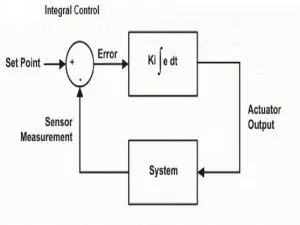
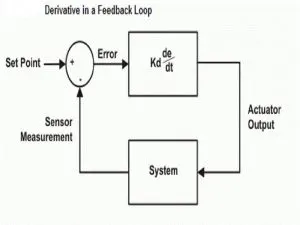
(c) Derivative Tuning:- The ‘D’ controllers or derivative tuning is normally used to overcome certain limitations of the ‘I’ tuning. For instance, an ‘I’ controller does not have the ability to predict the future behaviour of the error value. The output of the derivative controllers is equal to the rate of change of the error signal with respect to time multiplied by the derivative constant. The derivative tuning helps in improving the system response and decreasing the settling time of the output. The derivative gain Kd is directly proportional to the responding speed of the system. This means that an increase in the derivative gain of the controller tends to increase the response time of the system.
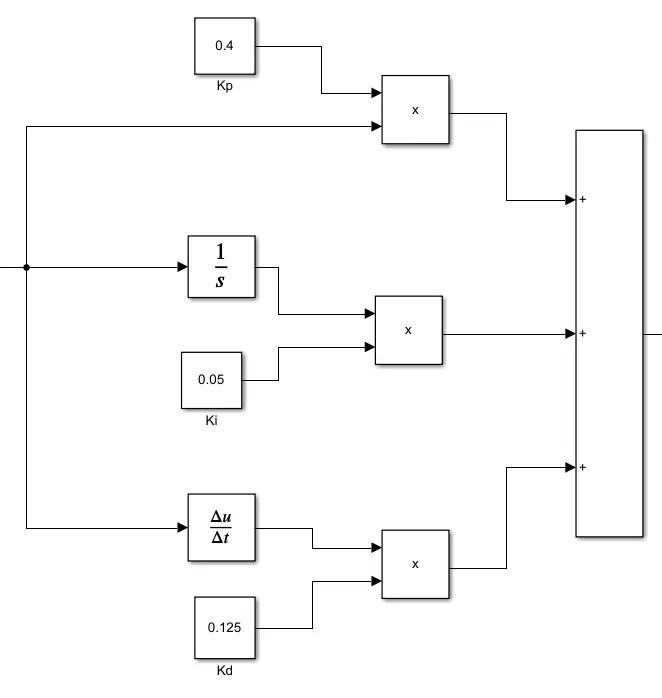
I made a PID controller in the simulink with the help of constant which describe the value of Kp, Ki and Kd and the integrator block for Integral control and derivative block for derivative control of the controller and the values of the gains come out to be Kp= 0.4, Ki= 0.05 and Kd= 0.125
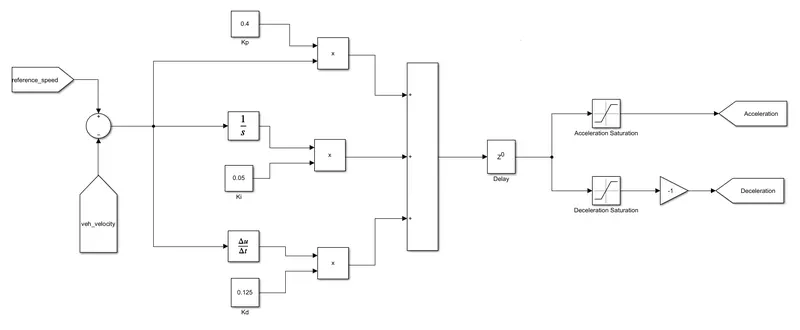
This PID controller gets the input in the form of error signal which is generated as a result of negative feedback. When the reference speed and Actual vehicle velocity is compared there diffrence is the error signal. This error signal is applied to the PID controller and the output of the PID controller is sum of all the three controls which then fed through the Delay block which is of zero order and it carry out all the algebraic computation. And after the delay blcok the Saturation block (for providing upper and lower limits) are there for respective Acceleration and deacceleartion commands and these commands are then fed to the Power converters.
3) Motor and Controller:-
This subsystem contain blocks like Controlled voltage and PWM source, H bridge and Dc motor lets see them one by one:-
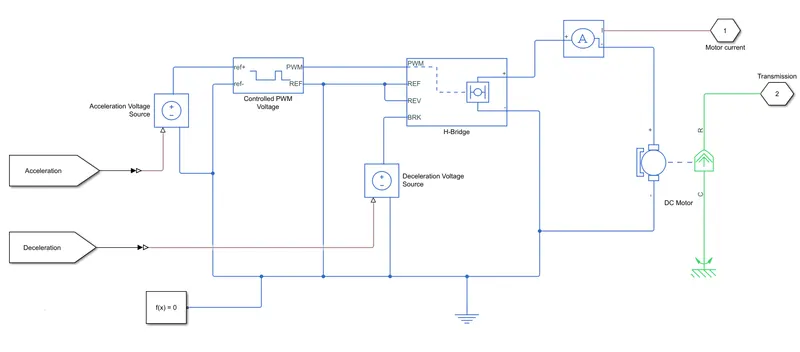
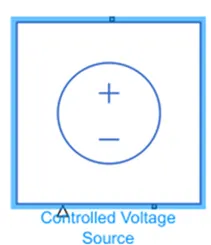
(a) Controlled Voltage Source:-It is a souce which activate when the signal applied to it get high and the volatge is applied across the +ve terminal of the Source and in this model i have used two voltage sources one for acceleration and another for braking.
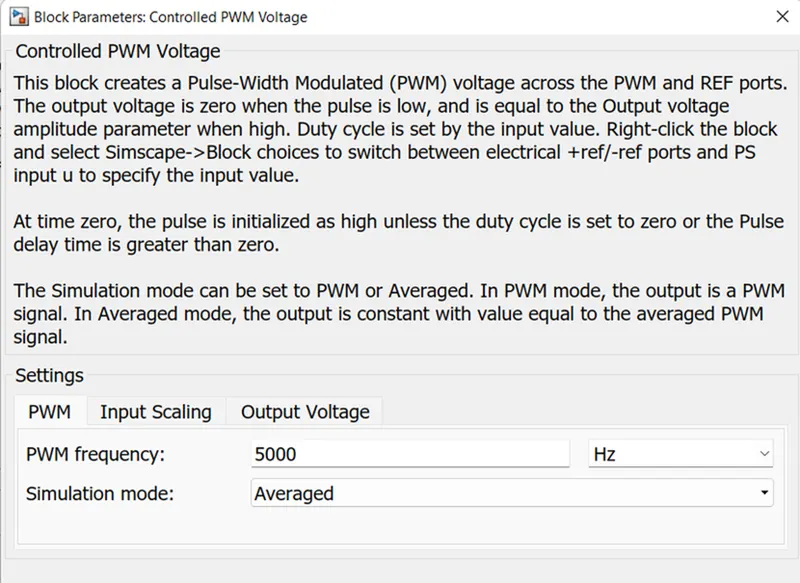
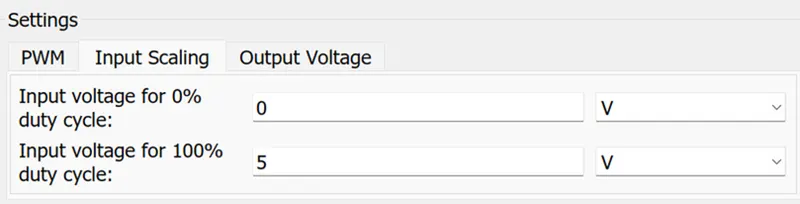
(b) Controlled PWM Voltage Source:-It is used to provide controlled Pulse widdth modulated signals to the H bridge. The block will provide output from the PWM and reference is used as ground by connecting it through electrical reference. The input of the PWM block is +ve and -ve reference. +ve reference is provided from the Accelerated Control Voltage Source and -ve of the ref is connected to the Electrical reference.
Parmeters of the PWM block are as follows:-

(c) H Bridge:-H bridge is the power converter used here as it convert the required signal in the form of desired output and the output is applied to the Dc motor. It has two part one is left and other is right part. Right part is connected to the positive and negative of dc motor. and The left part consist of following parameters:-
PWM-(Pulse width Modulation) will provide the voltage pulses to the H bridge either in PWM or average form. and is applied input from PWM of the Controlled PWM Voltage Source
Ref- (Reference)- Electrical Reference is provided to this port.
Rev- (Reverse)- Electrical reference is provided to this port.
Brk- (brake)- It is provided signal from the Brake controlled Voltage source
Block parameters of H bridge are as follows:-
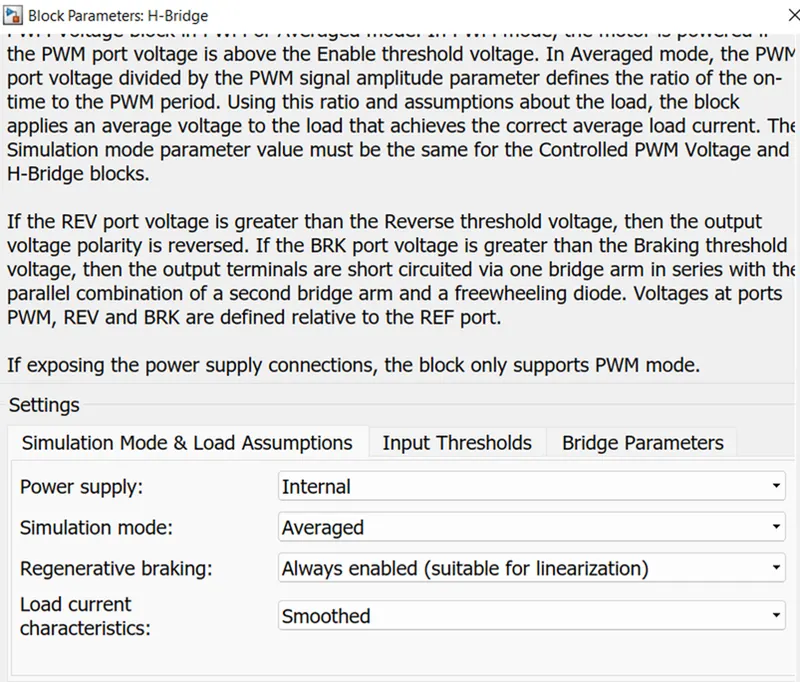
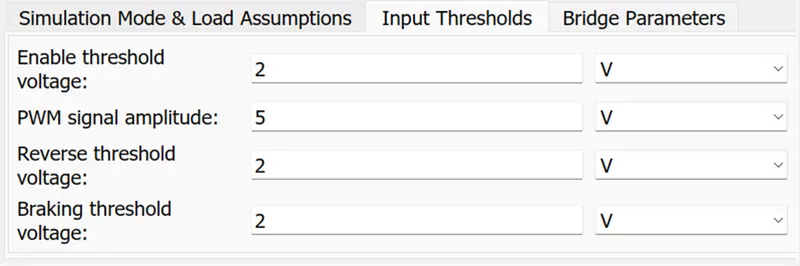
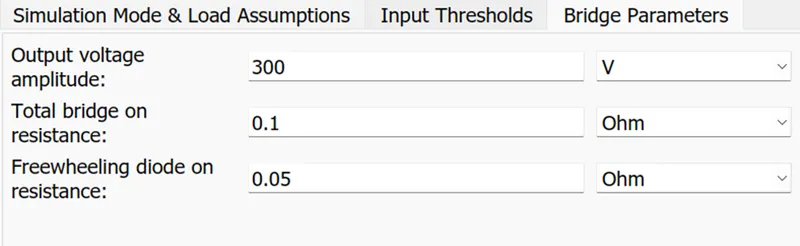
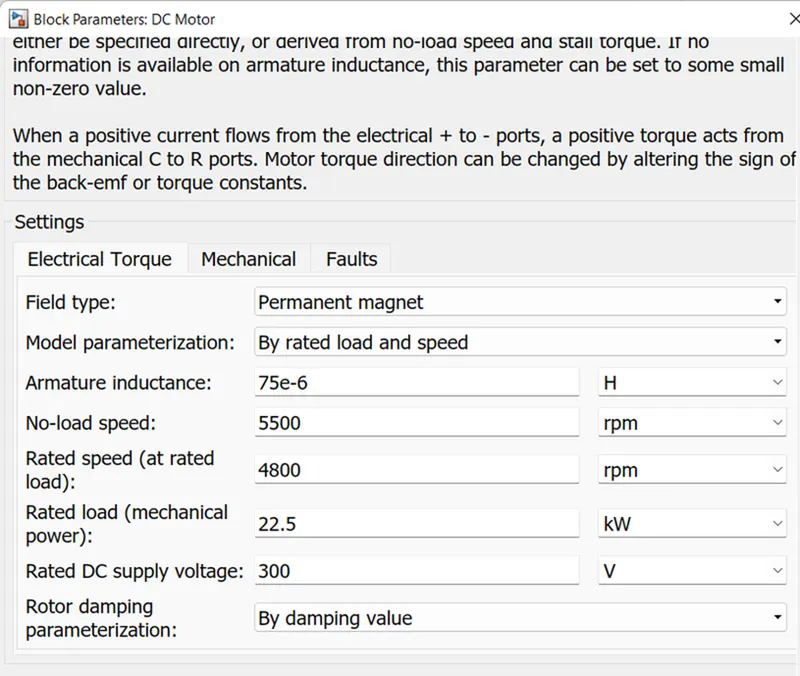
(d) DC Motor:-Simple Permanent Magnet Brush type Dc motor is selected as they are easy to model because of there less complex behaviour as in comparison with induction motor or BLDC motor.
This motor has two part one is electrical on the left and other is mechanical part on the right. Mechanicla part is having two connection R ( Rotor) and C (Case). C part is connected to the rotational reference and R is connected to the Base of Simple gear of the vehicle body subsystem. Electrical part comprises of positive and negative terminals. The positive part is connected to the H brige positive and negative terminal ios connected to the negative of H bridge along with the electrical reference.
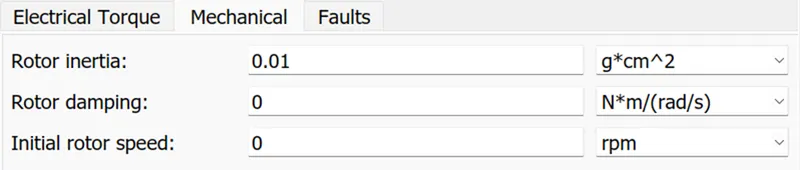
Block parameter of Dc motor are as follows:-

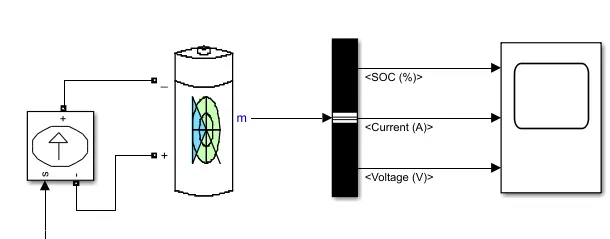
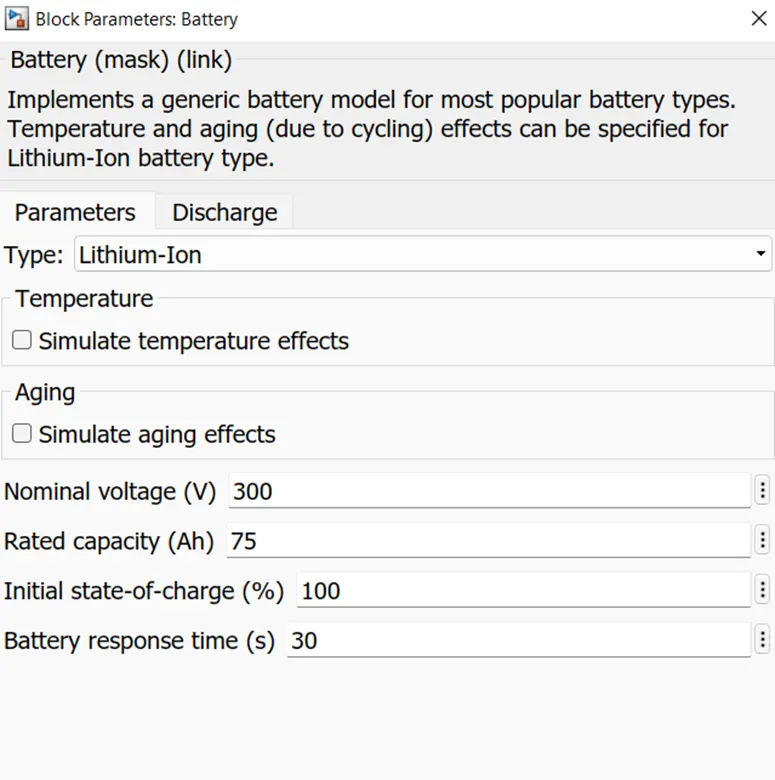
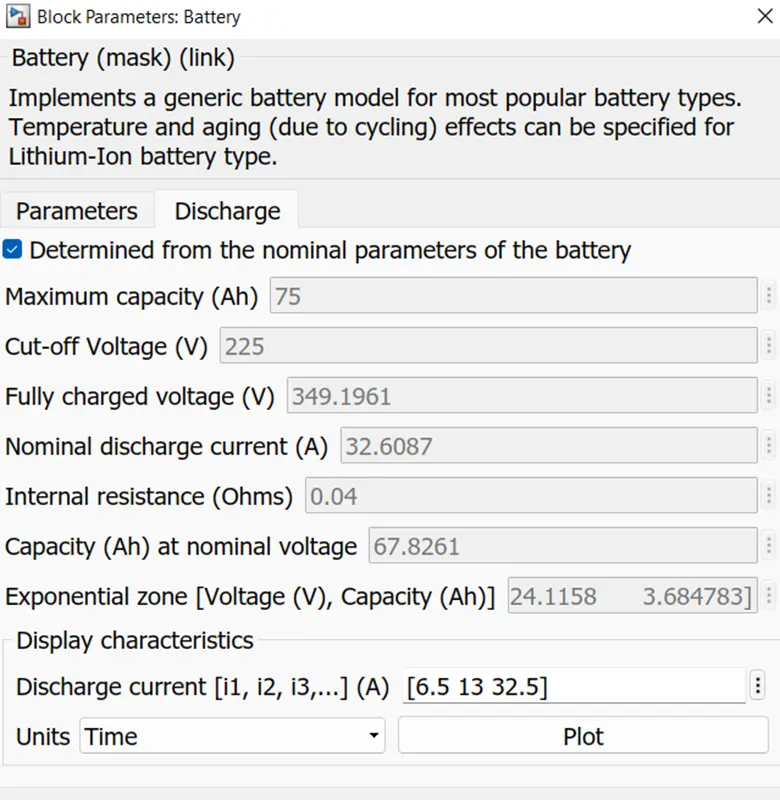
4) Battery:- A battery package is used which is Lithium Ion Battery of 300 V and 75 Ah. The output of the battery is SOC, currenta and voltage. A controlled current source is used to charge and discharge the battery. The input of the Controlled current source is from the Power converter block through a PS- simulink converter.
Block parameter of the Battery are as follows:-
5) Vehicle Dynamics (Body):-
This subsystem contain major block such as Simple Gear, Vehicle Body and Tire ( magic formula). It focuses more on the dynamics of the vehicle like the road condition, sourrounding condition and the load on the wheels etc.
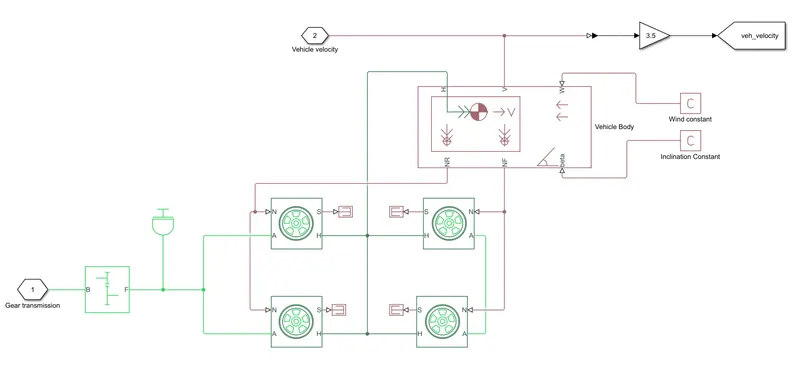
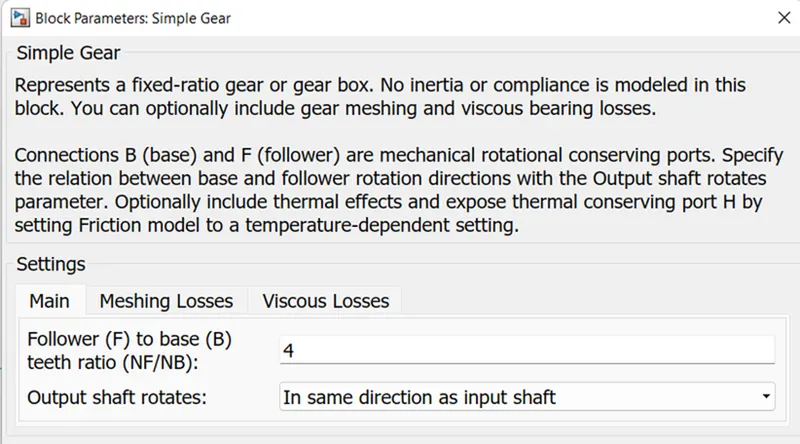
(a) Simple Gear :-It is used for the transmission system of the vehicle. I have used simple gear to simplify the transmission related parameter. It has B which is base and it is getting input from the motor shaft and follower which is reducing the speed of motor and is coupled to the axle of the rear wheels.
Block parameter of the Simple Gear are as foolows:-
(b)Vehicle Body:- The vehicle body block contain six main sub-parts such as:-
H (Hub) - It is used to connect the hub of the wheels to the main body of the vehicle
V (Velocity)- It is an output port and used to tell us that at what speed our vehicle is running i.e. the actual speed of the vehicle is known through this port.
W (Wind Velocity) - It is an input port by which we can consider the impact of wind acting on the vehicle.
NR (Normal Rear Force)- It gives the signal output for normal force acting on the rear wheel of the vehicle
NF (Normal Front Force)- It gives the signal output for normal force acting on the front wheel of the vehicle
Beta (Angle of Inclination)- It is used to consider the hill climbing force acting on the vehicle.
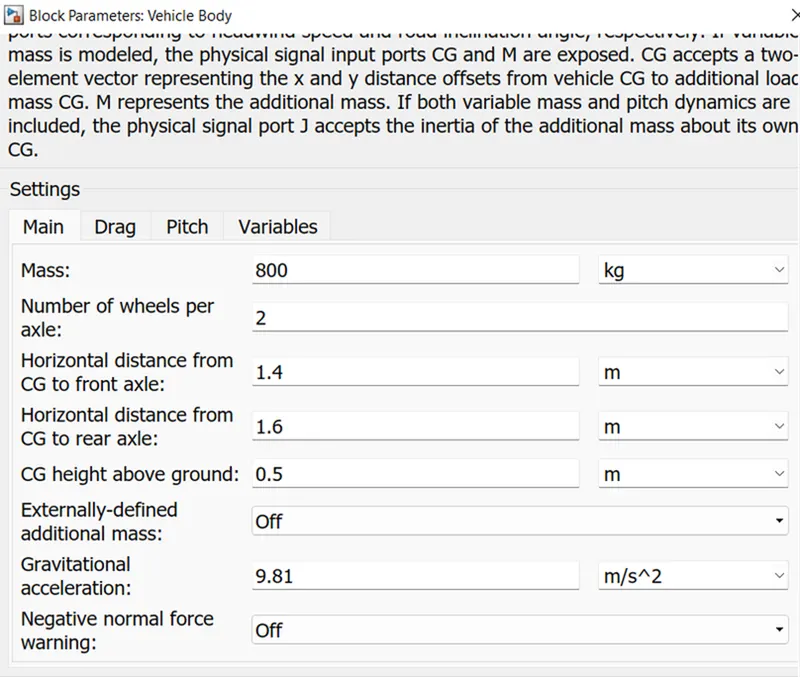
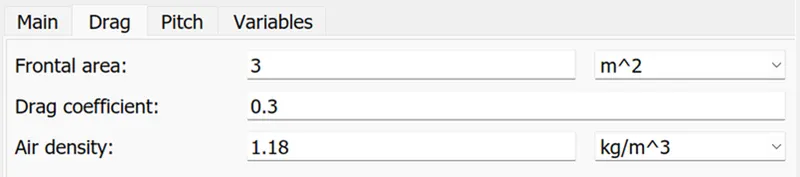
Parmeter of Vehicle body are as follows:-
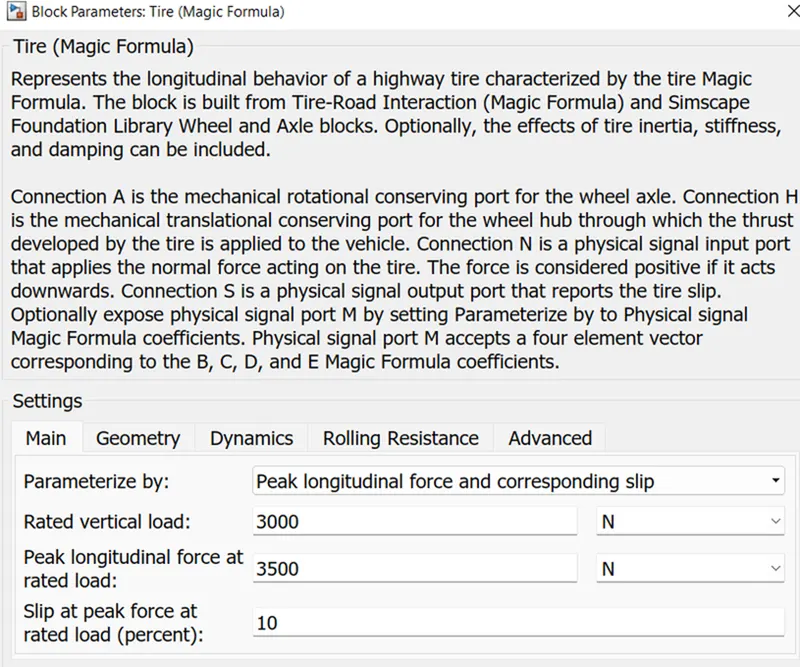
c)Tire (Magic Formula):- Here i have used Magic formula tire in this model, as it allow us to model the tire behaviour on highways. It also allow us to consider tire inertia, stiffness which can be more accurate for real world condition.
Parameter of Tire block:-



RESULTS :
(i). FTP 75 (2474 sec) :-
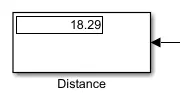
The simulation run time foe this drive cycle is about 2474 seconds. The distance travelled by the vehicle is about 18.29 km.
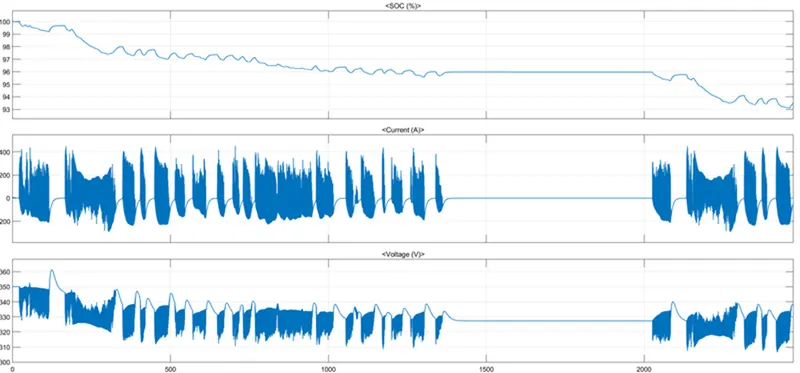
Battery SOC is about 94.5% after the test.
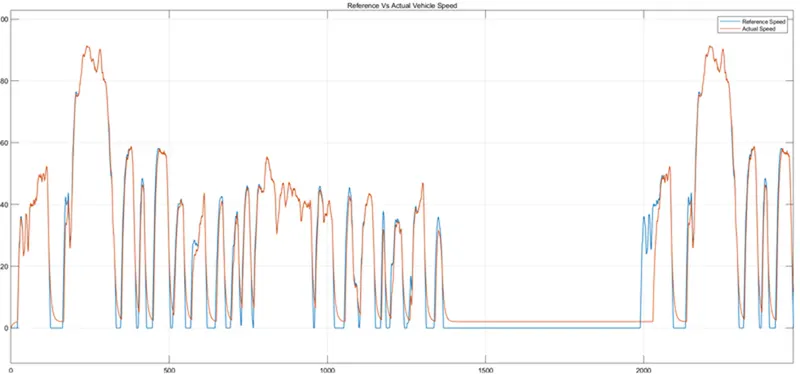
Vehicle velocity is actually following the reference velocity.
(ii). WOT:-
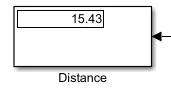
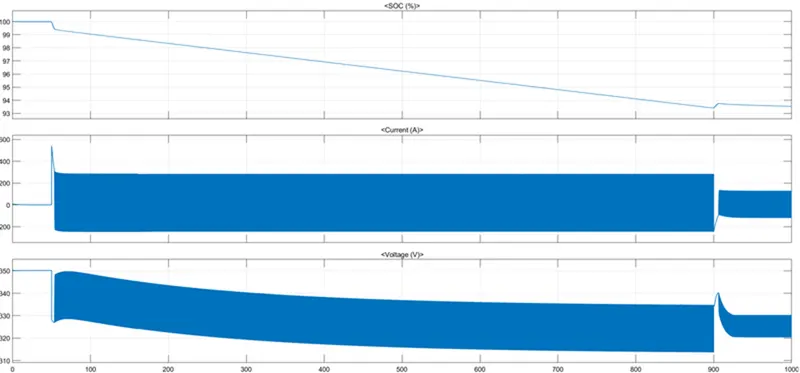
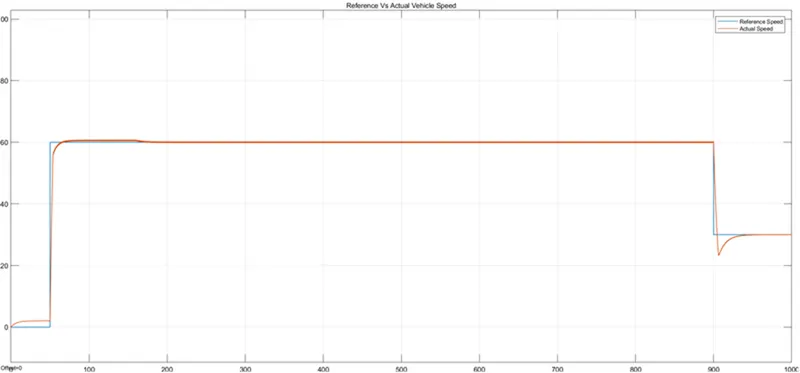
For the input drive cycle of Wide Open throttle the distance travelled by the vehicle is 15.43 km and the simulation is run for total 1000 seconds. Vehicle start after 50seconds and then tries to attain speed of 60 kmph till 900 sec and after 900 sec the deaccelration starts and vehicle starts to deaccelerates to 30 kmph at the end of 1000 sec.
The Battery SOC after the test is around 93.5 % and this can be seen below:-
Vehicle is foloowing the refrence velocity for the WOT test.
CONCLUSION:-
The main objective of the project was to make PID controller which is able to track the reference speed and act accordingly to achieve the same with minimum possible error. Here i have avoided ready made PID controller block and made my own PID controller with constant which states the value of gain and Integrator and Derivative for the respective Integral and Derivative control. From the result we can conclude that the main objective of the controller is achieved and the vehicle ois following the reference speed.