Project 1 - Design and Develop a IOT based Wireless Wearable Health Monitoring System or a Home Healthcare System to monitor the physiological parameters of ECG, Heart Rate, Pulse Oximetry, Cuffless Blood Pressure and Body Temperature.
Design and Develop an IOT-based Wireless Wearable Health Monitoring System or a Home Healthcare System to monitor the physiological parameters of ECG, Heart Rate, Pulse Oximetry, Cuffless Blood Pressure, and Body Temperature.
The name of the device:-
- A non-invasive smart wearable physiological parameter monitoring system has been developed during this project
- The system is developed with a user interface platform on an Android-based mobile phone to track the patient's health through a wireless network from anywhere in the world
- The design system would be a wearable Health Monitoring System
The appropriate name for the product I will be designing and developing would be "Healthcare Penta" Smart monitoring system
- I have named it healthcare Penta because the device would be associated with the care for patients which will be either a wearable healthcare system to monitor and message
- The word " Penta" is used because as the question given above in my device we will be finding 5 physiological parameters such as
- ECG
- Heart rate
- Pulse oximetry
- Cuffless blood pressure
- Body temperature
Specifications of the parameters along with the frequency, amplitude and sensors used
|
Physiological Parameters |
Frequency /physiological signal signification |
Amplitude |
Sensors |
|
ECG |
0.5-100 Hz |
0.25-1 mV |
Single lead ECG sensor AD8232 |
|
Heart rate |
40-220 beats per minute |
_____ |
MAX30102 Heart and pulse rate sensor |
|
Pulse oximetry |
0°C -40°C Resolution+-0.01°C |
_____ |
MAX30102 Heart and pulse rate sensor
|
|
Cuff-less blood pressure |
Derived from the analysis of pulse transmit time Systolic:50-300 mmHg Diastolic :40-140 mmHg |
_____ |
PTT is basically measured from the PPG and ECG signals |
|
Body temperature |
0°C -40°C Resolution+-0.01°C |
_____ |
LM35 analog temperature sensor and Thermistore |
Physiological parameters
ECG
- Frequency:0.5 to 100 Hz
- Amplitude 0.25 to 1 mV
- Sensor
- MedTex 130 textile electrode(30mm ×25 mm)
- ECG sensor AD8232
Heart rate
- 40 to 220 BPM
Body temperature
- O°C to 40°C resolution
- Sensor
- Thermistor YSI 409B
- LM35
Photoplethysmogram(PPG)
- Frequency 0.5 to 20 Hz
- This is used for cuffless blood pressure measurement only
- Sensor
- Red Light LED source at 670 nW and 3 mW power
The architecture of the "Healthcare Penta" smart monitoring system
The architecture basically consists of
- Sensor nodes
- Power section
- Digital section
- Bluetooth module-Coordinator/Sink node
- Cloud store database
- End users-
- Doctors
- Emergency health care
- Patient Electronic Health Record
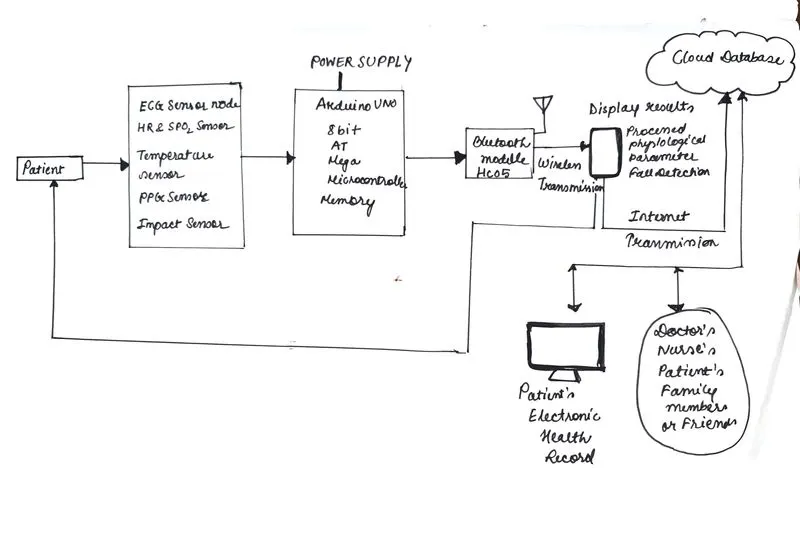
Sensor nodes
- There would be 4sensor nodes which will be useful to monitor the health parameters and another sensor was used to detect impact situations
- Sensor node 1-
- ECG in lead 1 configuration is used from the upper thorax region
- Single lead ECG sensor AD8232
- Analog sensor with 3.3 V operating volt
- 3 electrodes can be placed under the cloths confidentially(RA, LA, and RL)
- Pins are basically connected to the microcontroller to inform if there will be any loose connection
- Sensor node 2-
- Body temperature sensor LM35 analog sensor is used to measure the body temperature
- It is able to read temperatures of -55°C to +150°C
- Has a 0.5°C tolerance
- Connected to the analog input of the Arduino UNO
- Sensor node 3
- Noninvasive optical device MAX30102 is used for achieving basically two main functions one detection of the heartbeats and the second peripheral capillary oxygen saturation
- Sensor node 4
- Cuffless Blood pressure signal acquisition
- To acquire the blood pressure PPG sensor is used
- It uses the right light source for operating at the wavelength of 670 nm with the 3 mW power
- We have used a PPG sensor and ECG sensor to obtain the Pulse Transmit Time
- cNIBP algorithm is used to obtain the original Systolic BP and Diastolic BP
- Cuffless Blood pressure signal acquisition
- Impact sensor
- ADXL335 accelerometer sensor
- Used to detect the impact of situations
- Sensor node 1-
Power section
- It is consist of
- Rechargeable Battery
- 4 V,1.8AH
- Voltage regulator to regulate the voltage of the system
- 5V, GND
- Battery charger circuit with
- 9 V adapter unit
- Rechargeable Battery
Digital section
- It is composed of the following components
- 10 bit ADC
- 8-bit AT mega Microcontroller
- Arduino UNO
- Enhanced RISC architecture
- Powerful instructions executed in a single clock cycle
- The throughputs of ATmega32 achieves by approaching 1MIPS per MHz
- This approach allows the system designer to optimize the power consumption
- JTAG(Joint Test Action Group) interface to allow the signals in the enabled device to be basically controlled and monitored without any physical access
- UART interface to transmit the data asynchronously. It converts the parallel data into the serial data for the outbound communication
- Memory to store the data
- Zigbee wireless module
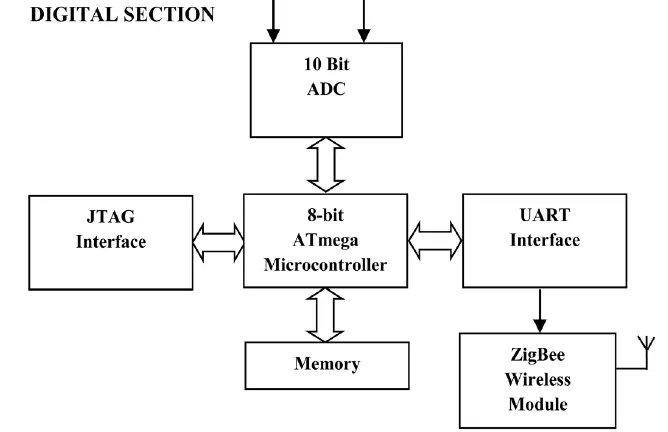
Fig: The Digital section
Bluetooth module/Coordinator/Sink node
- It is used to acquire the data from the sensor nodes as it has been shown in the figure
- The data that has been acquired is sent to the remote monitoring station using Bluetooth wireless communication module
- The data is received in the remote monitoring station processed and displayed
- The architecture of star topology is used in the sink nide
Cloud storage
- Google's cloud is used to store the data
- An online database was hosted using the Google fusion gables
End users
- The doctors and the emergency call receiver would be the end user for obtaining the data
- All the data would be received by this end user
- For any abnormality, these end users will give an immediate response to the patient
- Electronic Health Record is used to store patient data securely and retrieve them whenever it's needed
Design guidelines
- To design the sensors
- Acquire the data from the sensors, and process it in the digital section
- Collected data is then transmitted through a Bluetooth module with Wifi connectivity to the end users and cloud storage database
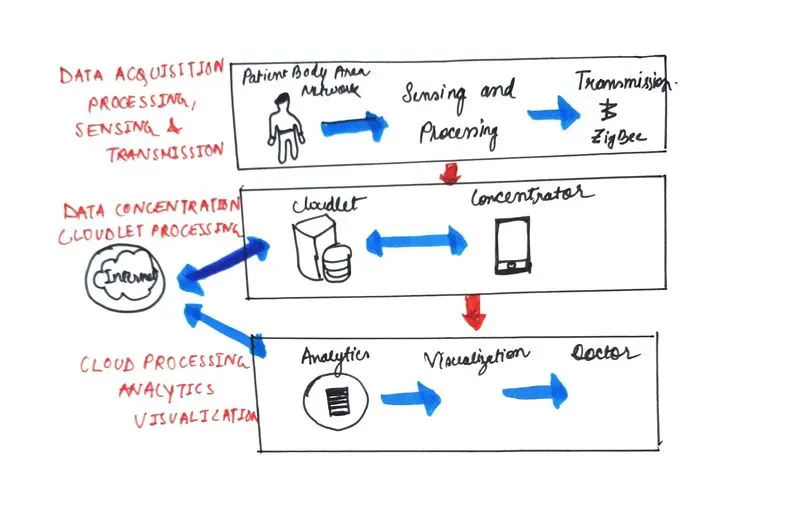
Fig: The concept design of the wearable IoT system
ECG sensors
- The sensor used by the ECG can be placed under the cloth effectively
- Two analog filters included
- High pass filter
- Low pass filter
To achieve the required bandpass filter
- The output pins are connected to the microcontroller controller
- SDN pin is used to shut down the battery
Body temperature sensor
- To obtain instantaneous information about the body temperature avoiding any issues the LM35 temperature sensor is used
- It should be put under the body arm and is then connected to the input of Arduino UNO
Heart rate and pulse oximetry sensor
- The MAX30102 is used for achieving the two main physiological parameters
- Reflected light measuring mode is used by this sensor
- Red and Infrared lights are used to measure the reflected light
- For calculating the heart beats per minute another approach is used
- A heartbeat causes the arteries to feel an amount of blood pressure
- The volume of the artery increases and reduces in the body parts such as the fingertip in this project
- The more blood increases results in more amount of hemoglobin in that area so the PPG signal is obtained by the reflected light
- The PPG wave can be filtered by a low pass filter to obtain the noise-reduced waves to basically measure the heart pulse rate
Cuff-less blood pressure sensor
- The conventional methods of blood pressure measurements using a cuff are not liable for the wearable physiological applications
- Pulse Transmit Time is measured as the interface between the peak of R-wave of ECG and fingertip PPG signal
- A Matlab code is running on the PC with the GUI interface which is used for calibrating, testing, and developing the cNIBP algorithm
- A peak detection algorithm is used to calculate the cuffless blood pressure
- To derive the blood pressure pulse transit time (PTT) is one of the most commonly used passive approaches compared to the Pulse Wave Velocity(PWV)
The data acquired by the sensor nodes are then sent to the microcontroller controller where the signals will be processed. The processed signals are fed into the ZigBee Wireless module with Bluetooth connectivity where it will collect the signals and transmit them to the Cloud storage database and the end users
Noise Removal during signal acquisition
- When it comes to ECG signal it has been corrupted by different types of noises
- The most common noises are
- The baseline wander
- Motion artifacts
- These noises are added due breathing and movement of the patient
- Baseline noise is a low-frequency noise that could be removed by using a High Pass Filter(HPF)
- Due to the relative motion of electrodes with the movement of the subject motion artifacts occurs
- It can be removed by the Low Pass Filter(LPF)
- The noises are then filtered using the digital filtering techniques such as Finite Impulse response, because it has several advantages
- To remove the large oscillation in both the pass band and the stop band Kaiser window is chosen for the implementation of the FIR filter
- After this, all the noises would get removed from the ECG signal and will be transmitted to the microcontroller section
- Suitable filters are designed to remove powerline interference and adaptive white Gaussian noise during the transmission of data to the server
- The signals generated by the Thermistor, Heart rate & pulse sensor, and PPG are very low. This would not cause any noises hence can be directly transmitted to the microcontroller for further processing
Communication protocols to transmit the data
- Communication between the wearable units and the receiver unit/user interface is wireless
- Zigbee receiver which works as a coordinator to receive the data
- The received data is then securely transmitted at the remote monitoring station which is a mobile device having an MIT IoT app using the Bluetooth wireless transmitter module HC05
- In addition, this system has an easy fast, and scalable network setup
- The extension of any new sensing unit can be possible
- Arduino microcontroller is a low-power consumption module
- With a built-in UART function for the serial transmission of the data to the HC-05 module for wireless transmission
- After this; the received data is processed and displayed in the mobile app and a special credential is created with "Service Account Email Address" which basically allows the end users to edit the fusion tables without logging in
- MIT app 2022 service account authenticates all the access
Bluetooth protocol
- HC05 Bluetooth is a
- Wireless communication protocol
- Short wavelength UHF radio waves
- It is basically used in 2 devices as a sending and receiving information
- 4 GHz ISM band and the data is basically split in packets before sending and then is shared using any one of the designated 79 channels operating at 1 MegaHertz bandwidth
Zigbee protocol
- This protocol uses the IEEE 802.15.4 standard
- The first two layers add the 802.15.4 protocol and it adds the network and security protocols on top of it
- Provides secure and reliable transmission among devices
-
Technical specifications
- 4 GHz is commonly used
- Communication range is up to 100 m or greater
- Mesh Type of Topology (Nodes, Router, and Processing Center)
- Mesh network ensures uninterrupted connection among devices
- Low cost, high data rates, high network capacity
- Zigbee Network has
- Coordinator
- End device
- Router
- Zigbee Trust center
- Zigbee gateway
Data acquisition and transmission
ECG data
- ECG sensor includes 3 electrodes RA, LA, and RL.
- Two analog filters are added, the first one is a high pass filter and the second one was a low pass filter
- The output pins are connected to the microcontroller to inform if the three of them are working nicely or not
- If any loose connection or disconnection occurs they will send a HIGH signal
- SDN pin is used to shut down the sensor to save the battery
- ECG code partition is basically checked by the attachment of the electrodes
- The microcontroller reads the analog signal and performs the smoothing process in the signal
- Before sending periodically to Google's cloud server through the Zigbee receiver with Bluetooth connectivity the samples are buffered in an array
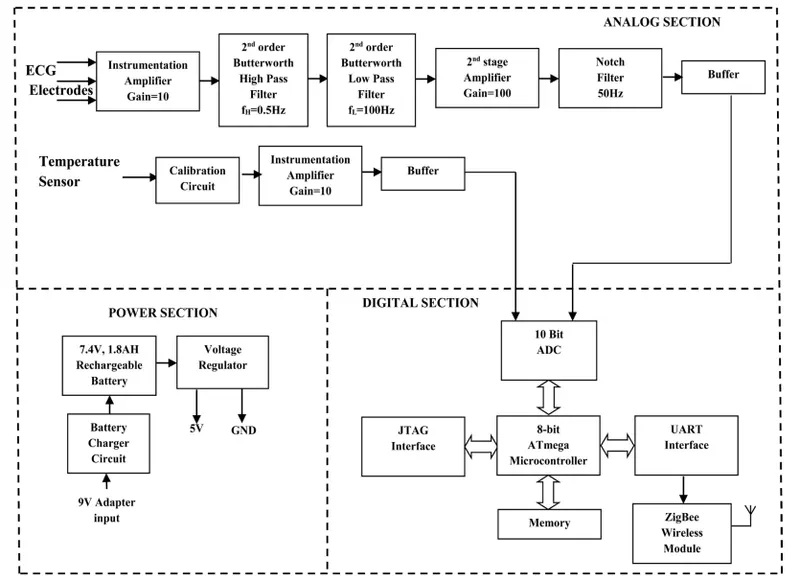
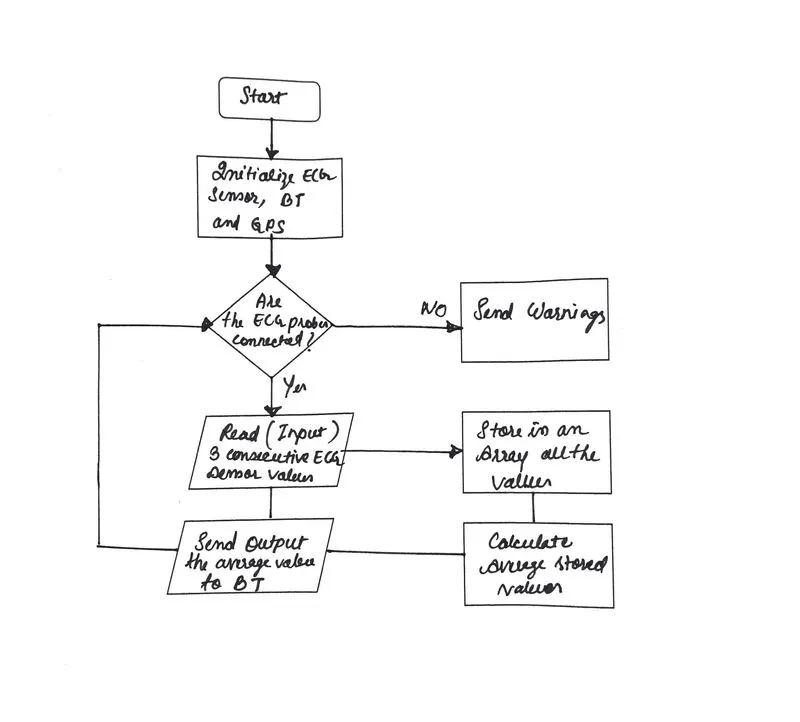
Fig: ECG data acquisition flowchart
Body temperature data
- The sensor is put under the body arm
- Connected to the analog input of the Arduino
- The Arduino imports the analog data from the sensor basically into its analog pin
- After that, it converts the data to a digital value using an internal A/D
- The digital value is then converted to a celsius temperature
- The sensor is able to read temperatures from -55°C to +150 °C and has a 0.5 °C tolerance
- The transmitted temperature value is sent through the ZigBee wireless module to Google's cloud database
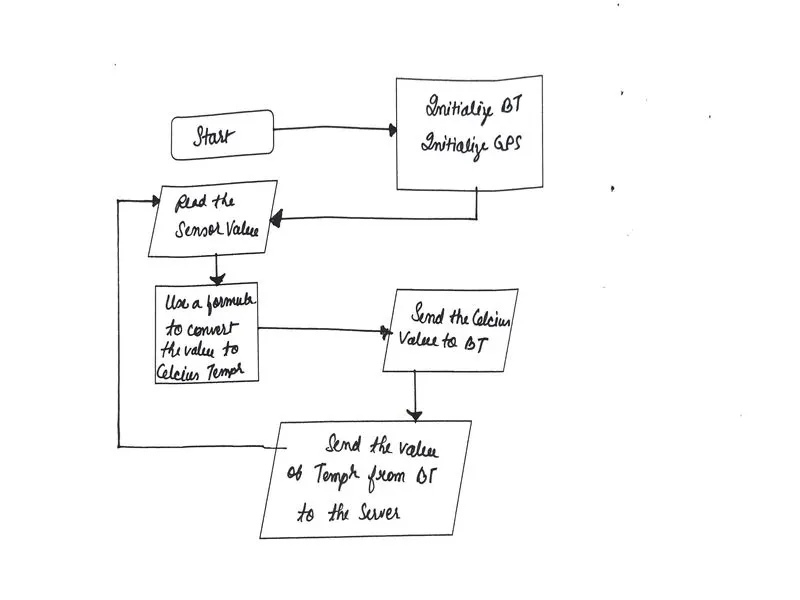
Fig: Body Temperature flow chart
Heart rate and pulse oximetry
- The process describes the calculation of the heart rate beats per minute
- At first PPG wave is filtered by a low pass filter
- Noise waves are reduced to measure the heart pulse rate
- The maximum and minimum peaks of waves are detected
- Two consecutive heart pulses must be correctly detected in order to measure the interval between the pulses
- In an array, the last two intervals will be stored and the median of these two intervals are calculated
- Instead of calculating the average median function is used for the more accurate final value
- The median value is then converted to the beats per minute along with the SpO2 value are sent to the ZigBee wireless module to finally send it to Google's cloud base server
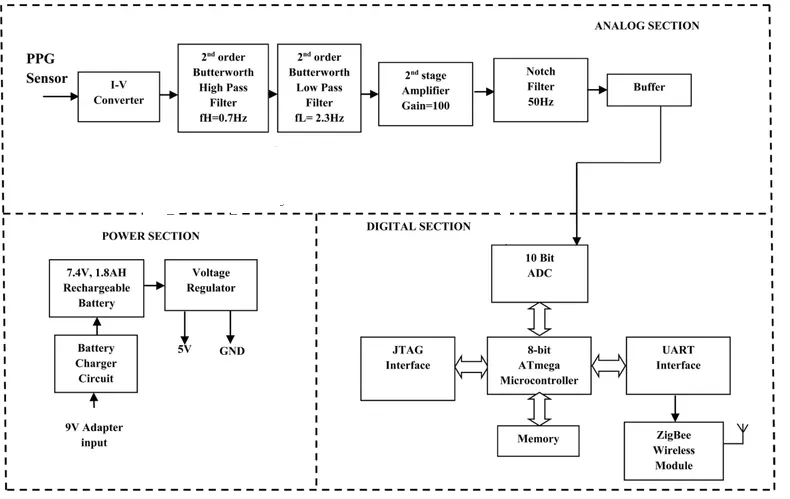
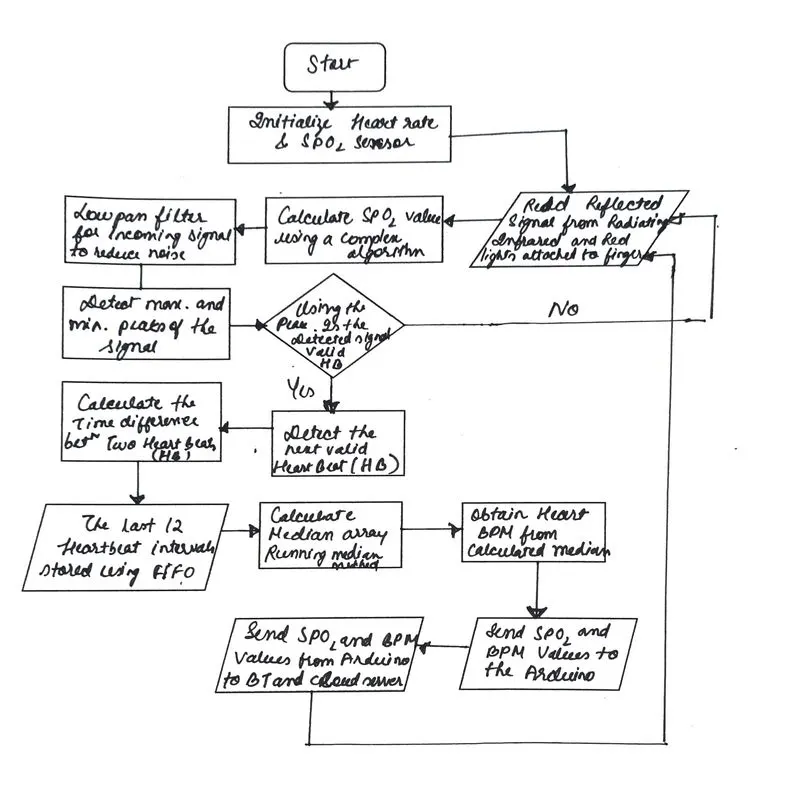
Fig: Flowchart heart rate and SpO2
Blood pressure data
- Two data obtained by the sensors such as ECG signal and PPG signal is used to measure the cuffless blood pressure
- Pulse Transmit Time is measured as the interface between the peak of R-wave of ECG and fingertip PPG signal
- A Matlab code is running on the PC with the GUI interface which is used for calibrating, testing, and developing the cNIBP algorithm
- A peak detection algorithm is used to calculate the cuffless blood pressure
- With an initial threshold, PPG signal is compared and if the PPG signal level is less than the initial threshold there is no peak
- When the threshold value will be equal to the PPG signal the threshold will have the PPG signal value
- Once the peak is detected the threshold is again decreased
- The procedure then repeated until
- all the peaks are identified
- The MIT app allows the user to view the real-time ECG, PPG signals, Temperature signals, and Heart rate values
- The adaptive threshold algorithm is tested on the PPG recordings from the PhysioNet MIT database App
- The systolic and diastolic blood pressure are then displayed in the app and stored in Google's cloud database
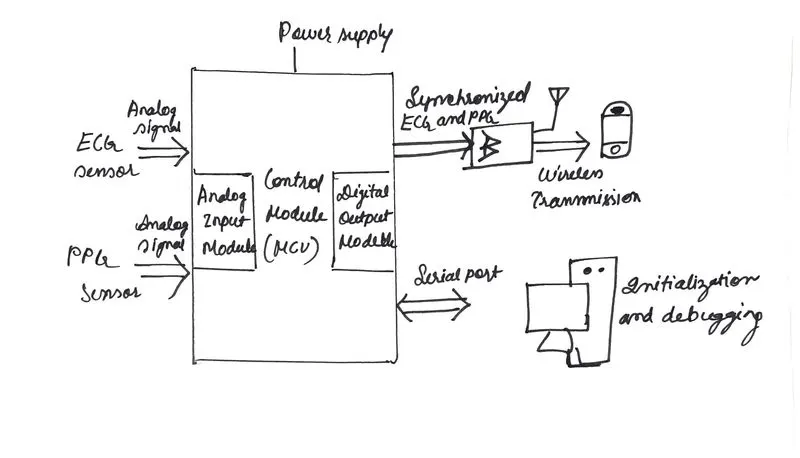
Fig: Data acquisition block diagram of cNIBP algorithm
Sink node
- It is used to acquire data from the sensor nodes
- Sink nodes basically coordinate with remote monitoring station using Bluetooth wireless communication module
- The architecture of the sink node is a star network
- The data is read in a round-robin fashion at a programmed basically predetermined intervals
- At the remote station, all the data is processed after receiving and displayed
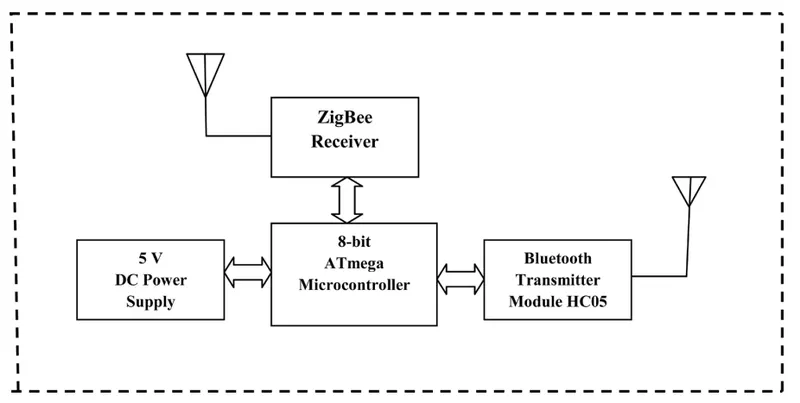
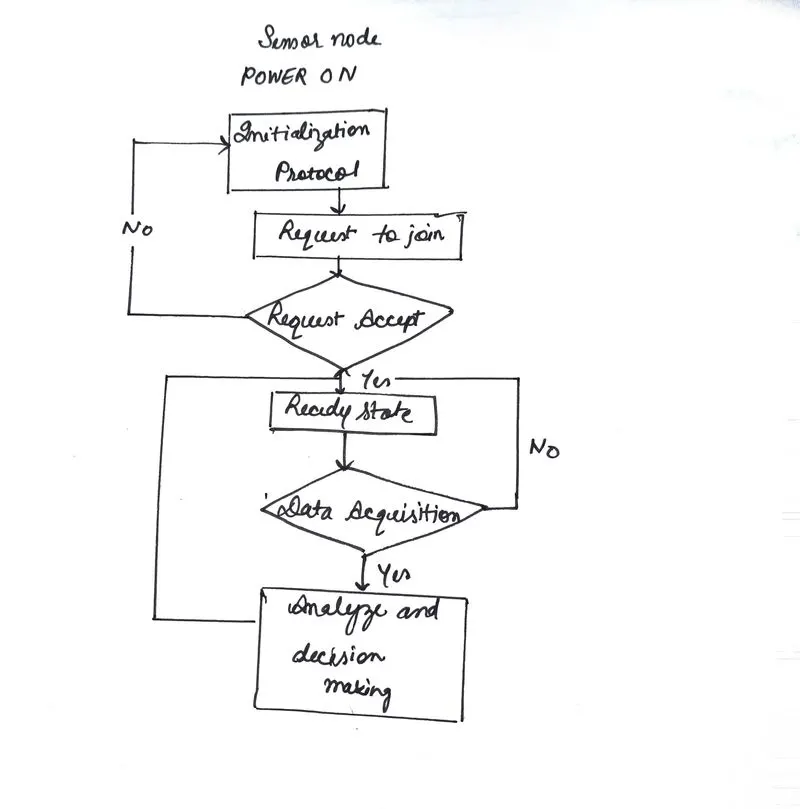
Fig: Flowchart Sink Node shows data transfer from Sensor node to Sink Node
Transmission of the data
- Interfacing and communication
- Arduino Uno is programmed to perform operations like signal conditioning, computing, and analyzing and is responsible for the communication
- The inputs from the sensors are taken and converted into analog to digital voltages
- A dedicated port is attached to each sensor
- All the sensors signals are sampled at a predefined rate using the cNIBP algorithms and Arduino's interrupt-driven algorithms
- The data obtained is then directly transmitted to the Zigbee wireless receiver module with Bluetooth connectivity
- The Arduino module has a UART function for the serial transmission of the data to the HC-05 module for wireless transmission
- After this; the received data is processed and displayed in the mobile app and a special credential is created with "Service Account Email Address" which basically allows the end users to edit the
Cloud Computing Approach and Special added features
- The developed app basically runs on an android platform which is capable of storing the received parameter values of different physiological signals on the smartphone itself in a local tiny database
- A set value of the parameters is stored in the app where the received parameter values are compared in case of any medical emergency of the patient
Special feature
- The alert message is automatically sent to the family members, friends, and doctors whoever's phone number is registered in the app, and also SIP based emergency call triggering system is configured with the system to send the immediate call to 911
- The messaging system is achieved by using the normal SMS device of the mobile for the communication
- The alert system contains the GPS location of the person which will help to track the person
- It is specially designed for the Elderly and blind people
- The app was developed using the open source MIT App Inventor 2 platform
- The mobile must be internet enabled over Wifi or mobile for the app to transfer these details to the cloud store database
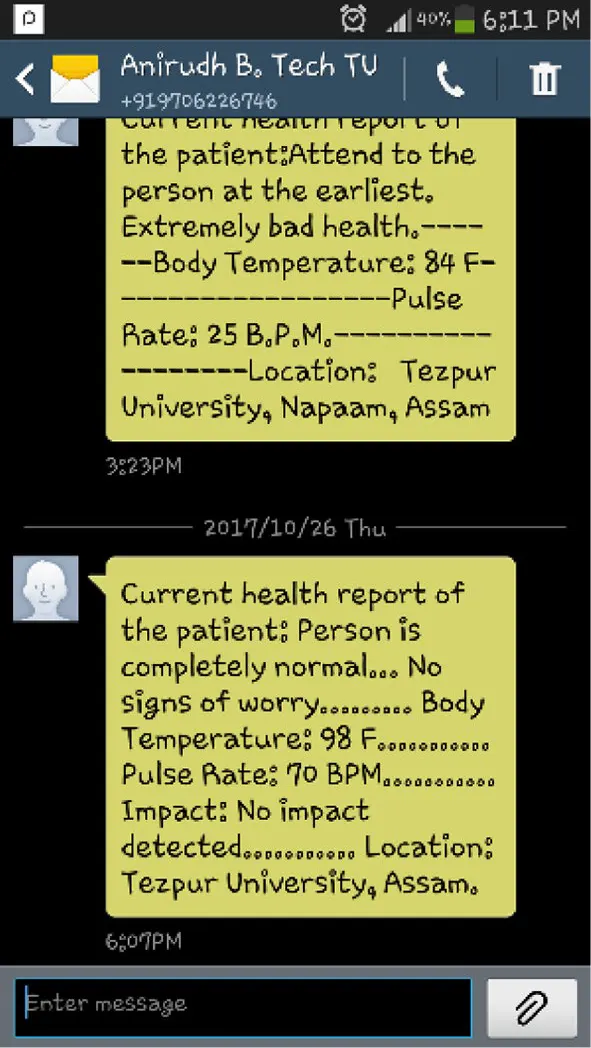
Fig: Received text message in emergency and abnormal condition
Online Cloud Storage Database
- Google Fusion Tables hosted the online database
- All the data are stored in public tables which can be accessed via the Google drive
- It allows different users to add their information to the public tables
- Fusion Tables API V2.0 facilitates
- Storage
- Sharing
- Query
- Visualization of data tables
- Fusion tables require the authentication of Google's Servers
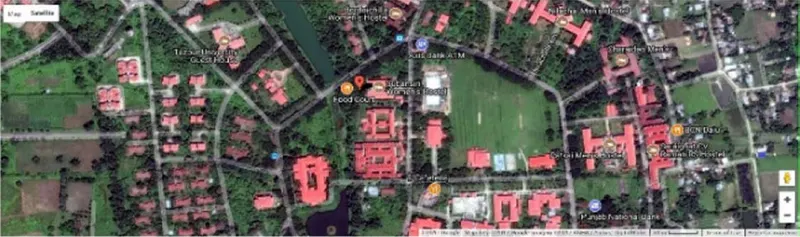
Fig: Screenshot from google Fusion Table for location
- An API key is needed which the app developer has to authenticate
- It will help the end users so that they must log in to access the fusion table
- Service Account Email Address - a special credential is added which allows end users to edit the Fusion Tables without logging themselves in
- The service account authenticates all the access
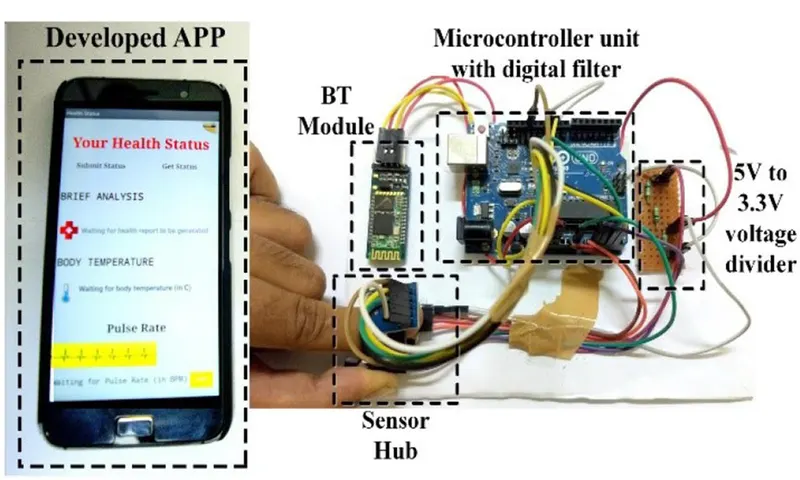
Fig: Developed IoT App
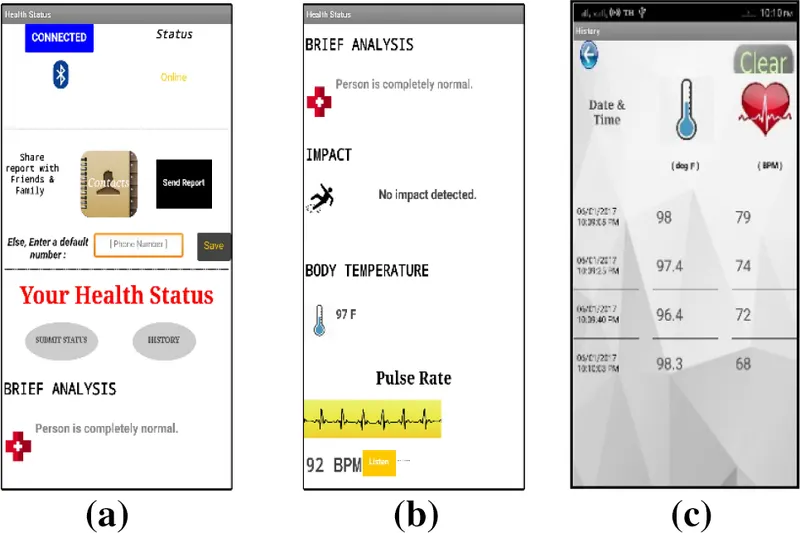
Fig: Screenshot of the App layout a)Upper half b)Scroll down to display the physiological parameters c)Local database
Emergency situation handle
Fall detection Function
- Impact sensor
- ADXL35 accelerometer sensor was used to detect the impact
- 3 axis acceleration measurement system
- Range of +_3 g minimum
- Measure the static acceleration of gravity in tilt sensing applications
- It also measures dynamic acceleration resulting from shock, motion, or vibration
- The accelerometer was basically placed in the bands for prompt detection
- Scenario
- An elderly patient has fallen
- The sensor tracks the physical movement of the patient and it monitors whether there are any cases of falling or sudden impacts on the subject's body
- In 3 different axis, the acceleration value was read with an interval of every 2 ms
- The magnitude of the difference is compared with the two consecutive sets of readings that were measured
- Then it was compared with the threshold value to detect the impact of a significantly large magnitude
- Experiments were conducted to set the
- Threshold value
- Rest accelerometer readings range from
- 00 to 10.50 m/s^2
- During free fall acceleration value becomes less than 9.00 m/s^2 and it rises above 11.00 m/s^2
- The sudden sharp peak can be observed during a normal activities like writing or walking
- The above data are used to decide the threshold value for shock or hit to the accelerometer at 15.00 m/s^2 for the proposed system
False alarm handle
- Online monitoring systems are affected by a high rate of false threshold alarms
- All these alarms are caused by irrelevant noise and outliers during the measured time series of data
- A researcher named A. Borowski developed an online signal filter known as "adaptive online Trimmed Repeated Median Least square filter"(aoTRM-LS) to remove false alarm signals
- This alarm system is used in the proposed system where in the online system itself false alarms will be removed during the monitoring
- The filter is based on robust repeated median regression which is based on moving windows for varying width
- The validation of the system can be done offline using the reference database
- All the sensitivity and the proportion of false alarms are basically suppressed by the signal filter
Fig: aoTRM algorithm
Fig: The diagram shows the measurement of the mean arterial blood pressure and the RM signal extraction
Scheme for centralized data storage and retrieval
- Electronic Health Record
- It is an automated and centralized database
- A single management system can receive submissions and helps in optimally managing queues
- It tracks staff members' activity via their smartphones
- The proposed IoT system enables tracking availability and status of medical equipment and beds in ICU
- There is an online database known as Google's Cloud database that is also used for data storage and retrieval but here the question is asked about centralized data storage and retrieval hence further discussion on the data retrieval is given below-
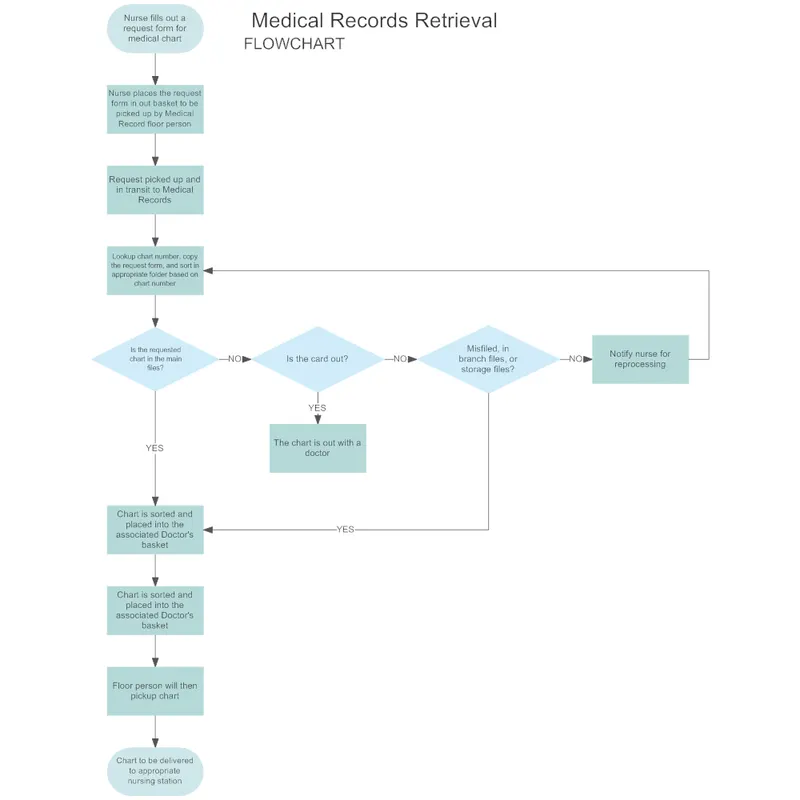
- EHR data retrieval
- At the first, the nurse requested the medical chart
- The request is received by the medical record floor person
- The processed request is picked up and sent to the Medical records
- After that, it will sort out in the appropriate folder
- If the chart is out it can be with a doctor or if the details are misfiled in branch files then it will notify the nurse for reprocessing
- But if everything is correct then the chart is sorted and placed in the associated doctor's basket
- The medical record floor person picks up the chart and delivers it to the appropriate nurse station
- EHR data retrieval
Algorithms for automatic detection of abnormal conditions in the parameters and generation of alarms
The detection of abnormal conditions in our proposed system parameters is done by the impact sensor which sends the signal through SMS alarms to the patient's friends, family, or doctors.
But as the question asked above if we have to design an algorithm for automatic detection of abnormal conditions in the parameters and generation of alarms then I would design it according to the design algorithm developed by the researchers Moulik and Majumder from NIT Meghalaya
FallSense algorithm
- This algorithm uses the benefits of an IoT-enabled environment like we have designed and is consist of a number of infrared transceiver pairs, accelerometer, and ultrasonic pairs
- System architecture
- Infrared emitter
- Photodiode receiver
- Ultrasonic sensors
- Accelerometer
- The FallSense basically fuses the data from multiple sensors
- It becomes oversure before inferring that the fall has occurred in the patient
- FallSense generates the value of 0 and 1 depending on the multiple inputs from the sensors. This value signifies the chance of fall
- After falling if the algorithm detects that it exceeds the predefined threshold of the Fuzzy inference system input(objects distance, resultant acceleration, and number of cuts) then it generates an alarm notification to the end users device
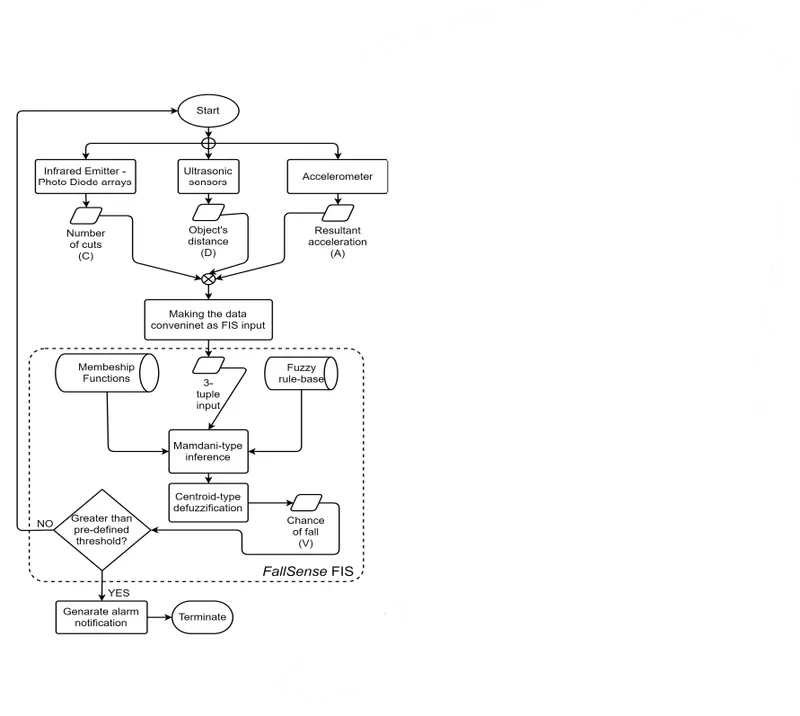
Fig: Flowchart of the FallSense Algorithm
Data encryption and security methods for the IoT
- The healthcare system basically works with a secure cloud computing
- In our proposed IoT system it has 128 bits Advanced Encryption Standard technique which will encrypt the information of patients and securely store in the cloud database
- Those people who are authorized can only access the cloud data with the login pass key
- The log-in pass key has the capability
- To decrypt the cloud data in its original form
- This method secures the IoT-based wearable healthcare monitoring system that we have designed
- The secret pass key that has been used should be of similar length on both ends due to which the privacy of the patients will be maintained by the system
- The doctors and the permitted users only will be able to have permitted access to the reports of patients by the patient's ID
- The Advanced Encryption Standard is a US government standard for securing and arranging the information in the encrypted and decrypted form
- Till this date there are no practical cryptanalytic attacks have been observed against the AES encryption because the 128-piece encryption might adequately the data and no one can hack this data
- It is 6 times more secure than today's 56 bits Data Encryption Standards(DES)
Device certification plan
Medical Devices Regulations
- All the wearable devices are to be certified by medical device regulatory bodies
- Food and Drug Administration (FDA) and other certifying agencies for medical device safety like International Electrotechnical Commission (IEC), Underwriters Laboratories (UL), European Standards(EN), Medical device standards in India, and other applicable safety standards
- The use of non-certified devices will lead to a wrong diagnosis and may put the patient's life at risk
- ISO is the international organization for the standardization of a device
- There are various classification forms available for medical devices in India such as
- For improper
- For manufacturer
- This includes
- Clinical investigation permission
- Import/Manufacturing license and
- Test License
- Medical device registration in India
- The main regulatory body for pharmaceuticals and medical devices in India is Central Drug Standards Control Organization(CDSCO)
- The Drug Controller General of India
- Key official
- Step-by-step process of Medical Device registration certification in India
- Step 1
- Determine if the product requires registration
- Step 2
- Appoint an Authorised Indian Agent
- Step 3
- Submit the Regulatory Dossier under form 40
- Step 4
- After document submission, the CDSCO will get back to the agent with a query letter in about 3 months.
- If the queries asked by CDSCO will be answered then a registration certificate will be issued
- It will be valid for,3 years
- Step 5
- To obtain the import license form
- Form no. 10 should be applied at the CDSCO by the distributor immediately
- With the registration number, the import license form needs to be filled up
- Step 6
- Marketing in India
- Once the import license and registration certificate are issued the product can finally enter the Indian Market
- Marketing in India
- Step 1
The working of the prototype system
10 number of users connected to the hospital
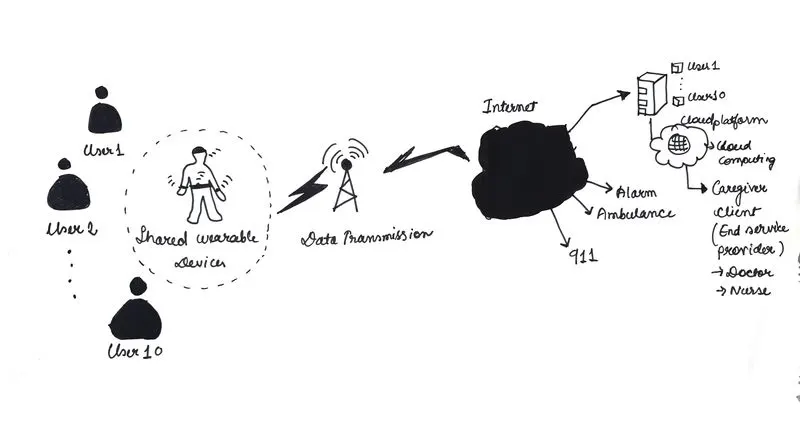
- As we can see from the diagram given above there are 10 users who shared the wearable physiological health monitoring system
- At first, data is transmitted via Bluetooth connectivity to the server
- The advantage of this system is that the currently monitored person can be identified automatically by the wearable device monitoring system
- The user interface platform is used in this system
- The server has the store data of the users which can be uploaded to the Hospital Cloud Platform or can be observed by the caregiver client
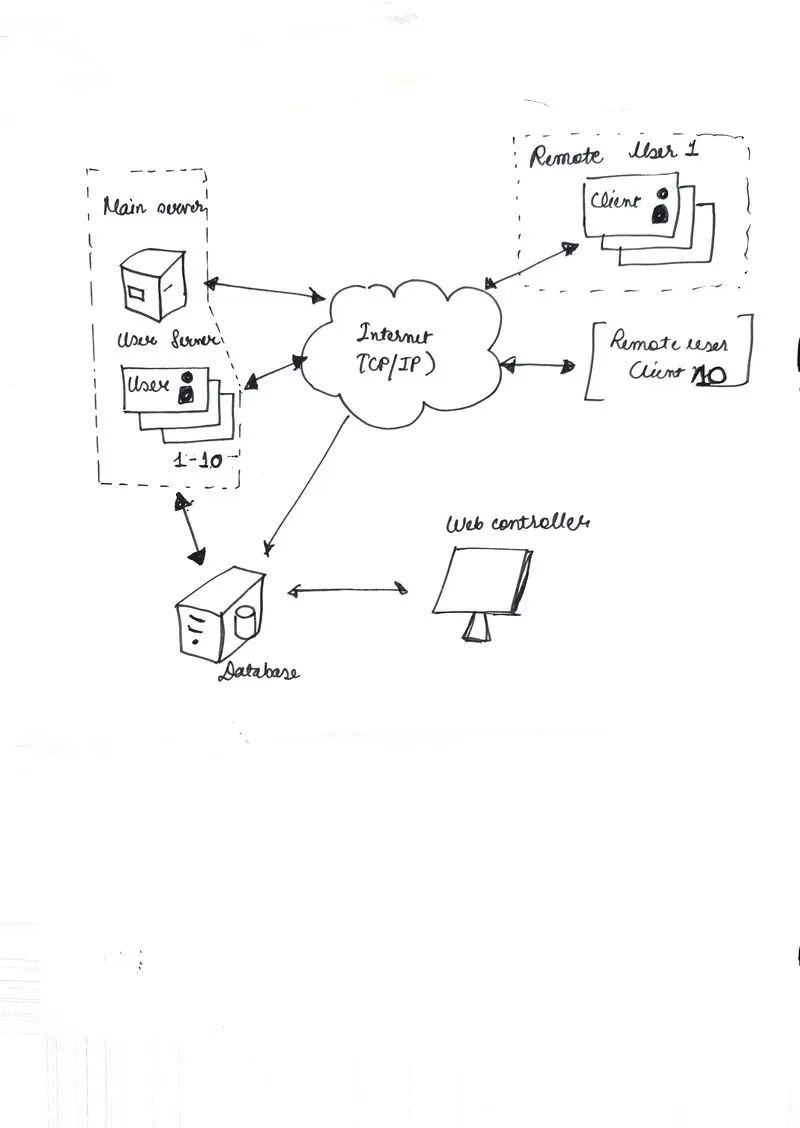
Fig: Workflow of the client-server network
- It works as a PHP (Hypertext preprocessor)client-server network and TCP/IP internet protocol
- The server has the user information of 10 patients
- The client can either be a doctor or nurse or the emergency healthcare person
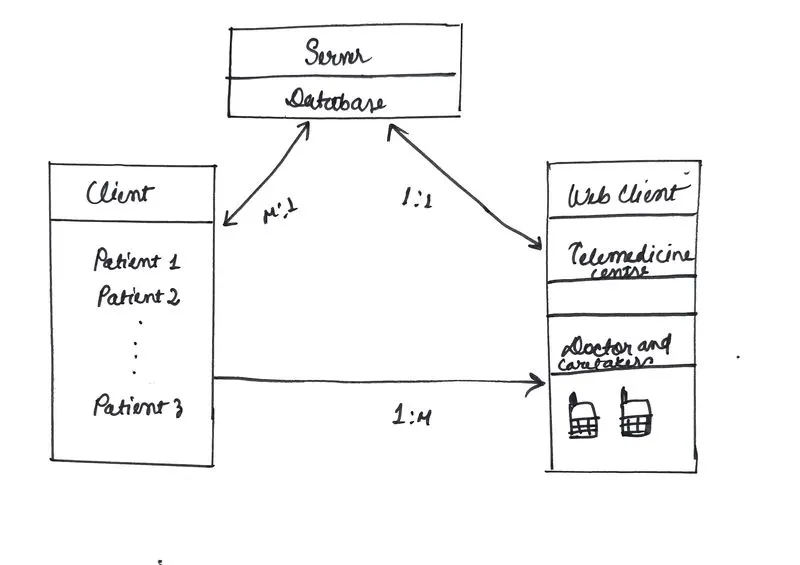
Fig: Server databases working with Client server which behaves as a user server and web client-server
- The user server creates the socket and binds the address (The server associates the socket with the port number)
- The server listens for the client -Wait for the incoming connection
- The number of clients in the client socket connected to the server after the server accepted the connection and the connection was established between the server socket and the client socket
- The server socket waits for a connection from the client socket. Further execution of the current thread is blocked until the server socket receives the connection
- The client sockets send the data requests which are then received by the server socket
- The response and receiving of the signals are called 3-way Handshaking Signals in TCP
- The server socket process the data and replies back to the receiver client socket
- Acknowledgment signal indicates to the server socket that the data was properly received by the client socket destination
- After the successful data exchange both the sockets are closed. The system resources which are allocated for the sockets are released
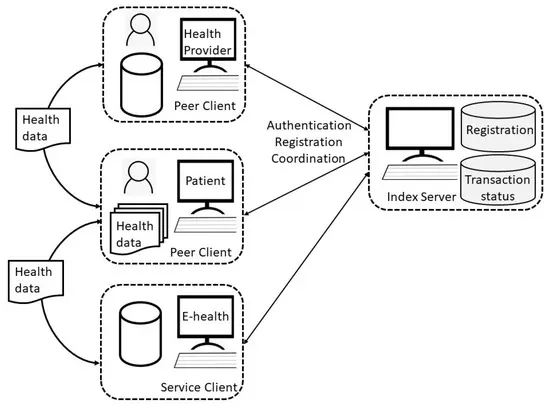
Fig: Authentication registration process of the Health record data
As we can see after the received information the end users may know the condition of the patient. Even the message alarm system and emergency call triggering system are also configured with my proposed IoT system for any abnormalities to be detected and notified immediately
Finally, I can conclude that the device I have designed has the capability to monitor and keep track of the patient if they are medically distressed. It is a battery-powered device and can be easily adapted to monitor infants, athletes, and old-aged people. Further improvements if this work can focus on the integration of units like EEG sensors, and EMG sensors for monitoring the patient's health and on the conversation of the complete system into a basically more flexible substrate
Reference
https://create.arduino.cc/projecthub/156471/smart-health-care-monitoring-system-based-on-iot-f559b3
https://www.researchgate.net/publication/327976264_IoT_Based_Wearable_Smart_Health_Monitoring_System
https://ieeexplore.ieee.org/abstract/document/7870022
https://www.researchgate.net/publication/331811179_IoT-based_Secure_Healthcare_Monitoring_System
Image Source
https://static-02.hindawi.com/articles/cmmm/volume-2011/143480/figures/143480.fig.002.jpg
https://sklc-tinymce-2021.s3.amazonaws.com/comp/2022/08/mceclip1_1661337368.png
https://static-02.hindawi.com/articles/cmmm/volume-2011/143480/figures/143480.fig.004.jpg
https://images.app.goo.gl/VAWuJaXXEMD2Pdcd6
https://images.app.goo.gl/65acK7rfgG49Xr4LA