Project 1_Comparative study of different storey buildings for Seismic forces
The project is executed in two phases. In the first phase, all the building types are modeled with varying cross sections of the columns, elevation, imposed load.
In the second phase, a comparative analysis of the structural results obtained in the first half for effect of Stiffness, Mass, Building height, column orientation, builiding height, imposed load is carried out pertaining to their seismic response.
Phase I: Modelling of Buildings
1. Building type A (G+2)
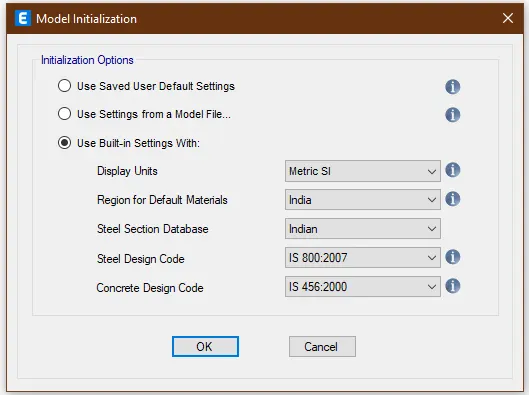
Opening the ETABS software, which prompts to select the Model initiation. Selecting the the initiation as below:
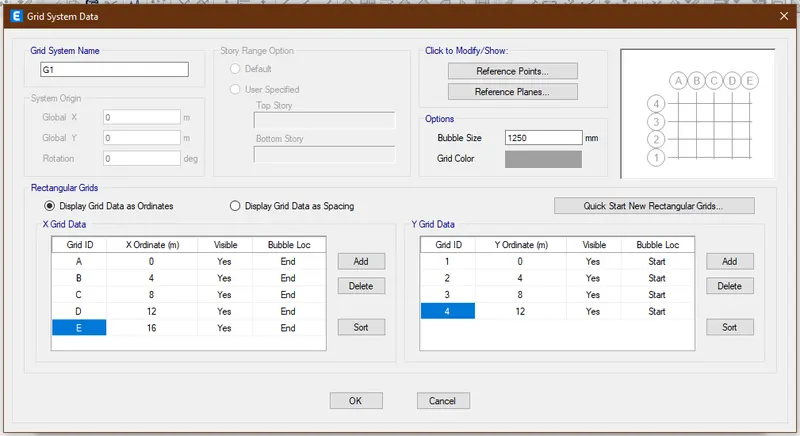
Editing the grid data as per the data given: 4 bays in X direction and 3 bays in Y direction with a spacing of 4 m as below:
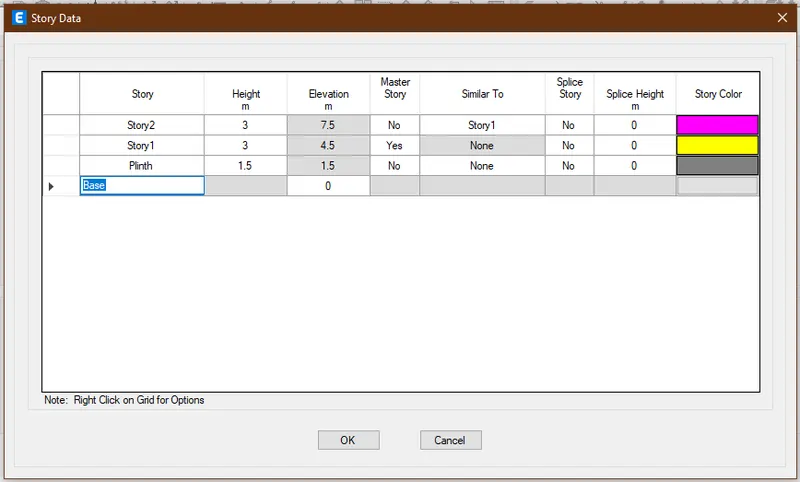
Creating the custom story data as per given data: G+2 story of 3m high spacing with plinth at 1.5m from the base as below:
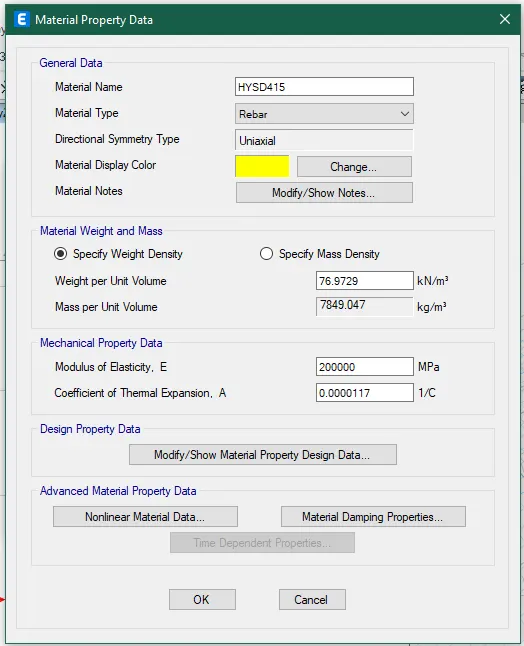
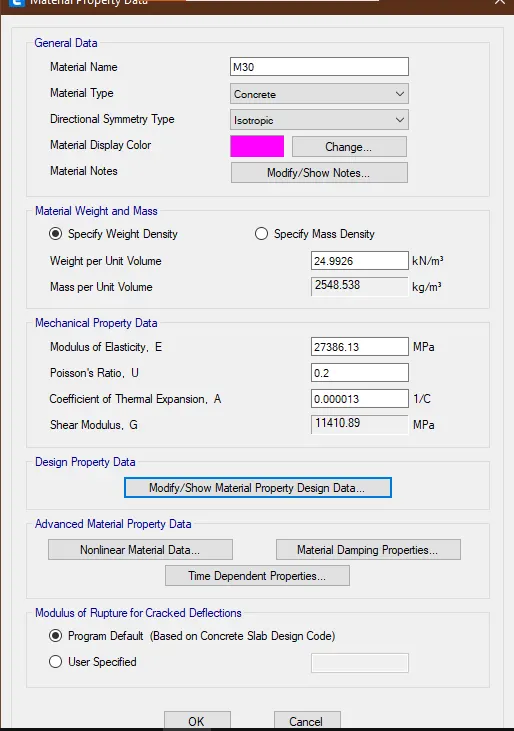
Defining material properties for steel of grade Fe-415 and concrete of grade M-30.
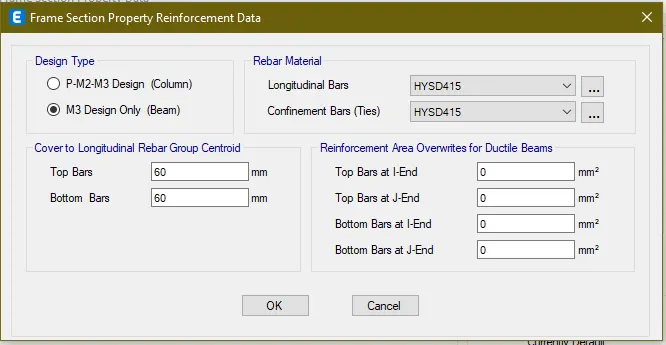
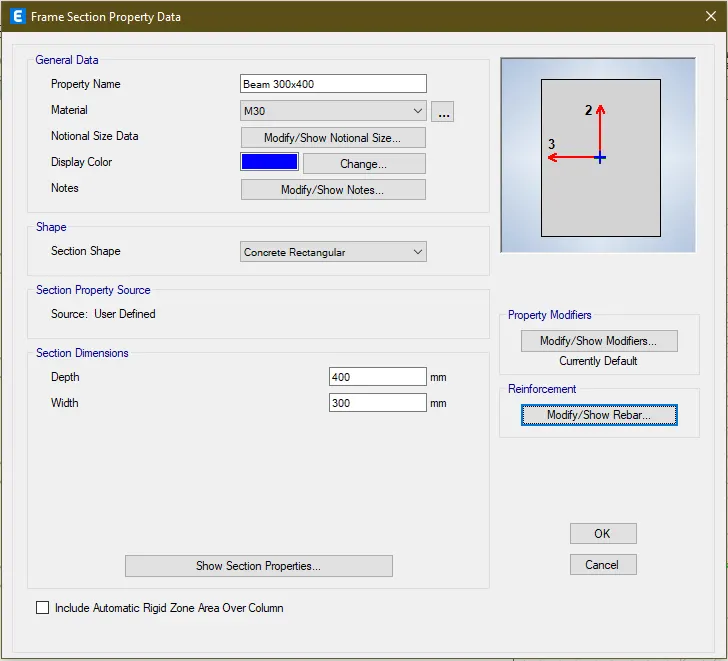
Defining sectional properties of Beam of size (300 X 400) mm.
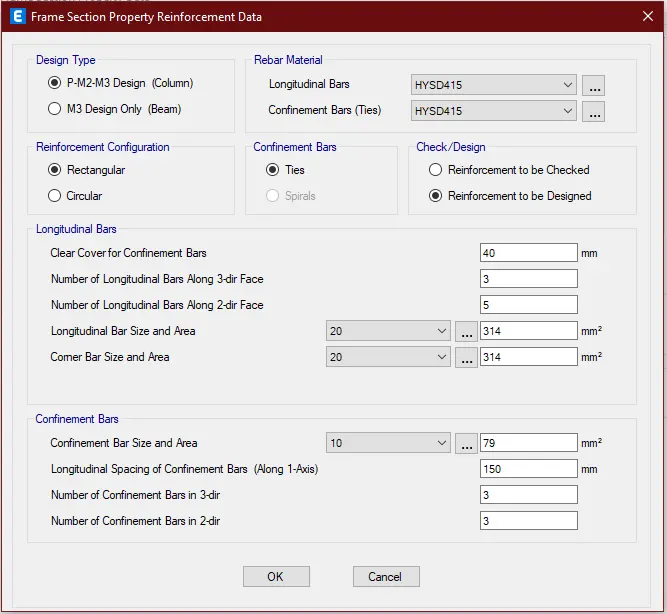
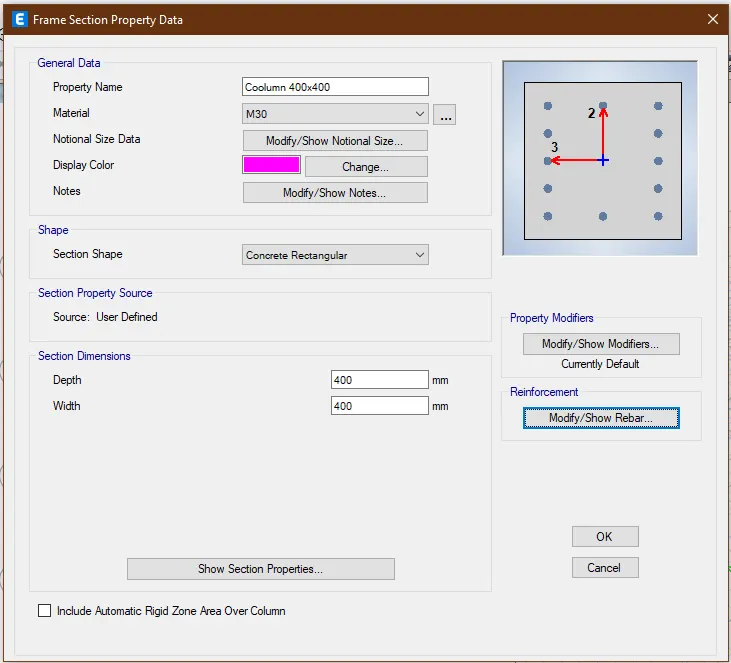
Defining sectional properties of column of of size (400 X 400) mm
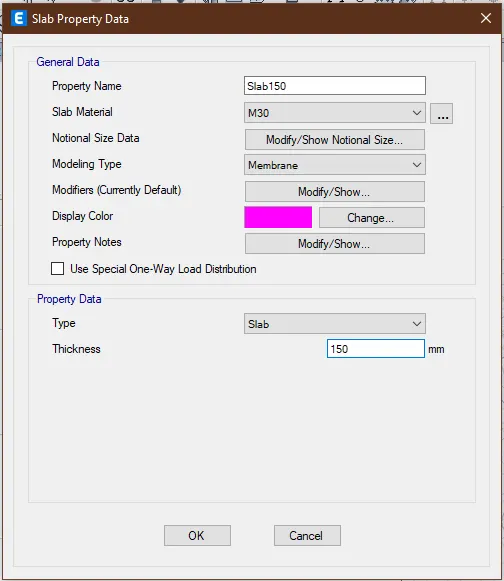
Defining sectional property of slab of thickness 150 mm
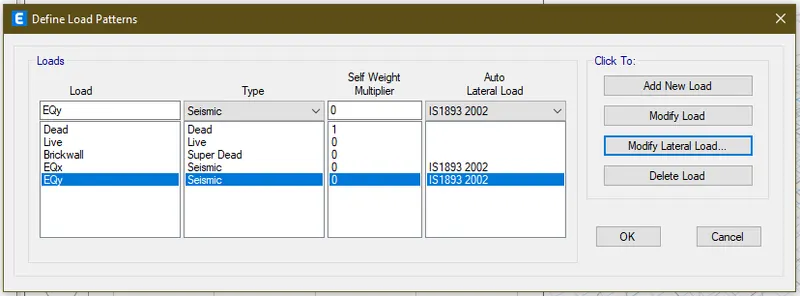
Defining the load patterns as below:
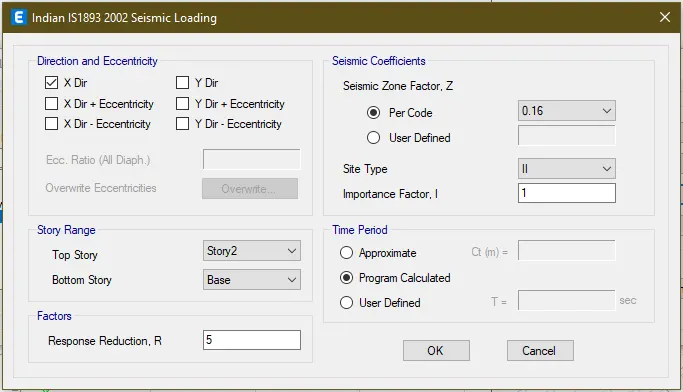
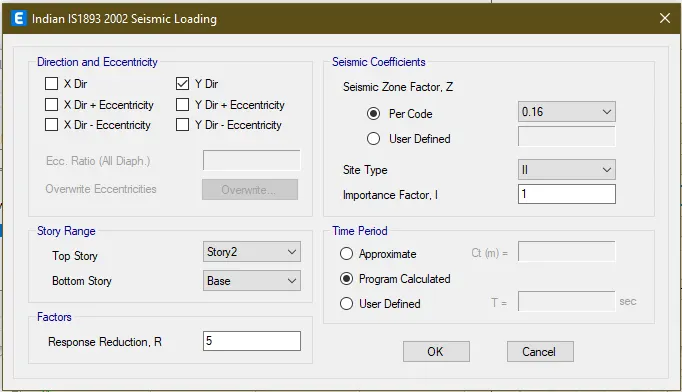
Customising the seismic load for X direction: Seismic zone II and soil type II
Customising the seismic load for Y direction: Seismic zone II and soil type II
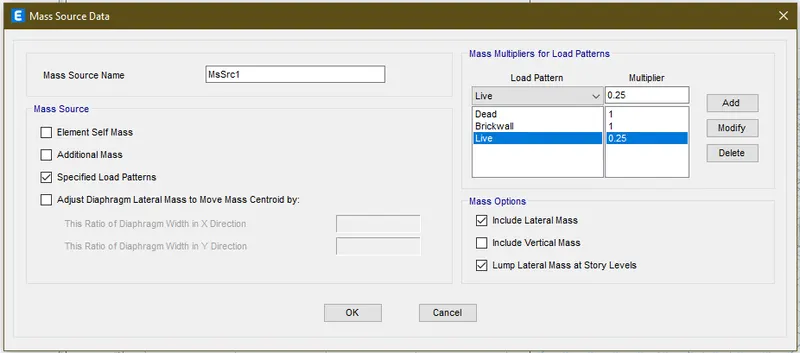
Deifining the Mass source for Earthquake analysis by adding 100% of dead + super dead load. As well as 25% of the imposed load.
Defining the load combinations: 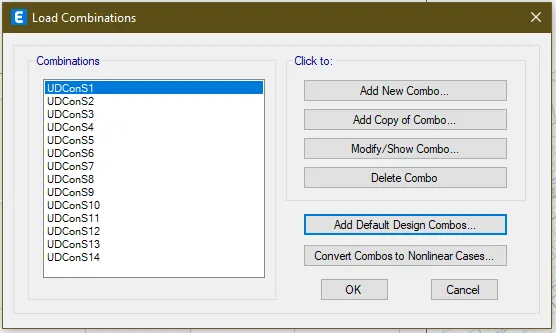
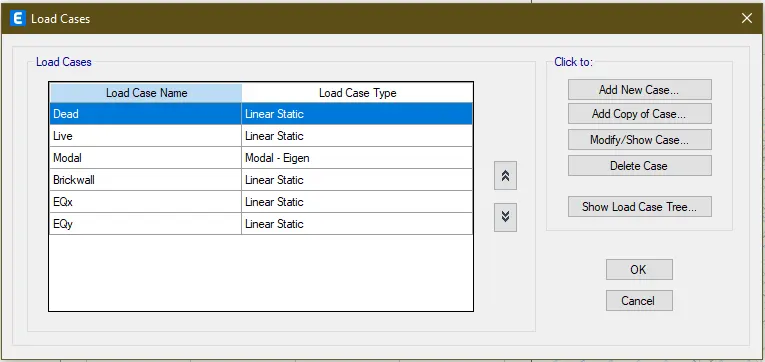
Ensuring the required load cases are in place:
Placing the beams, columns and assigning the flexural properties:
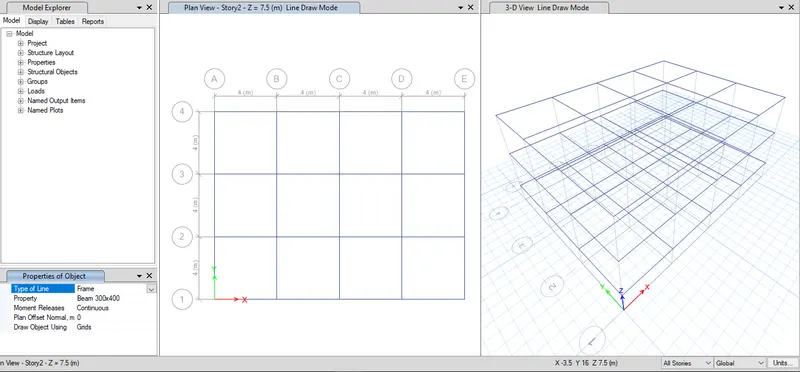
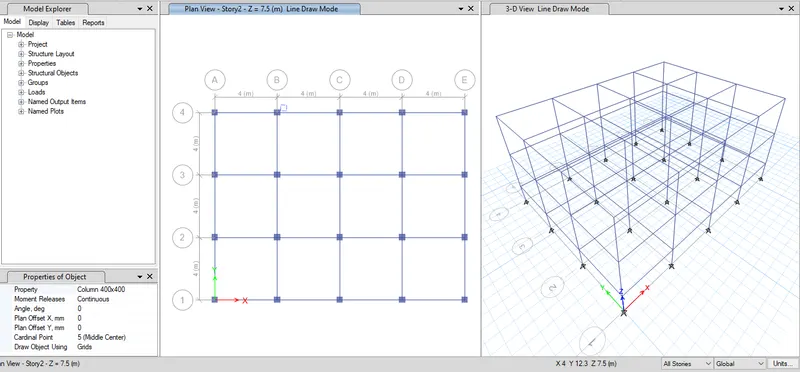
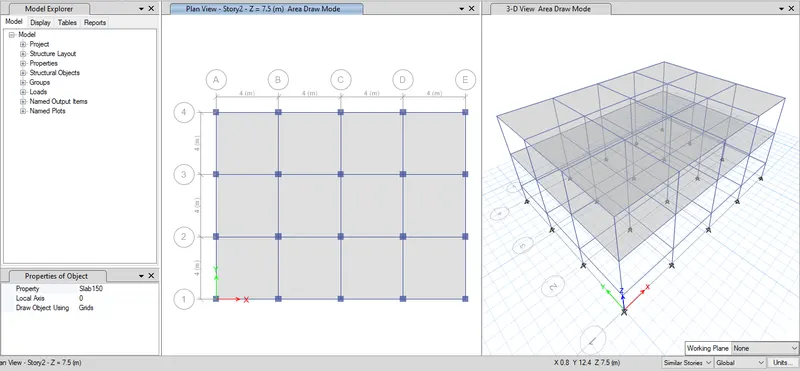
Drawing the slab of 150 mm thickness except for plinth level:
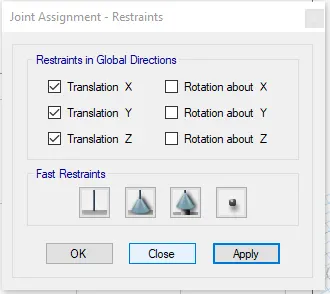
Assigning pinned joints at the base level:
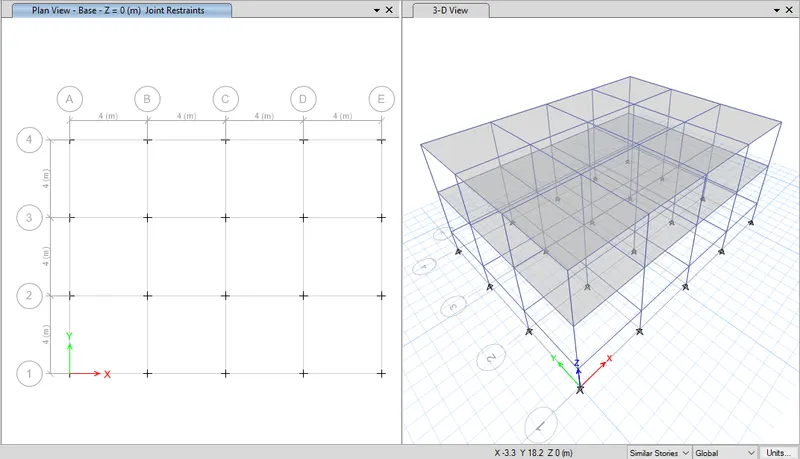
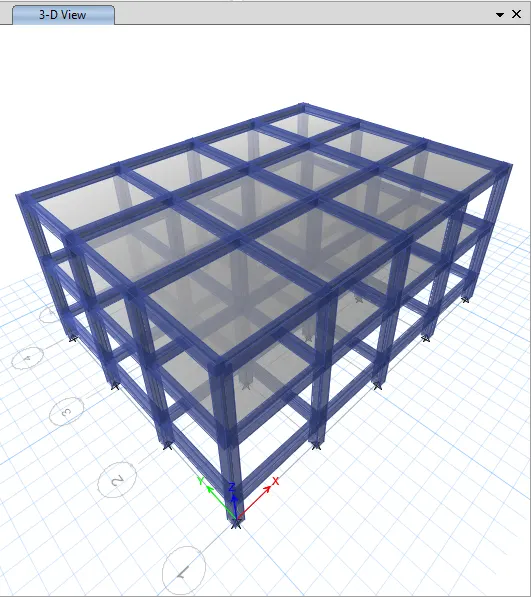
Extruded view of the entire stucture:
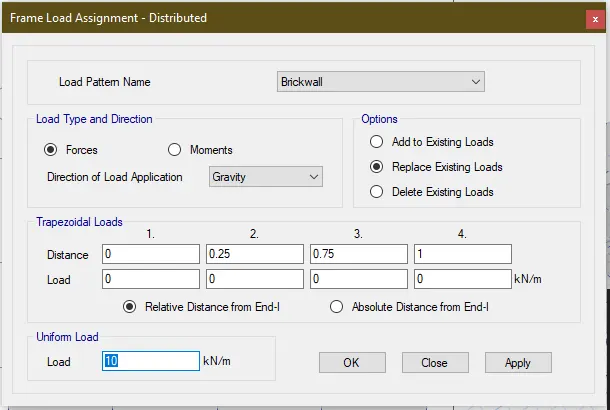
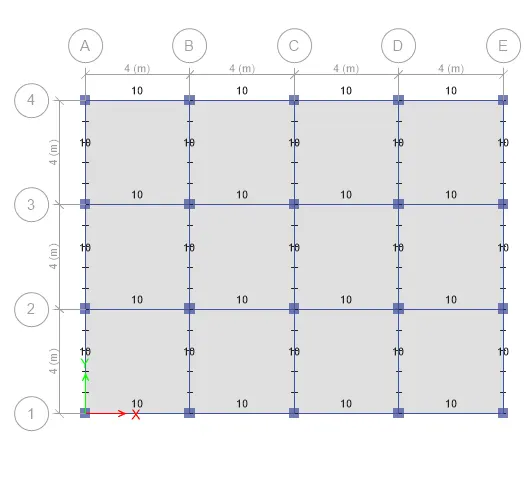
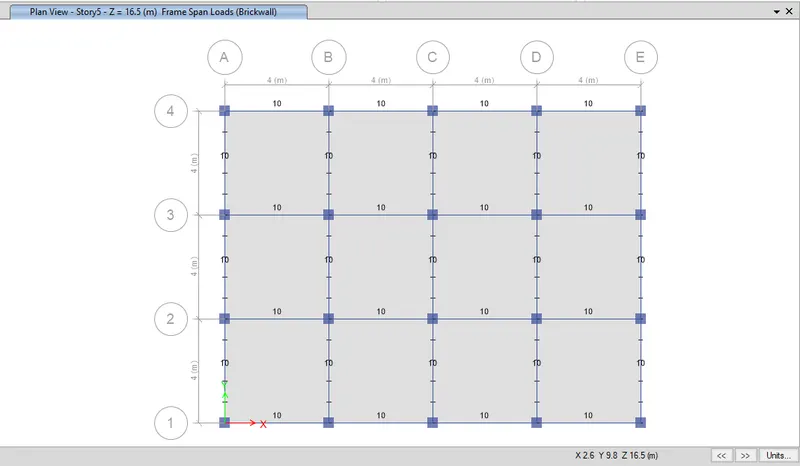
Assigning dead load of 10 Kn/m on the Brickwalls:
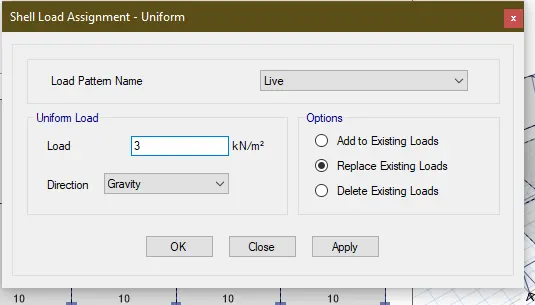
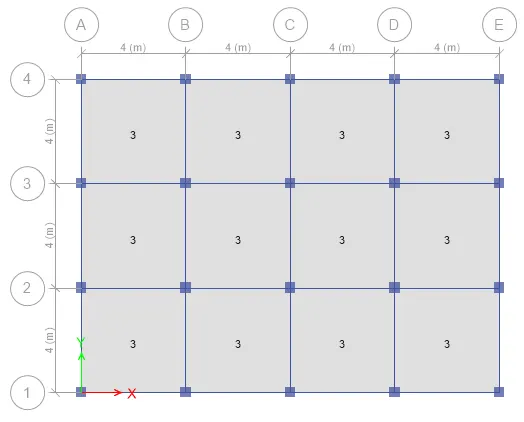
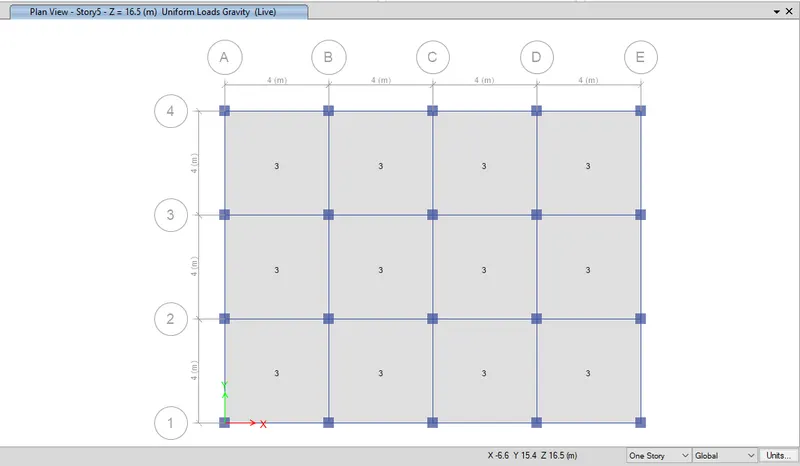
Assigning a live load of 3 KN/Sq. m for all the slabs
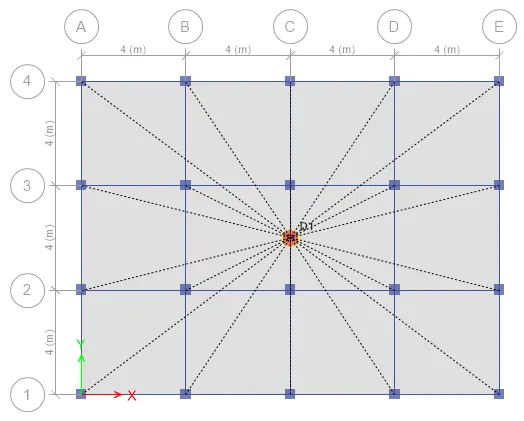
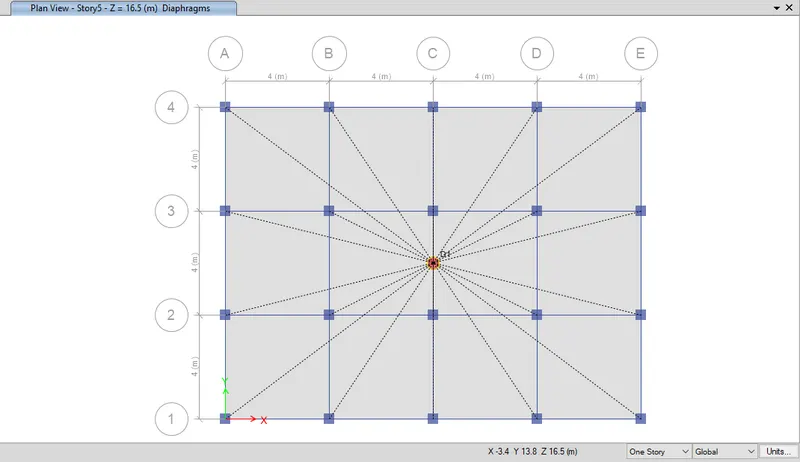
Assigning Diaphragm for all the slabs:
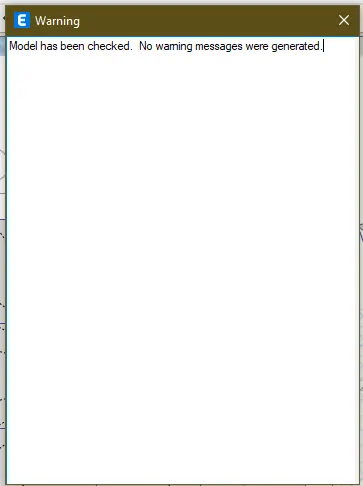
Saving the model and checking it for any errors and overlapping elements:
Running the analysis:
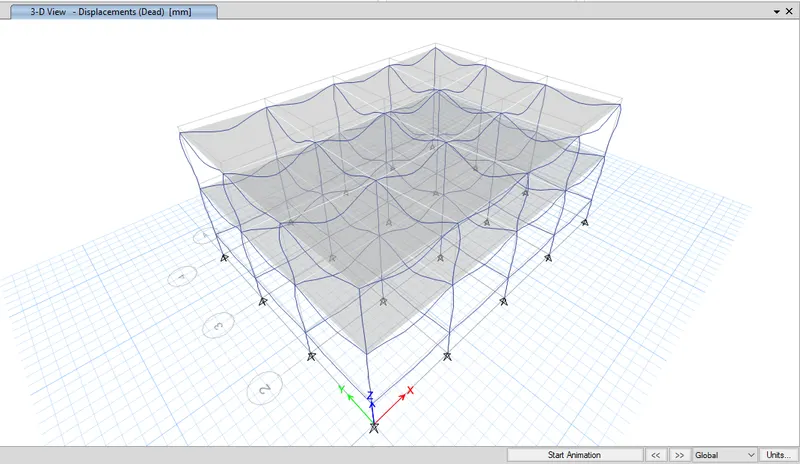
Obtaining the results from the output:
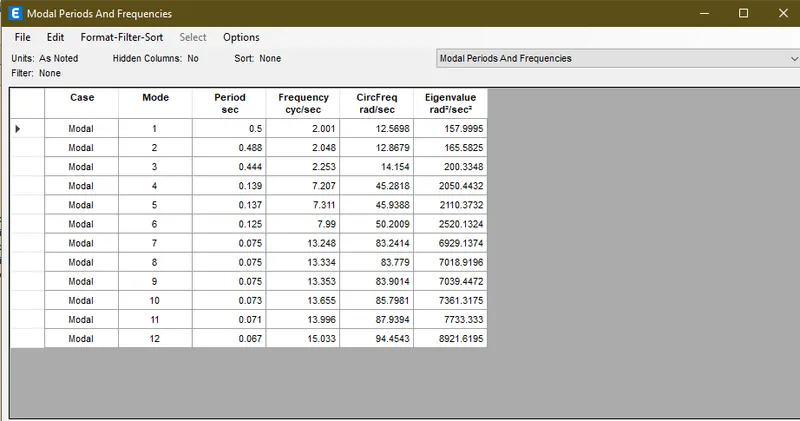
Modal periods for Building A
2. Building type B (G+5)
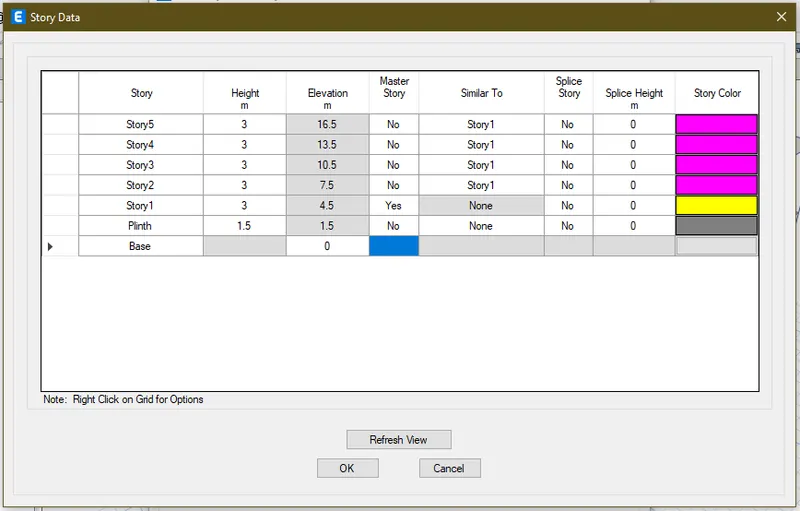
Modifying the story data of the Building type A as below:
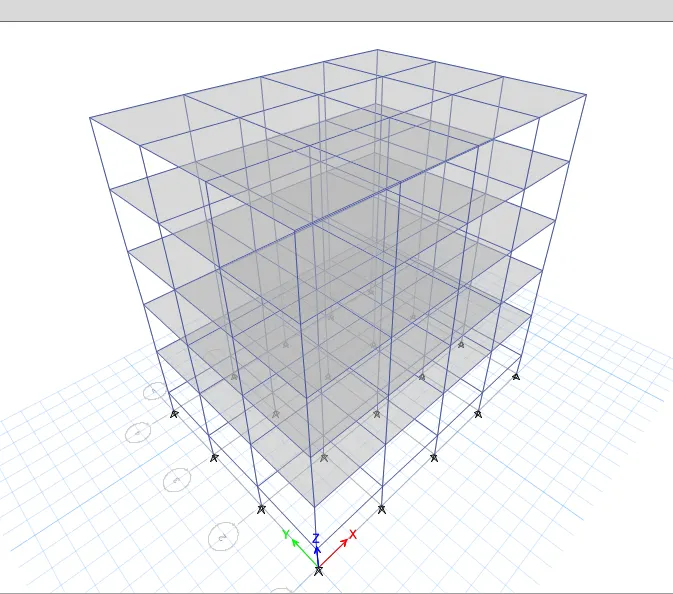
Modified view of the Building:
Checking the Model before Running Analysis for previously applied loads and definitions
Frame loads:
Shell loads:
Diaphragm property for slabs:
Running the analysis:
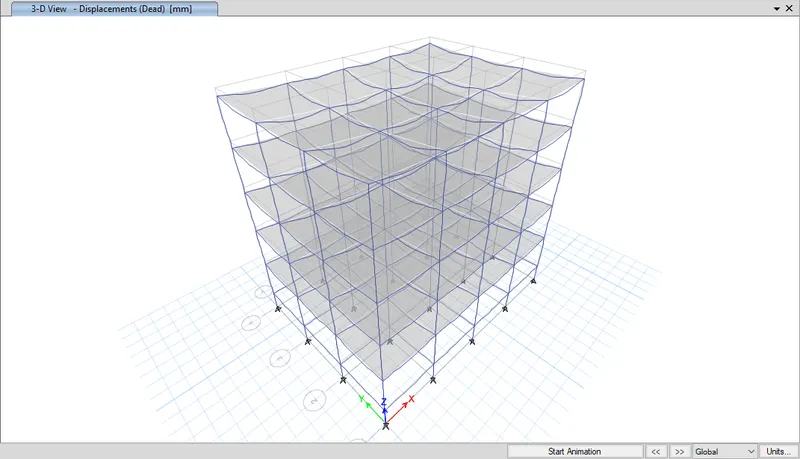
Obtaining the results from the output:
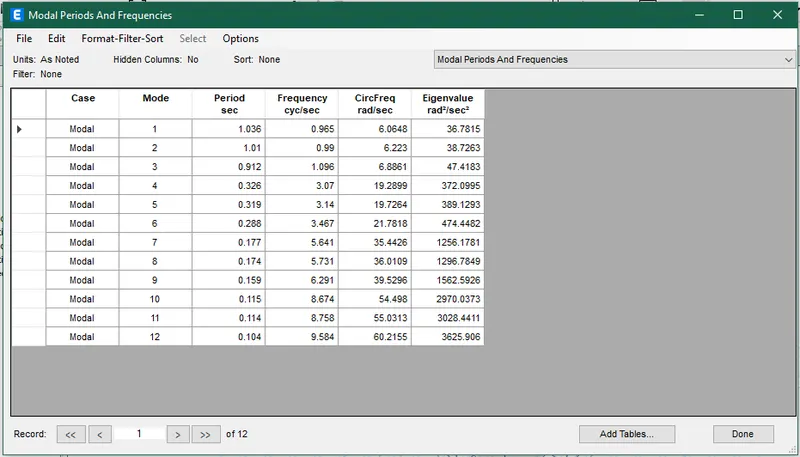
Modal periods for Building B:
3. Building type C (G+5) with column size of (X=550 mm x Y=300 mm)
Story & grid data for Building C will remain same as Building B. Only column size is going to vary as (550 x 300) mm with 550 mm being along X direction.
Creating new column of size (550 x 300) mm
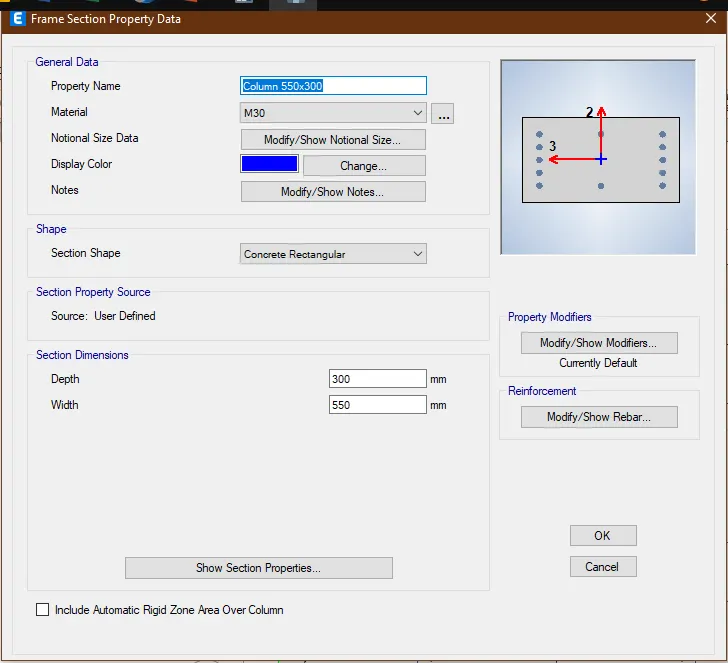
Orieting the longer dimension of the column along X direction.
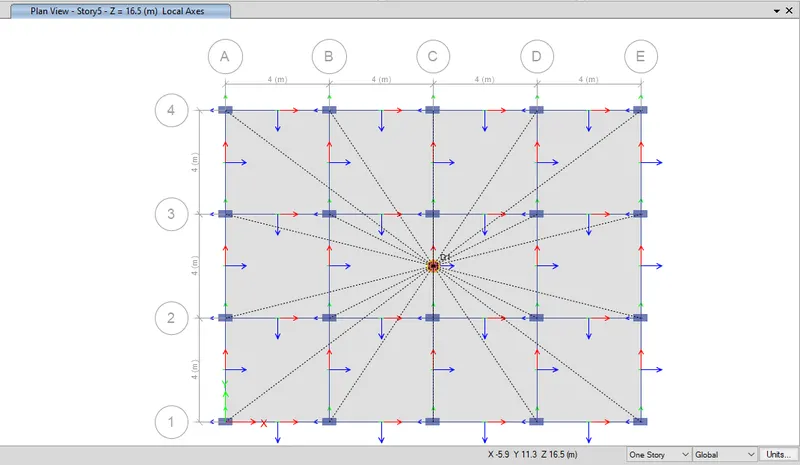
Checking the Model before Running Analysis for previously applied loads and definitions
Frame loads:
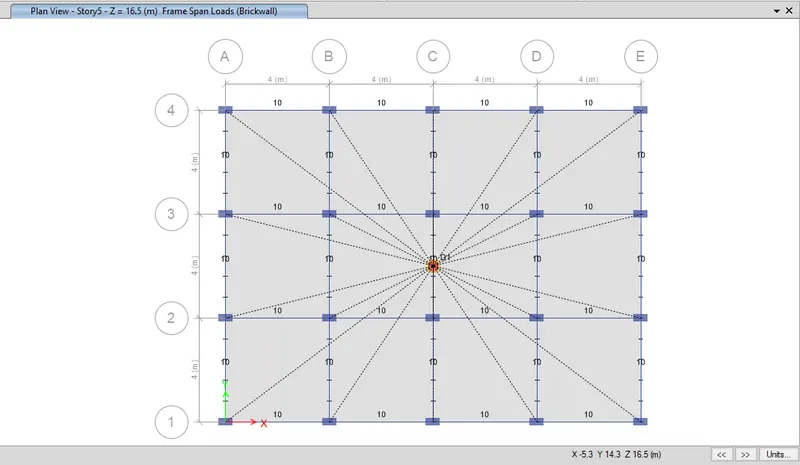
Shell loads:
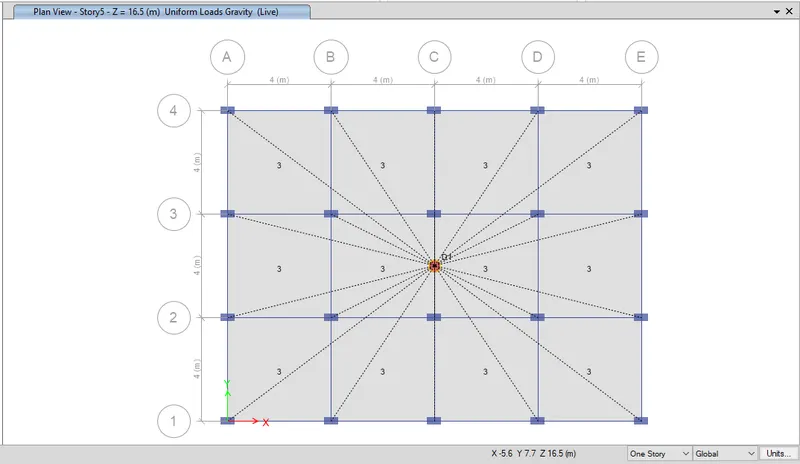
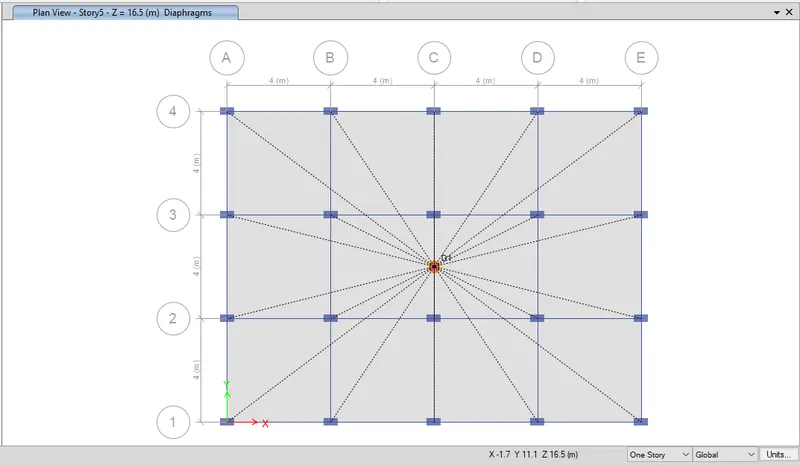
Diaphragm property for slabs:
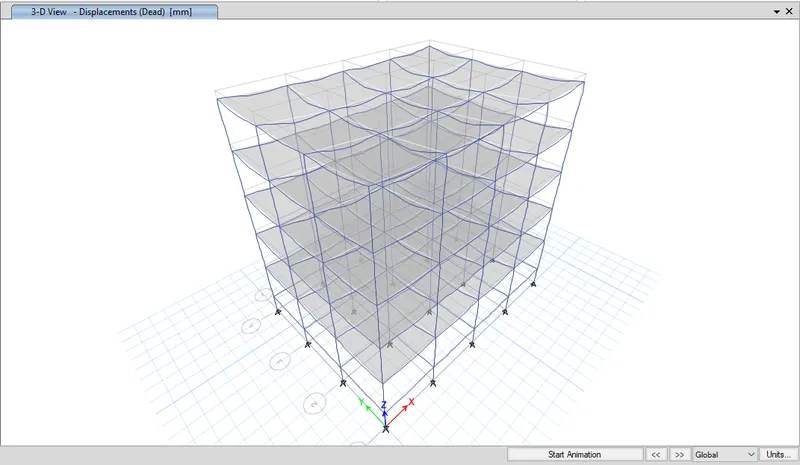
Running the analysis:
Obtaining the results from the output:
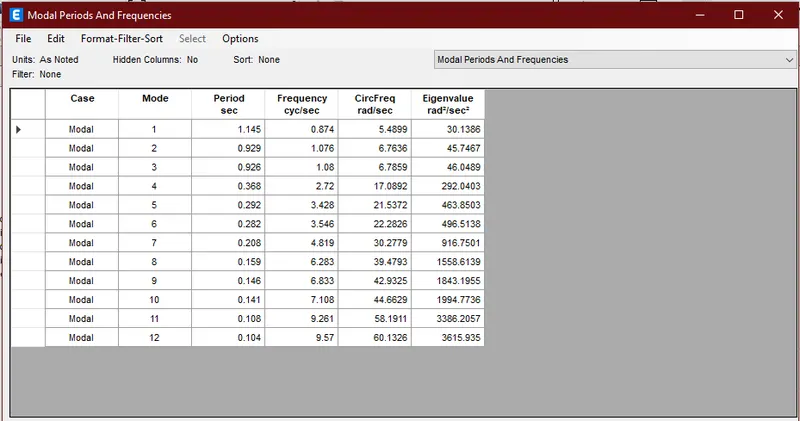
Modal periods for Building C:
3. Building type D (G+5) with column size of (Y=550 mm x X=300 mm)
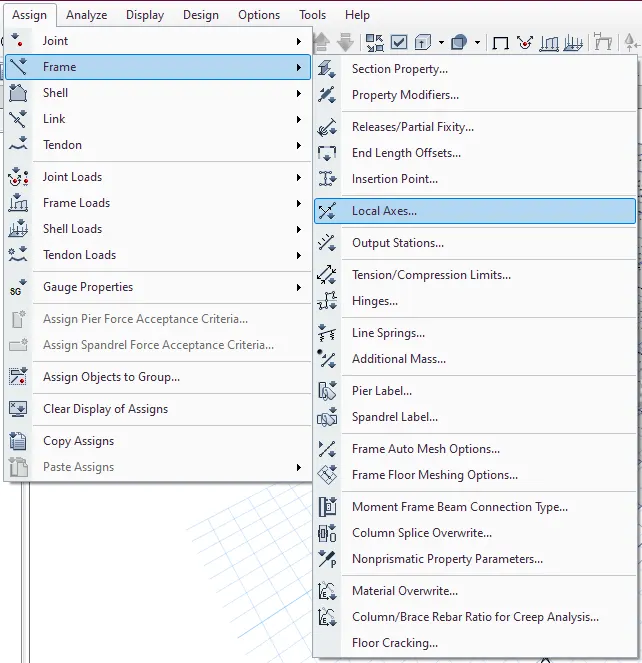
As the column's longer dimension is to be aligned with Y axis, its local axis is changed to 0 from 90 degree
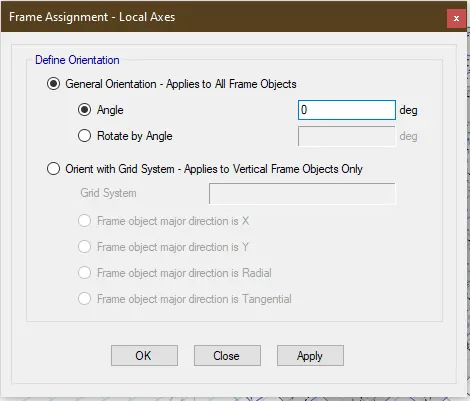
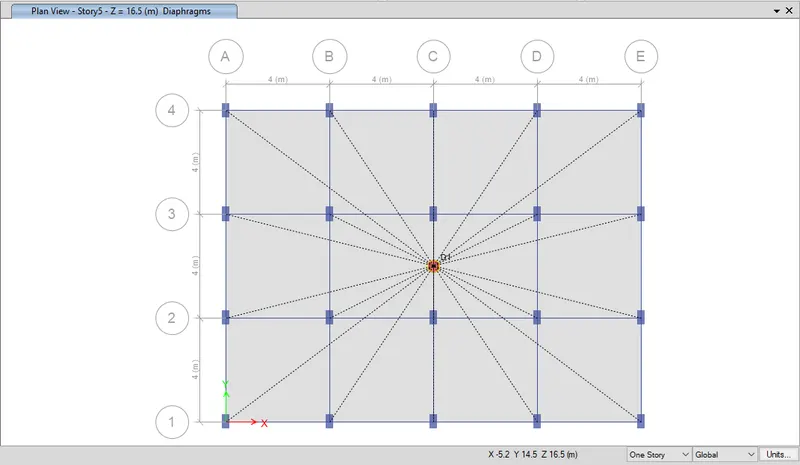
Checking the Model before Running Analysis for Frame loads, Shell loads & Diaphragm.
Running the Analysis.
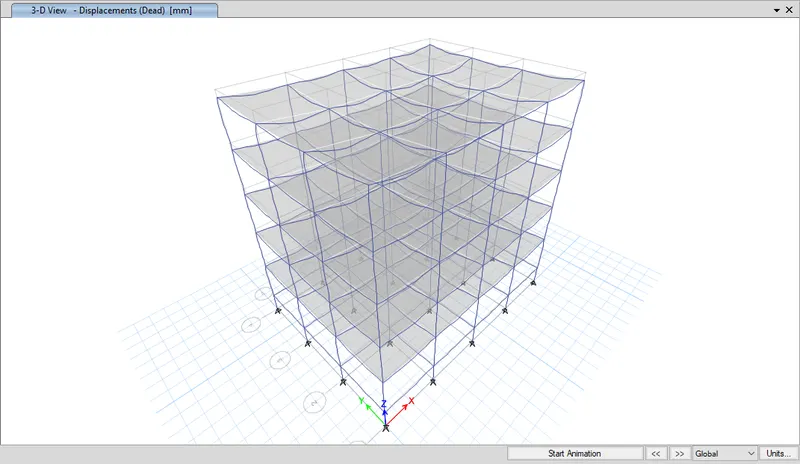
Obtaining the results from the output:
Modal periods for Building D:
5. Building type E (G+10)
Column sizes for top 5 storeys: 400x400
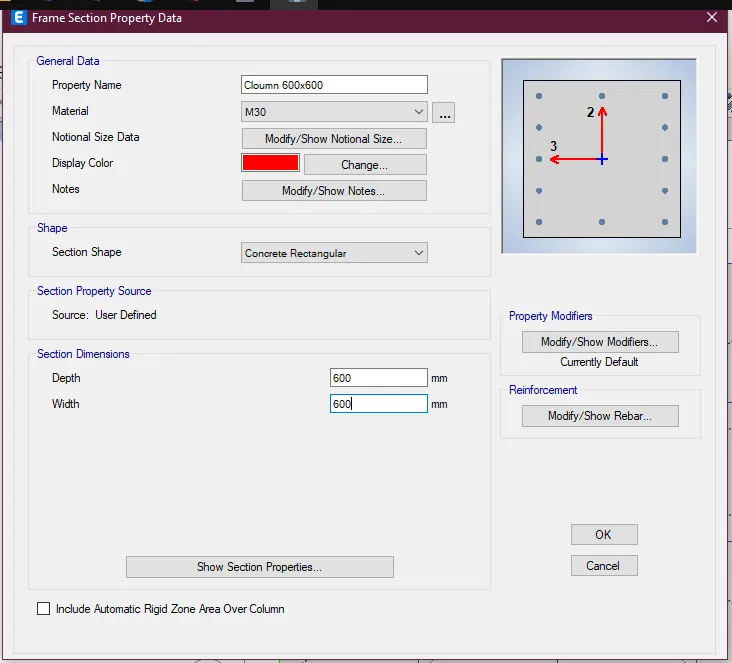
Column sizes for bottom 5 storeys: 600x600
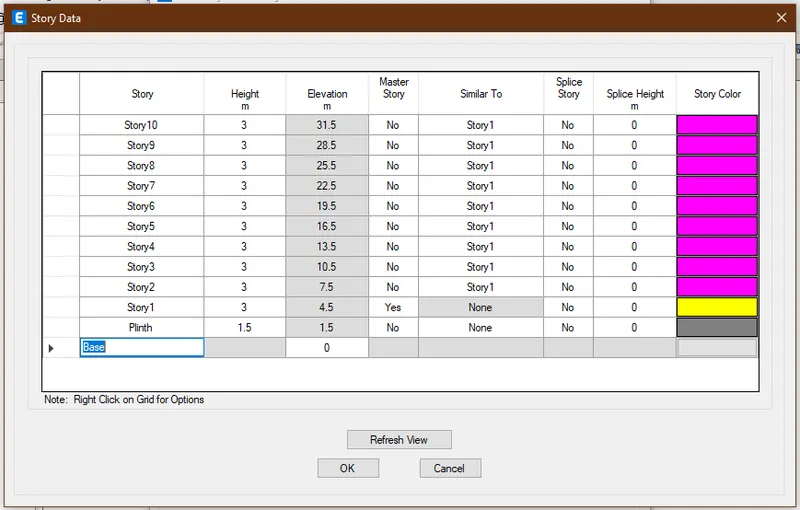
Building type D has 5 storys, hence modifying the story data for 10 storys
Creating new sectional frame property:
Assigning columns (400x400) mm for the top 5 storys and assigning columns (600x600) mm for the bottom 5 storys. Using Set display options and Set Building view limits from the View menu:
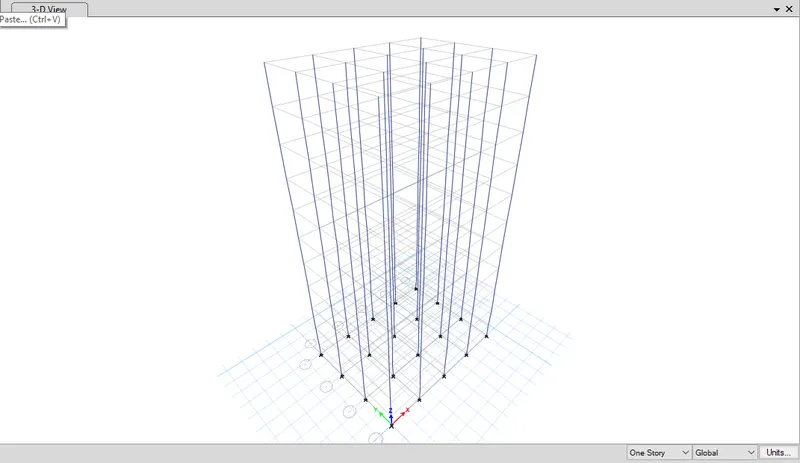
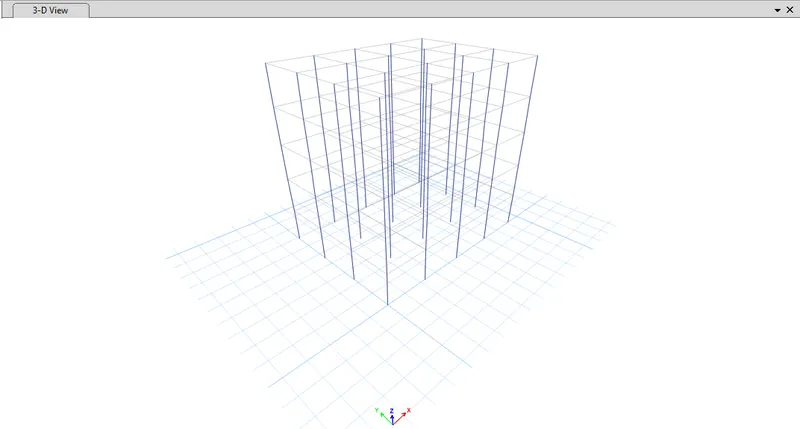
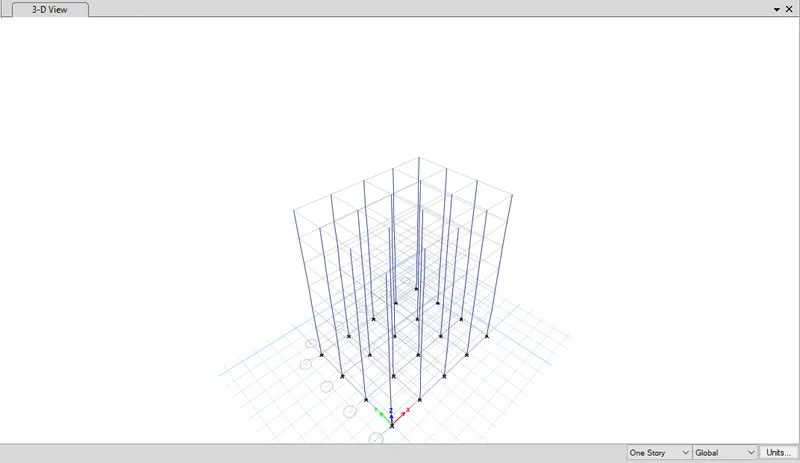
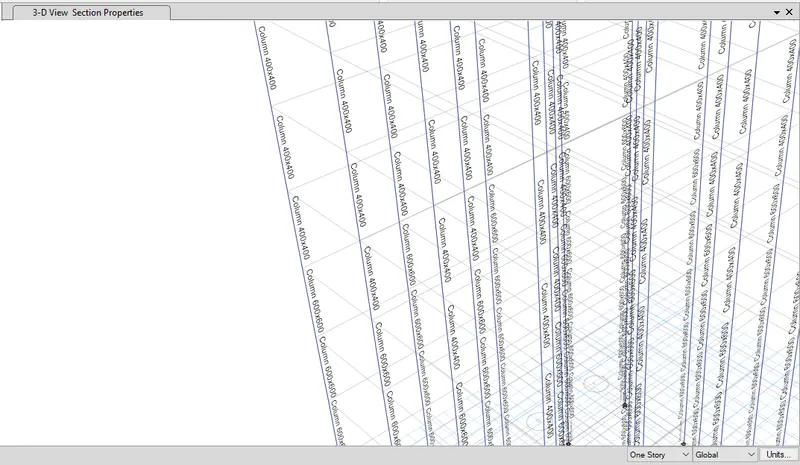
Extruded view:
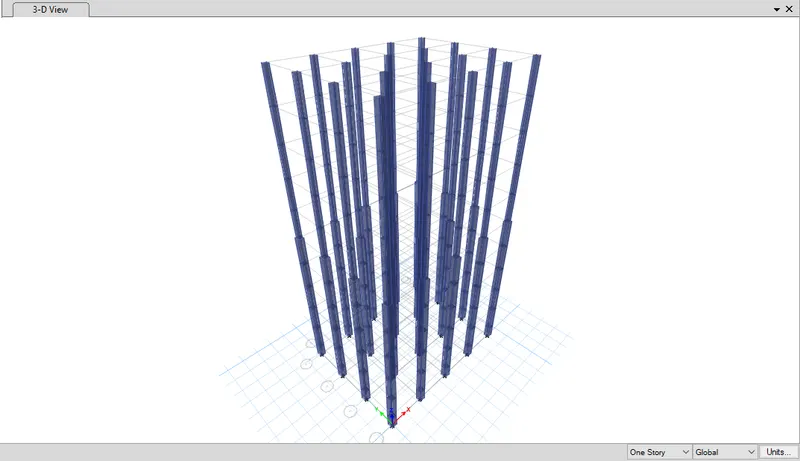
Checking the Model before Running Analysis for Frame loads, Shell loads & Diaphragm.
Diaphragm check:
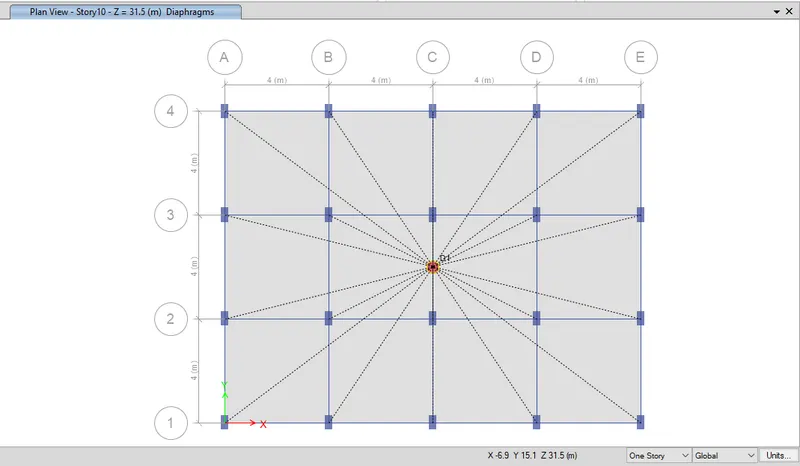
Running the Analysis.
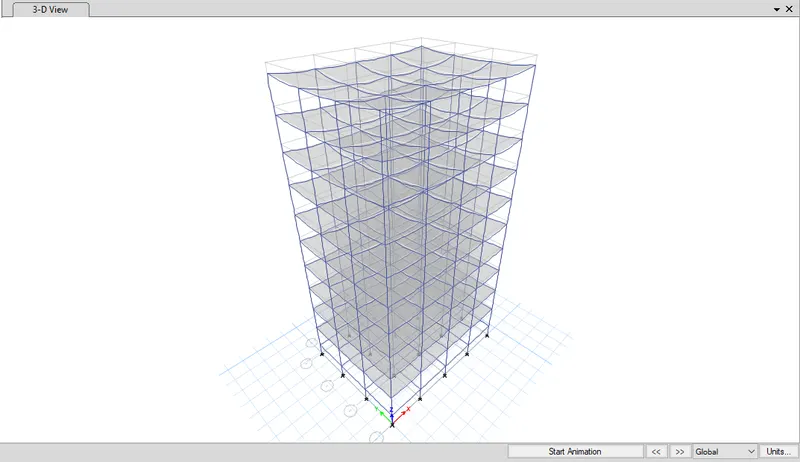
Obtaining the results from the output:
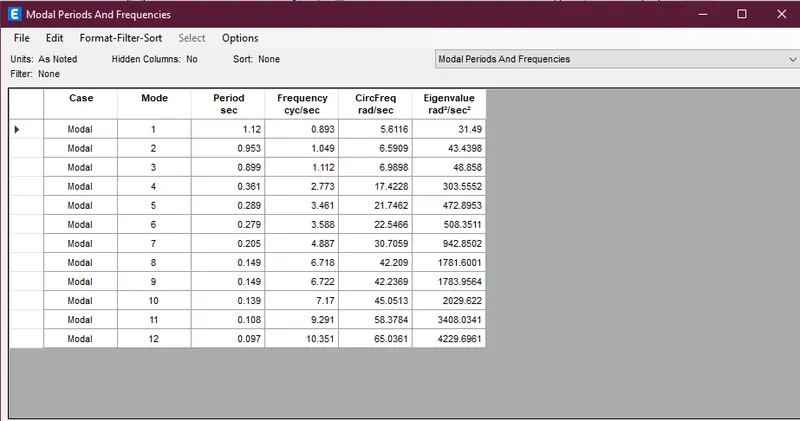
Modal periods for Building E:
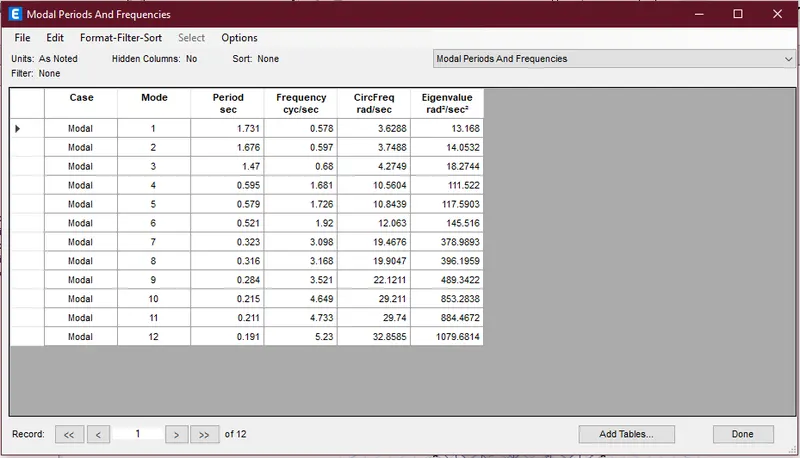
6. Building type F (G+10)
Uniform Column sizes for all 10 storeys: 600x600
Using Set display options and assigning the frame section of Column 600x600 mm
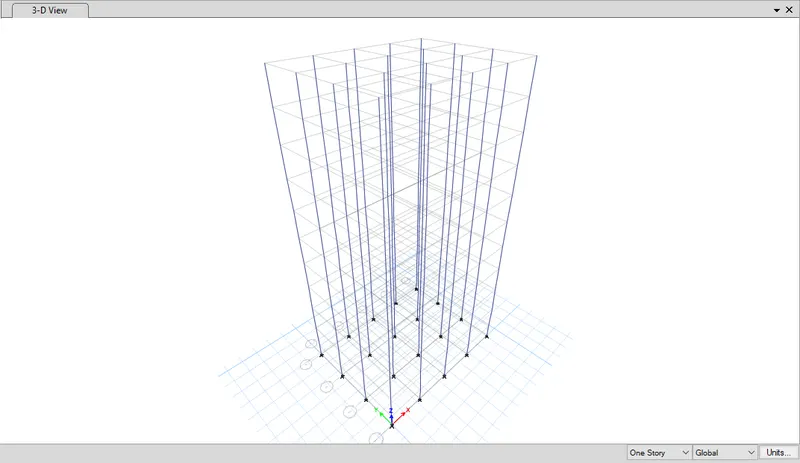
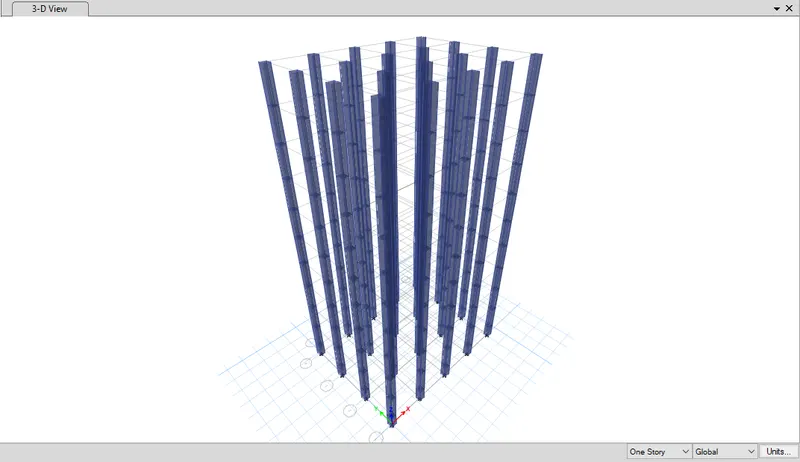
Extruded view:
Running the analysis:
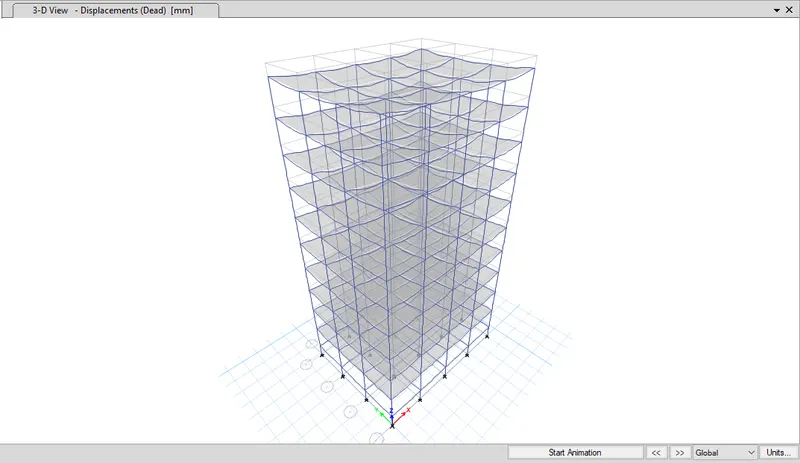
Obtaining the results from the output:
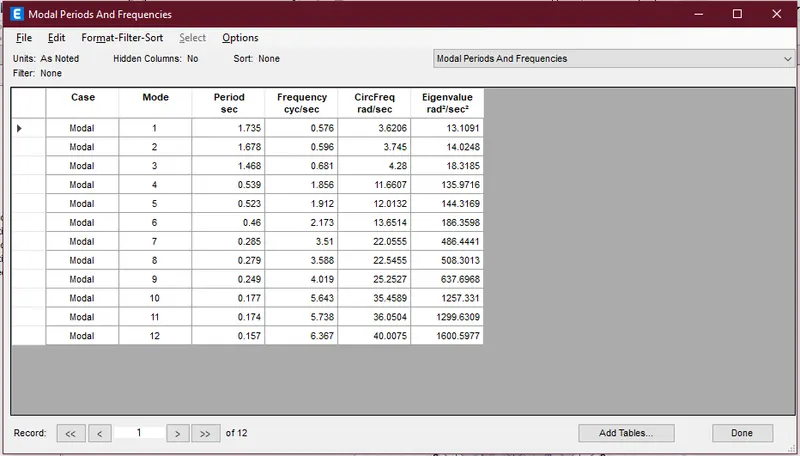
Modal periods for Building F:
7. Building Type G (G+25)
Columns for top 5 stories: C400X400
Columns for middle 10 stories: C600x600
Columns for bottom 10 stories: C800x800
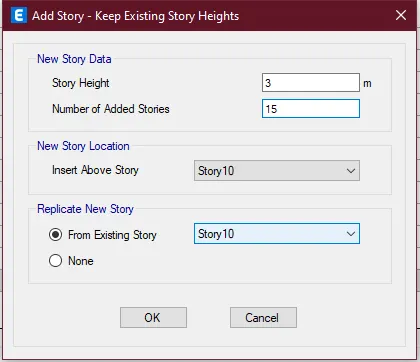
Modifying the story data to add 15 more storys
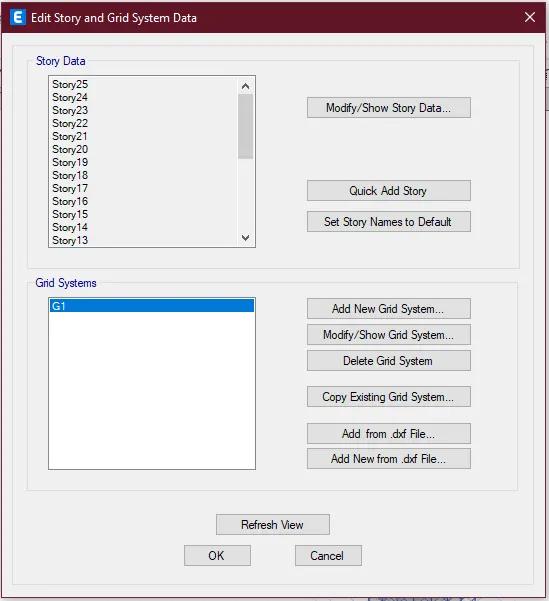
Defining Column of Size 800x800 mm size
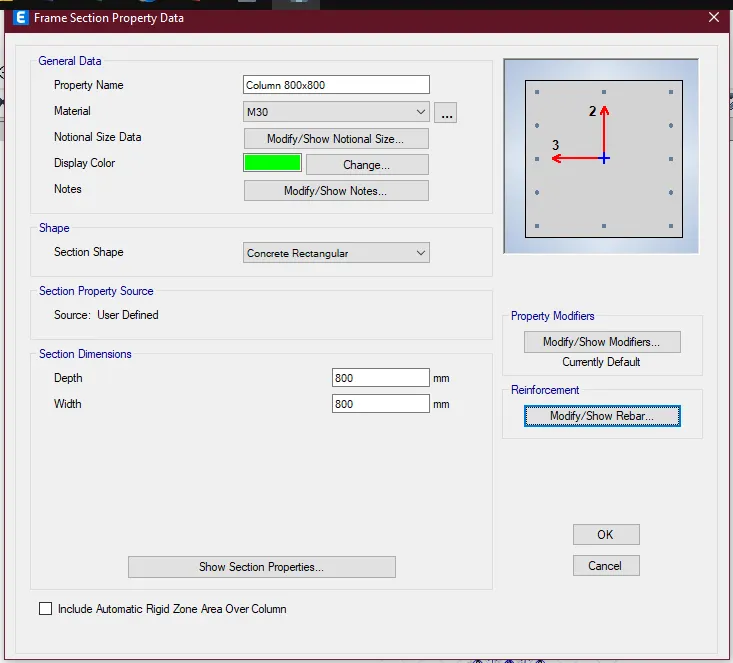
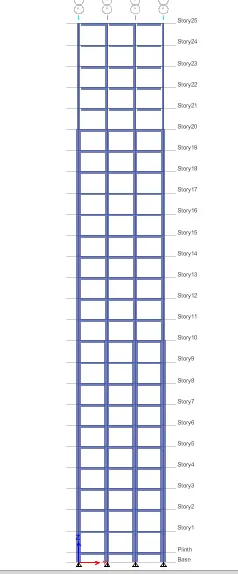
Assigning the varying column sections from level 20 to 25, from level 11 to 20, from level base to 10 using Set Building views.
Extruded view:
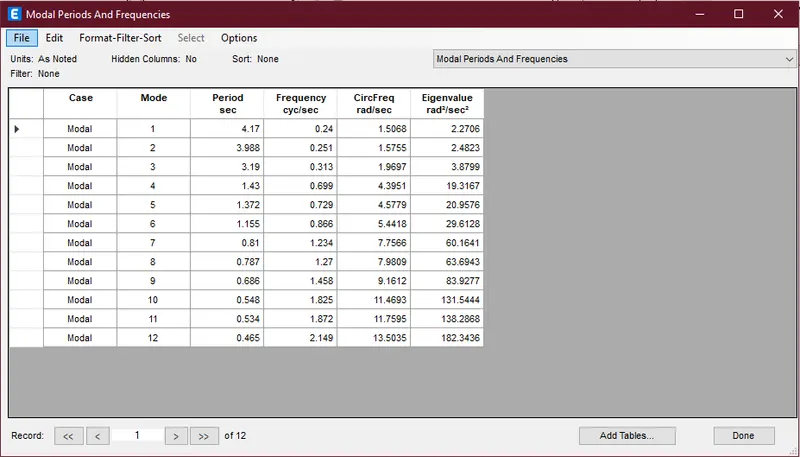
Running the alaysis and obtaining the results from the output:
Modal periods for Building G:
8. Building type H: with uniform size of the column (800 x 800)mm for all the 25 storys
Assigning uniform column size using Set Building View Limits
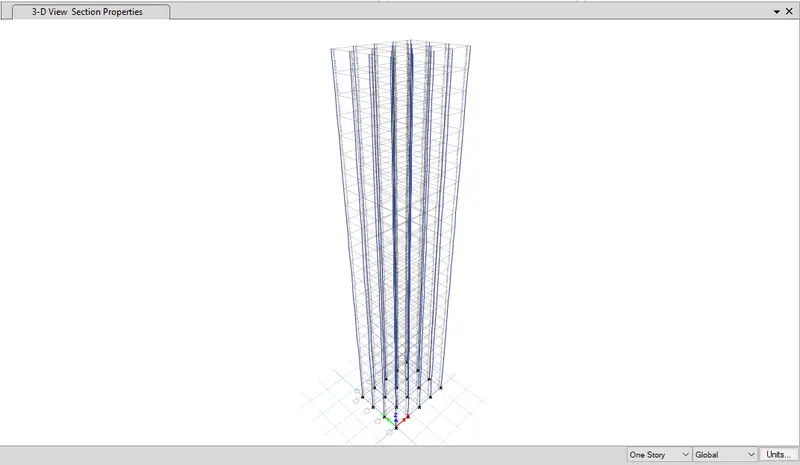
Running the alaysis and obtaining the results from the output:
Modal periods for Building H:
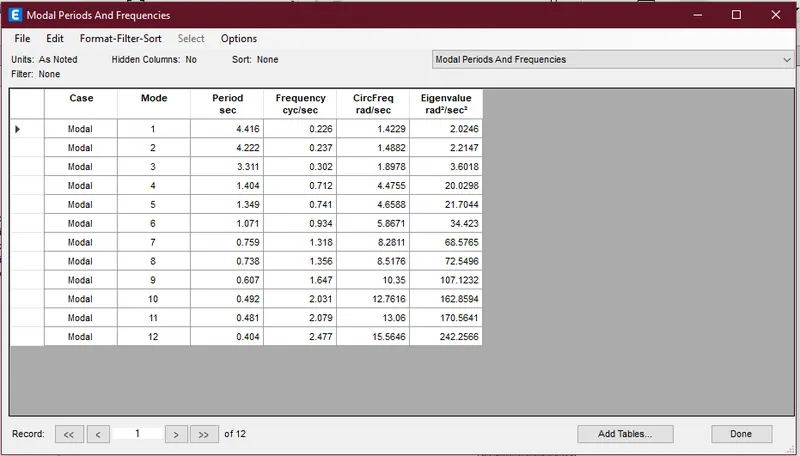
9. Building type J:
Increasing the Imposed load by 10%
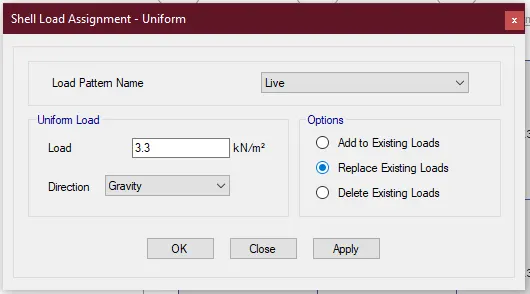
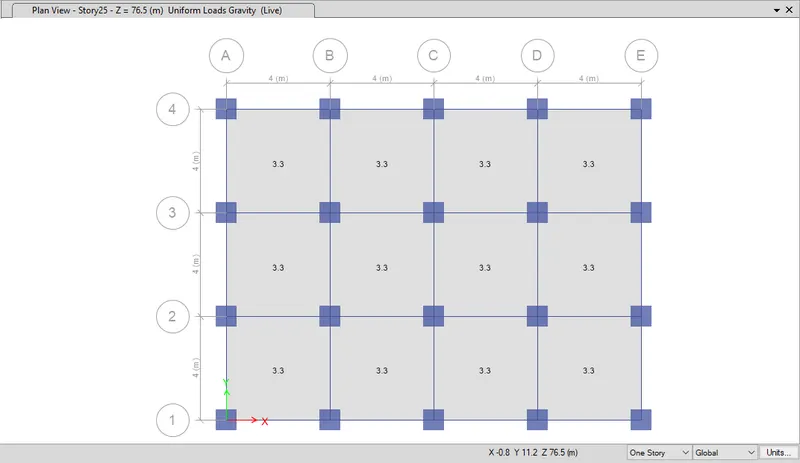
Running the alaysis and obtaining the results from the output:
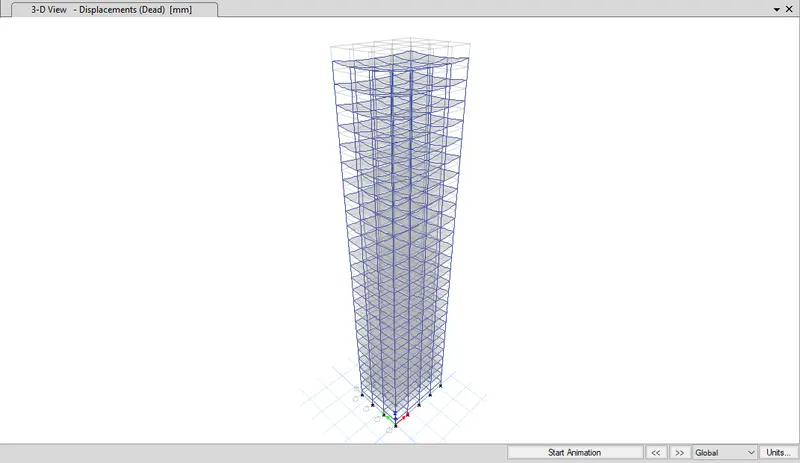
Modal periods for Building J:
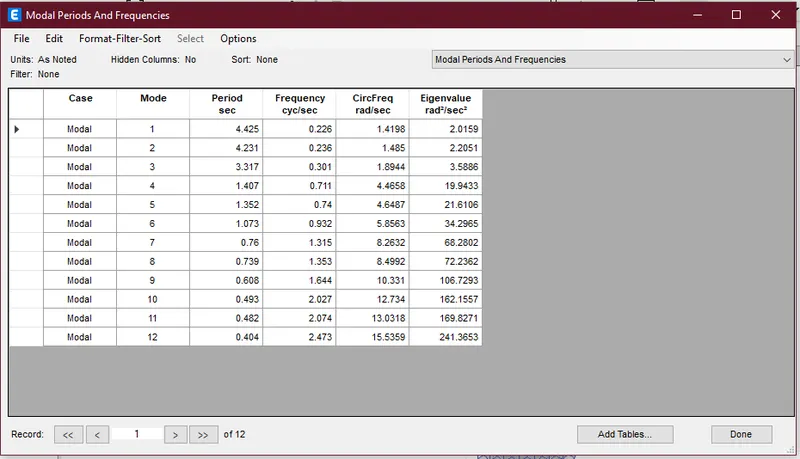
10. Building type K:
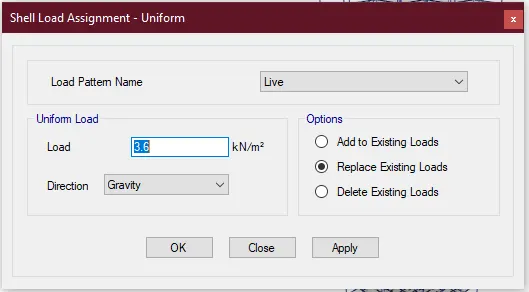
Increasing the Imposed load by 20%
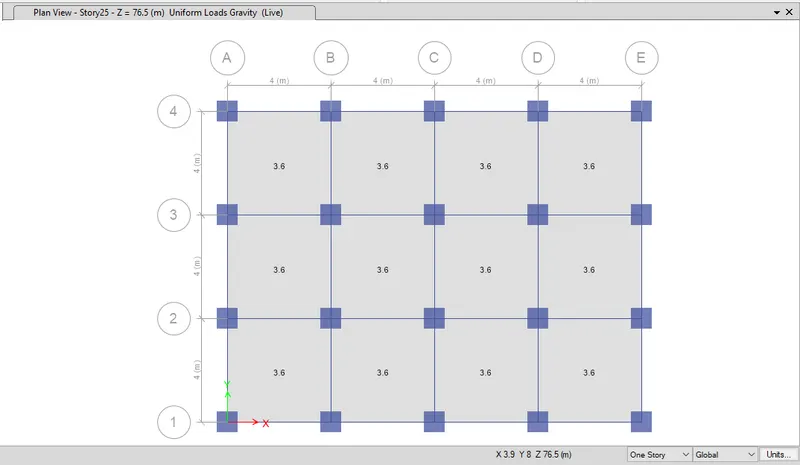
Running the alaysis and obtaining the results from the output:
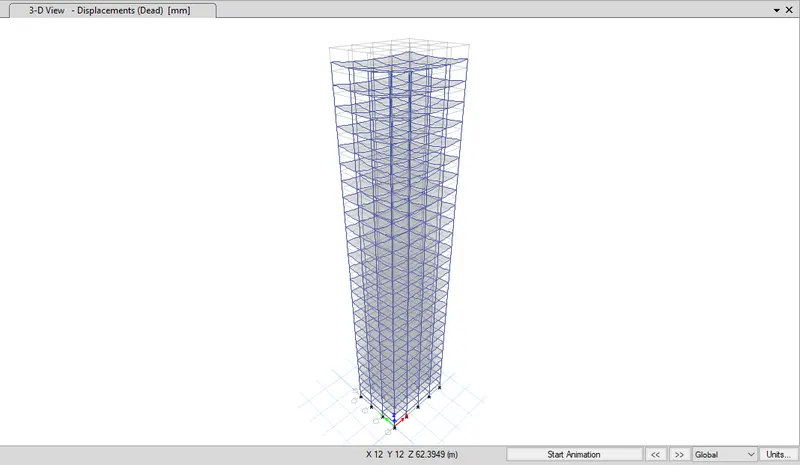
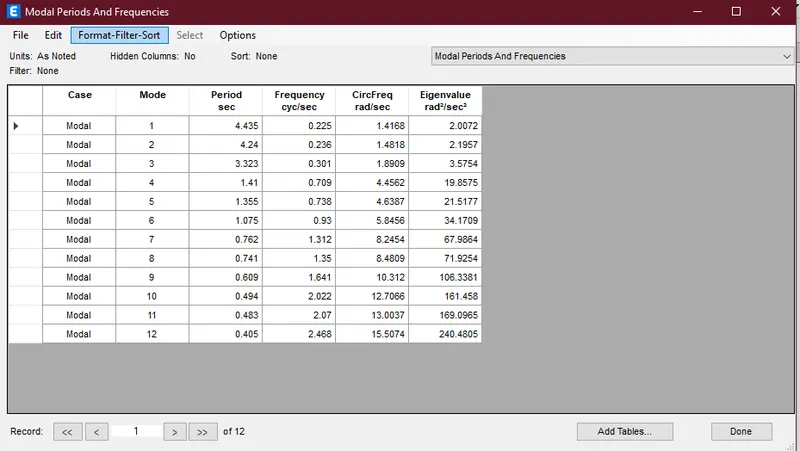
Modal periods for Building K:
PHASE II: Comparative Response of Buildings relative to the structural configuration
1. Effect of Stiffness on Time period
| Criteria | Model | Analysis result, T |
| Effect of Stiffness on Time period | Building E - 10 story with varying column sections | 1.731 Sec |
| Building F - 10 story with uniform column sections | 1.735 Sec | |
| Effect of Stiffness on Time period | Building G - 25 story with varying column sections | 4.17 Sec |
| Building H - 25 story with uniform column sections | 4.416 Sec |
From the analysis result tabulated it can be observed that, varying column sections of building E do not make significant change in Time period of the building compared to uniform column sections of Building F.
But a significant change in Time period of the buildings can be observed for Buildings G & H which are 25 storys high. Hence, providing reducing column sizes with increasing height of the building, reduces the Time period T of the building. This factor also improves the economy of the construction also.
2. Effect of Stiffness on Time period
| Criteria | Model | Analysis result, T |
| Effect of Mass on Time period | Building H - 25 story with uniform column sections and Live load of 3 KN/m2 | 4.416 Sec |
| Building J - 25 story with uniform column sections and Live load of 3.3 KN/m2 | 4.425 Sec | |
| Building K - 25 story with uniform column sections and Live load of 3.6 KN/m2 | 4.435 Sec |
As the imposed Mass is increased sequentially by 10% for Building J and K, Time period T also increased proportionately. Hence, it can be observed that natural period for the buildings is directly proportional to the imposed mass of the building.
3. Effect of Building height on Time period
| Criteria | Model | Analysis result, T |
| Effect of Building height on Time period | Building A - 2 story | 0.447 Sec |
| Building B - 5 story | 0.932 Sec | |
| Building F - 10 story | 1.58 Sec | |
| Building H - 25 story | 4.071 Sec |
From the table it can be observed that as the height of building increases, Time period T also increase proportionally. More the height more will be Time period T.
4. Effect of Column Orientation on Time period
| Criteria | Model | Analysis result, T | Maximum Story drift | |
| Due to Eqx | Due to Eqy | |||
| Effect of Column orientation on Time period | Building B - Column size in X & Y directions is - 400 mm | 0.932 Sec | 2.25 | 2.30 |
| Building C - Column size in X direction - 550 mm, Column size in Y direction - 300 mm | 1.03 Sec | 2.10 | 2.50 | |
| Building D - Column size in Y direction - 550 mm, Column size in X direction - 300 mm | 1.008 Sec | 2.45 | 2.15 | |
When the column cross-section is square, there is not much difference between the lateral displacement in both the X and Y directions.
However, when the orientation of the column in a particular direction, be it X or Y, the lateral displacement in that particular direction will be less than that in the other direction which has a lesser column dimension.
5. Effect of Flexural Stiffness of Structural Elements on mode shapes
| Criteria | Model | Analysis result, T |
| Effect of Flexural stiffness of Structural elements on Mode shapes | Building B - Flexural stiffness of beams close to Nil | 2.627 Sec |
| Building B - Flexural stiffness of beams full | 1.036 Sec |
It can be observed that with reducing the flexural stiffness of beams, Natural Time period T increases. In this particular case, T has increased by more than 2 times.
6. Effect of Axial Stiffness of Vertical Members on mode shapes:
| Criteria | Model | Analysis result, T |
| Effect of Axial stiffness of Vertical elements on Mode shapes | Building H - Axial stiffness of Cloumns close to Nil | 4.904 Sec |
| Building H - Axial stiffness of Cloumns close to Full | 4.416 Sec |
It can be observed that with reducing the flexural stiffness of Columns, Natural Time period T increases.
7. Effect of Degree of Fixity at column bases on mode shape:
| Criteria | Model | Analysis result, T |
| Effect of degree of fixity at column base on Mode shapes | Building B - Column support is Pinned | 1.036 Sec |
| Building B - Column support is Fixed | 0.941 Sec |
From the table above it can be observed that as the degree of fixity increases, Natural period of Time T decreases. Hence fixed supports are better compared to pinned supports for reducing the susceptability of failure to Earthquakes.
Thank you