Project 1
Simulink model:
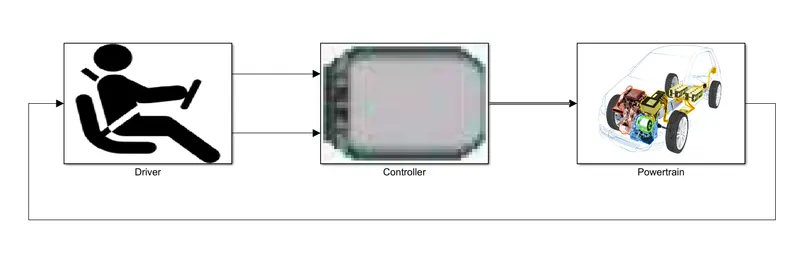
Powertrain subsystem:
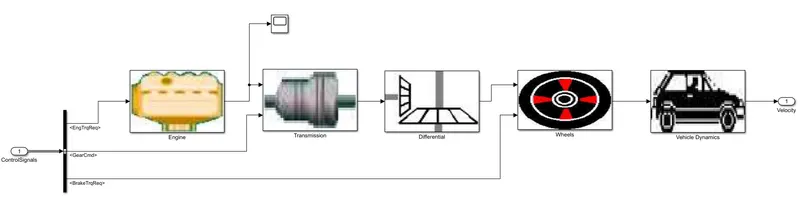
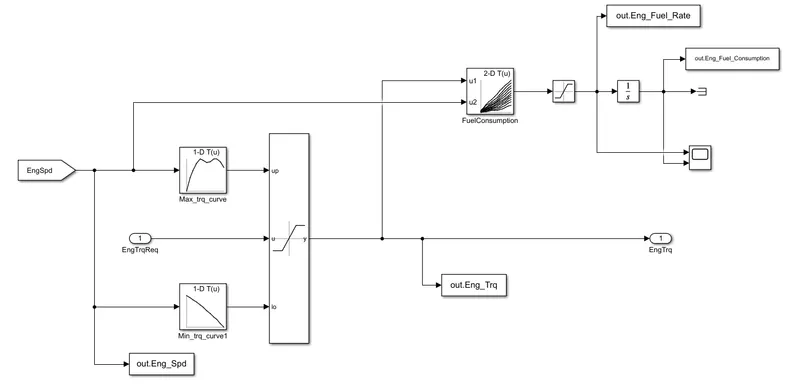
Engine block:
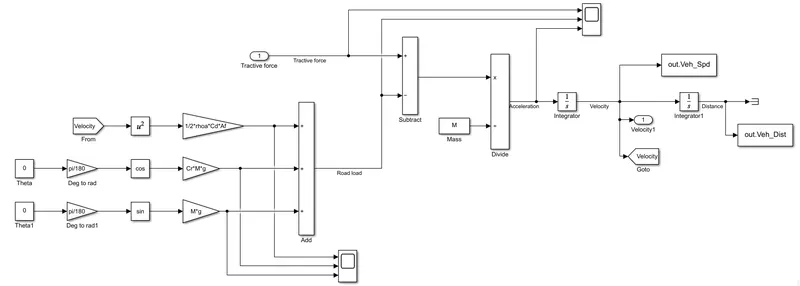
Vehicle dynamics block:
REPORT:
The fuel economy numbers (kmpl) for UDDS and HWFET cycle:
|
Drive Cycles |
Fuel Economy [kmpl] |
|
UDDS |
14.2044 |
|
HWFET |
16.5010 |
Vehicle characteristics time trace:
UDDS cycle:
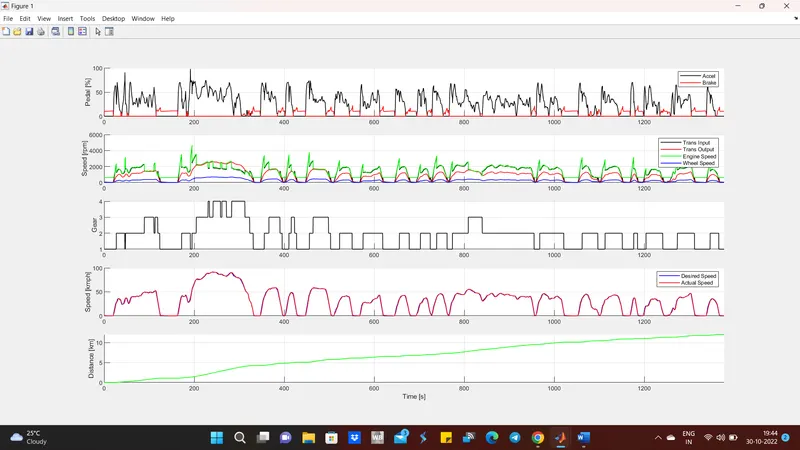
Observation:
- In the 1st plot, we could see a constant up-down shift in the accelerator pedal and more usage of brakes.
- In the 2nd plot, the transmission output speed tries to trace the curve of the input speed but it is less due to the mechanical losses and transmission efficiency. The wheel speed is less than the transmission output speed and it is also due to the same. They mainly depend on the efficiency of the system.
- In the 3rd plot, we could see a lot of gear shifts because of the drive cycle as it mostly drives through the city traffic.
HWFET cycle:
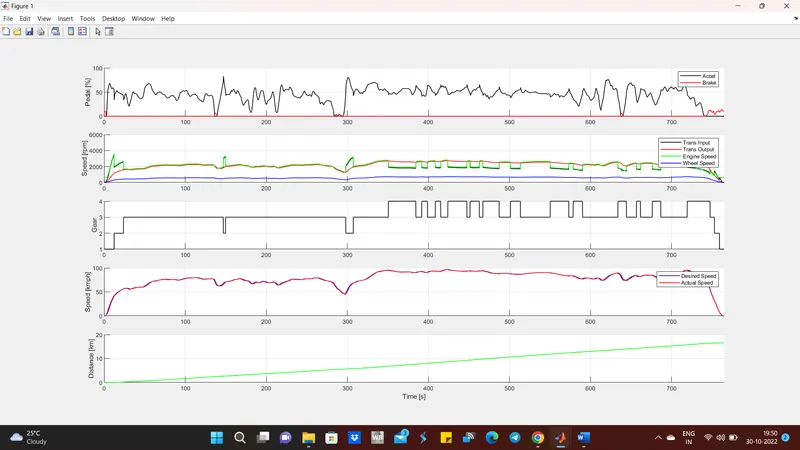
Observation:
- In the 1st plot, the usage of brakes is very little as the vehicle is run on highways.
- Comparing the 2nd and 3rd plots, we could see that at 4th gear i.e., overdrive, the transmission output is above and constant even though there is a shift in the transmission input.
Engine characteristics:
UDDS cycle:
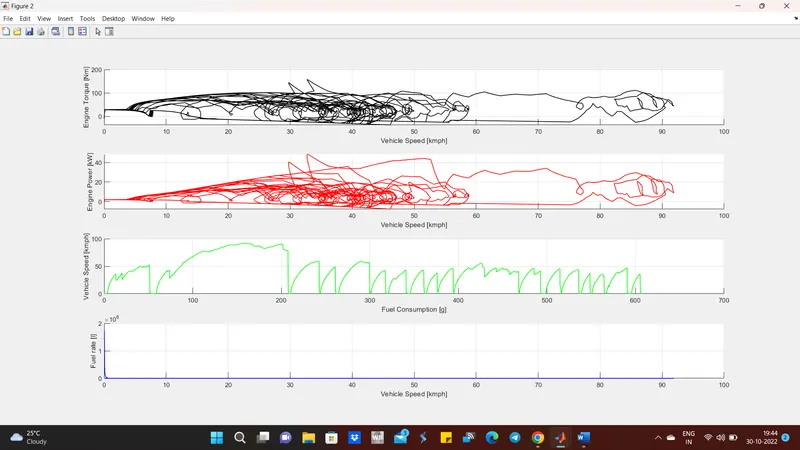
Observation:
- The vehicle is operated around an average speed of 20-50 kmph and the fuel consumption is more at higher speeds.
- The engine torque and power requirements are mostly around 20-45 kmph speeds as the vehicle is operated around that speeds.
HWFET cycle:
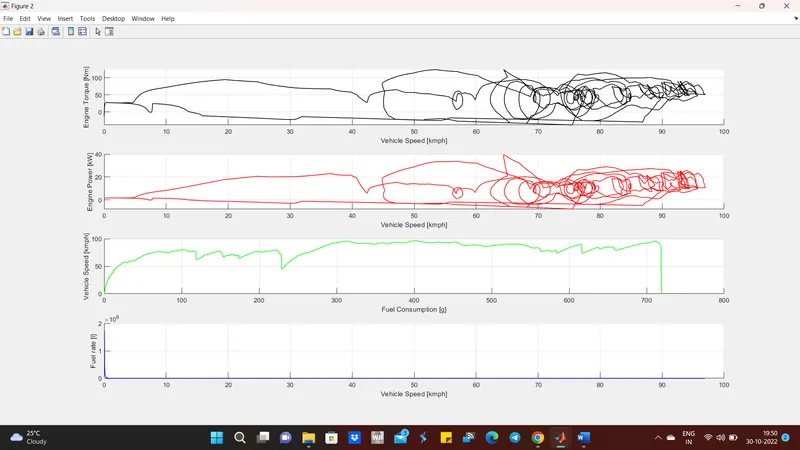
Observation:
- The fuel consumption is more as the vehicle speeds are higher.
- The vehicle is mostly operated at speeds of 70-90 kmph and the engine torque and power requirement is comparatively less consistent than it is required on the UDDS cycle.
Engine operating points on the engine fuel map:
UDDS cycle:
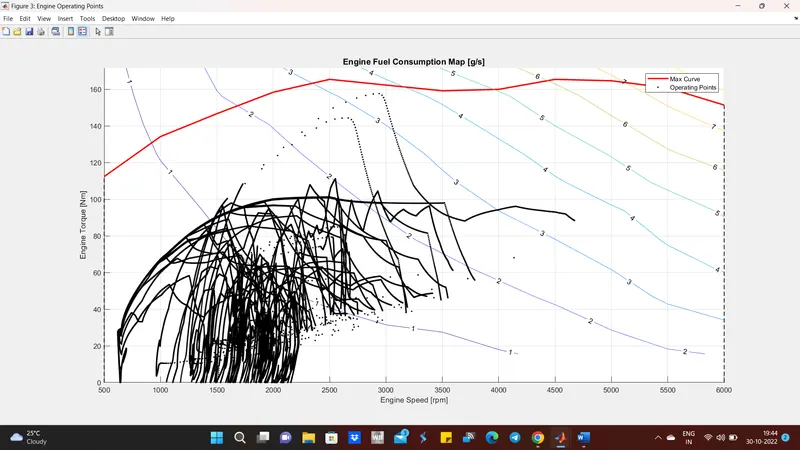
Observation:
- The engine is operated at lower torques and the rpm is mostly around 1500-2500. The operation is consistent and crowded at that region which means the usage is more around that area.
HWFET cycle:
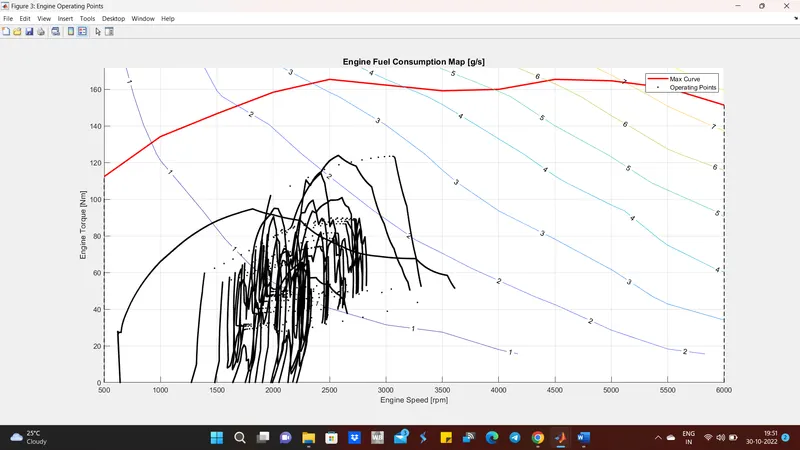
Observation:
- The engine is operated at the speeds of 1500-3000 rpm and the plot is not crowded as compared to the UDDS cycle. As there is no consistent stop-and-go shifts in the accelerator pedals, the fuel consumption is comparatively less than the UDDS cycle.
Results and Discussion:
The vehicle behavior is studied for different drive cycles and the fuel economy numbers are also compared. The plots really helped to understand it better and also to compare. The different drive cycles are necessary to analyze the vehicle performance for different environmental conditions.