Project 1
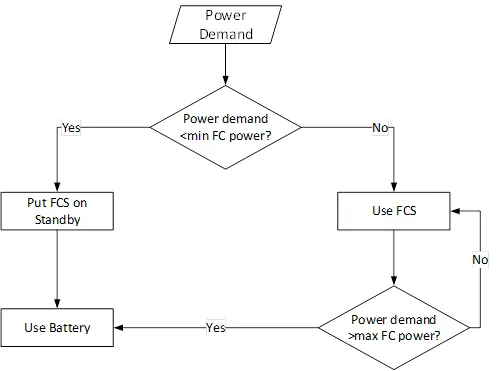
Create a stateflow or Simulink model for the following flowchart.
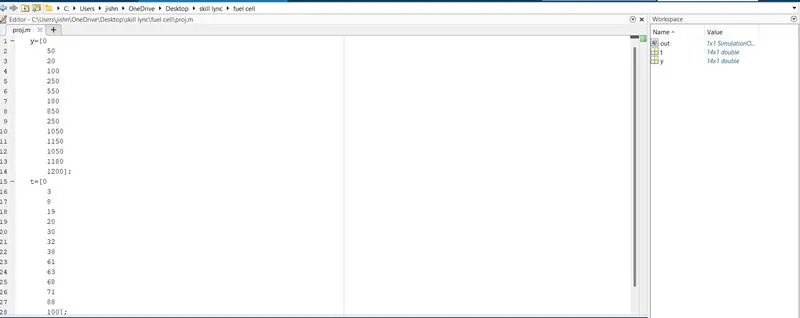
Load the .mat file into the workspace.
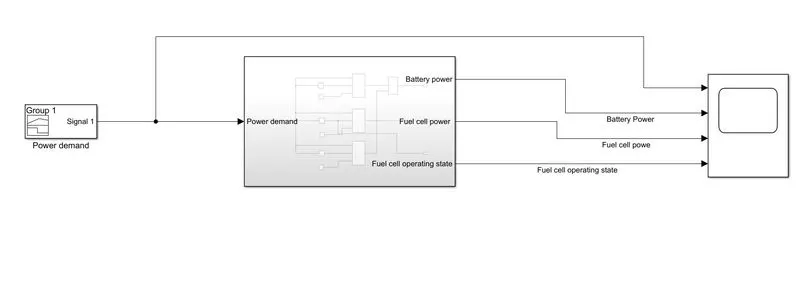
The input to the model would be the power demand.
The output should be:
- Fuel cell power
- Battery power
- FC Operating state (running, standby)
Create plot of these outputs against time.
Simulink Model
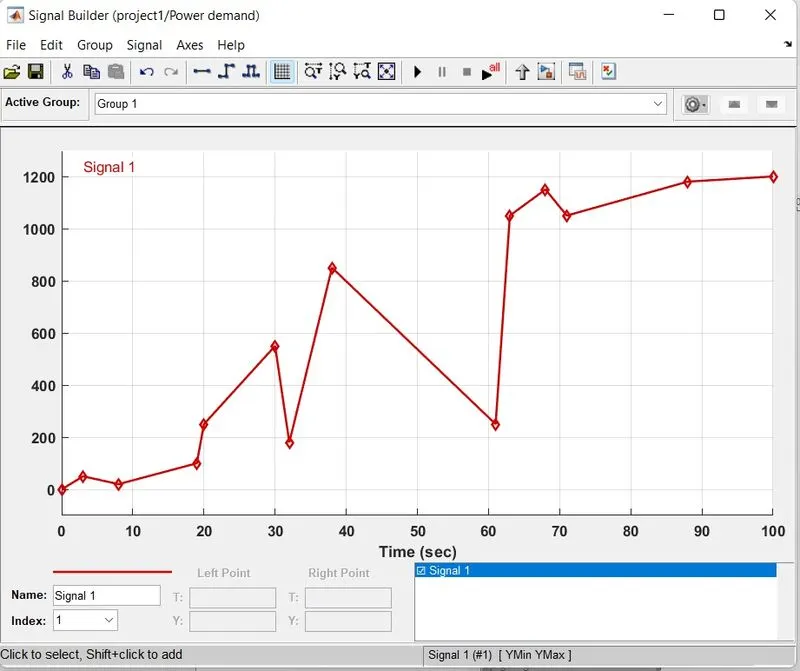
Signal builder plot
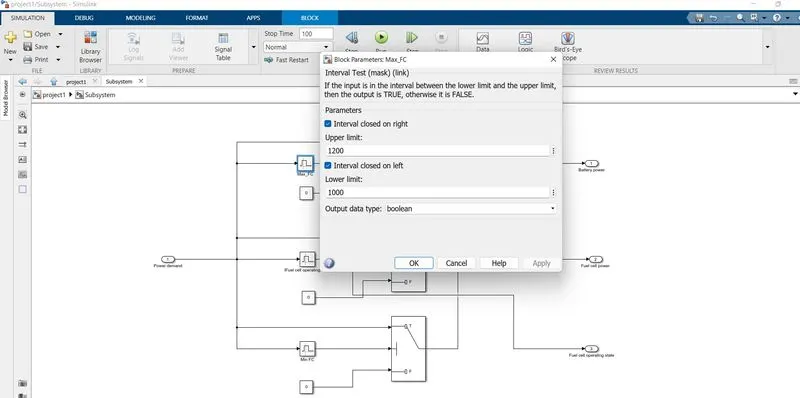
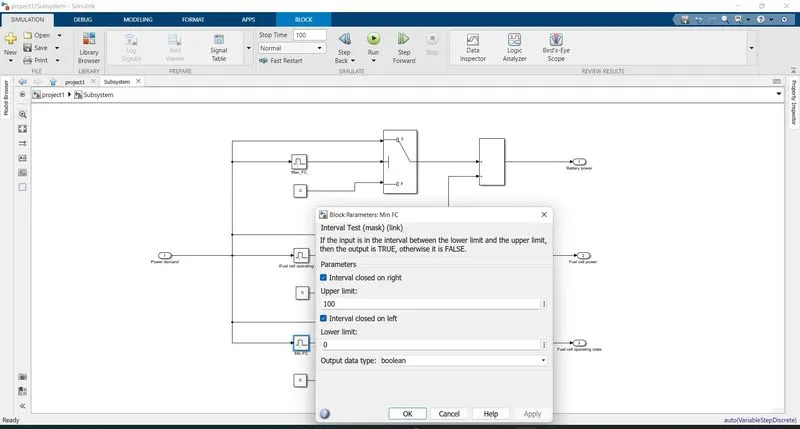
Here The Interval test block are used for setting the limits of the Fc minimum maximum and operation region the limits are been set as discussed above then as per logic the switch block are been set and the output is been connected to FC or battery as mentioned in flowchart
Power demand subsystem
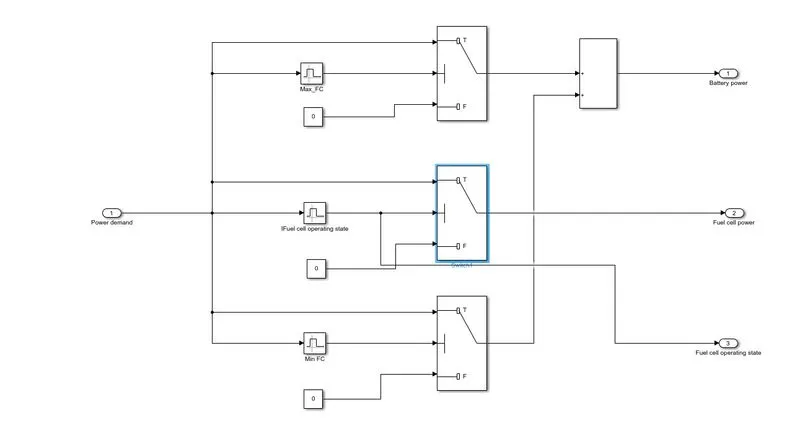
The logic which is been told to develop in this is that if the Power demand from the vehicle is less than the minimum FC power than the FC must go on standby and the power should be supplied from the battery storage system and if the power demand is greater than the min FC power than the FC should be used and if the power demand of vehicle is fore than the max power of FC than the Battery should supply the power.
The Simulink model is been developed for this as shown below,
For this the min FC power is kept between 0 to 1000w
Operating region of FC is 1000w to 9000w
And max power demand is set till 9000w to 10000w.
Max FC demand
Min fc demand
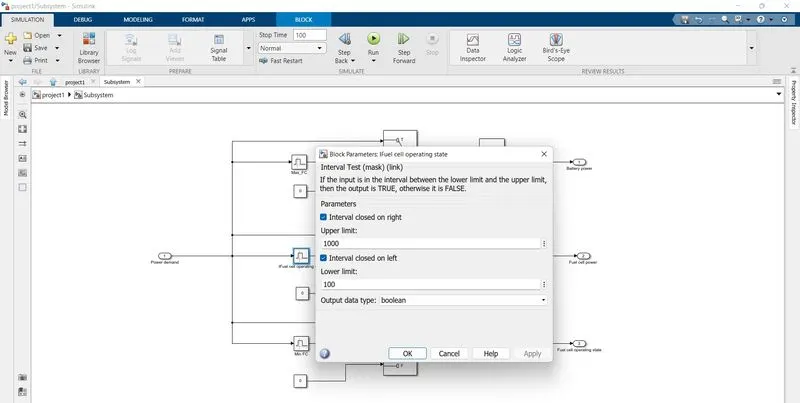
FC operation
Output Results
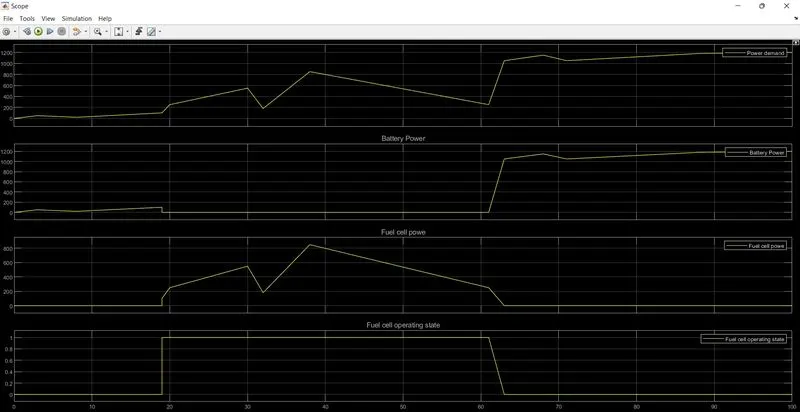
From the above graph we can see that any power at below 100 and above 1000 delivered by the battery and the power between 101 and 1000 delivered by the fuel cell.