Project 1
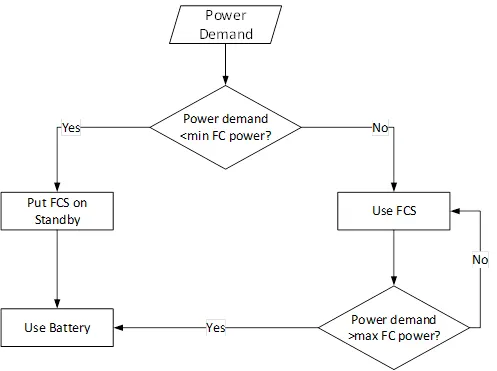
We have designed a model to replicate this flowchart by using necessary blocks.
Blocks Used:
- Constant
- Interval Test
- Add/Sum
- Switch
- Input/Output Ports
- Scope
- Signal Builder
Here we have connected all the blocks and implemented them in a logic which will deliver us the required outputs.
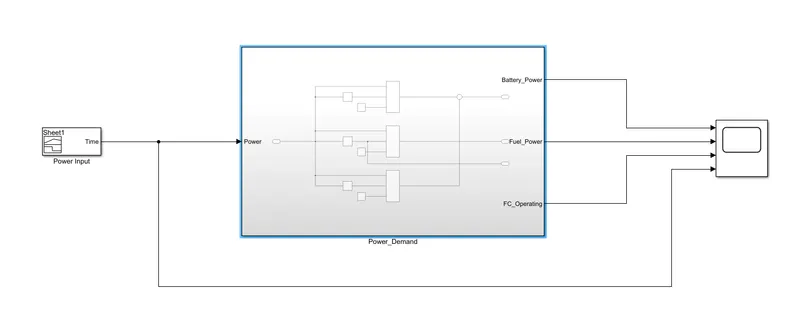
Inside Power_Demand
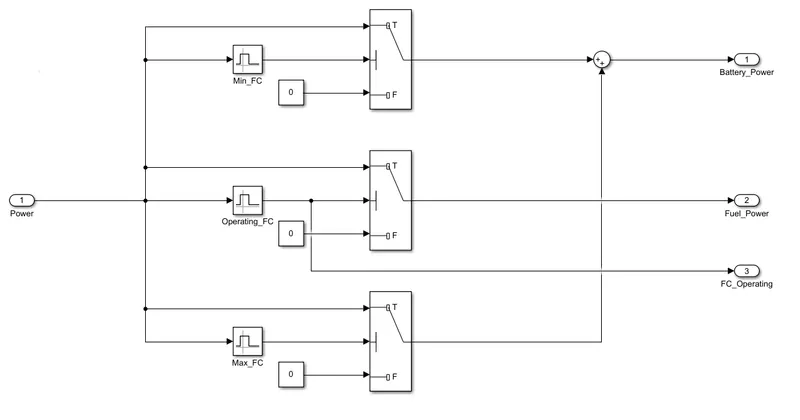
As per the above requirements, we have "Min, Max and Operating Fuel Cell" Demands
I have initialised some input values in excel sheet which i have imported in to the signal builder as a power input
Here I have considered a 5kW engine where the power is supplied between 0-1000W from 0-300sec of simulation.
After that I have maximised the input around 845sec i.e 4895W.
The plots for the above parameters are:
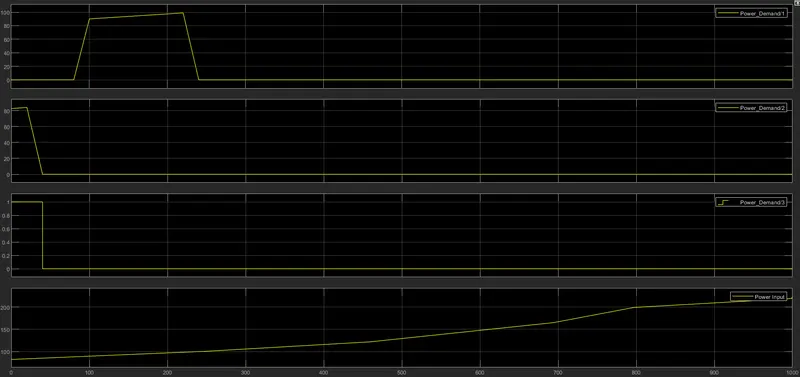
Here we can observe the Power Demand and the Power supplied to the vehicle in a single plot.