Project 1
Aim:
To create model for given flowchart
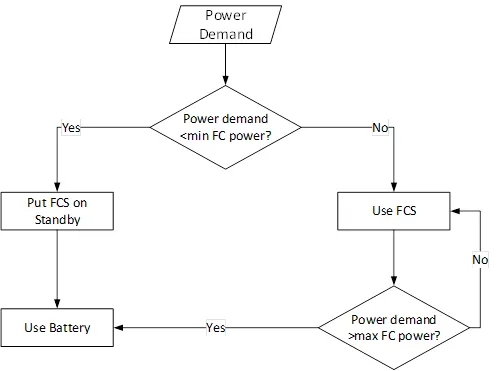
The logic for the above flow chart is created in Simulink, the top level model is attached below
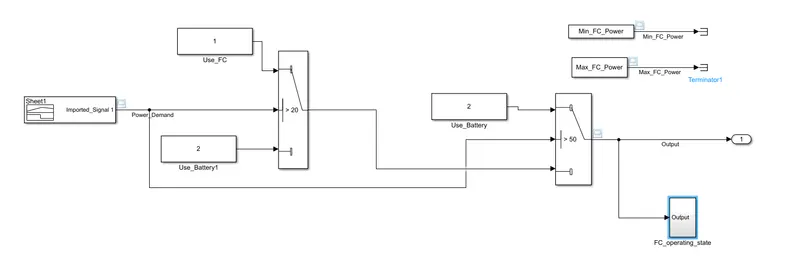
The power demand is given as a input signal from the signal builder block.
To separate the power demand which is less than Min_FC_power, a switch block is used with threshold as Min_FC_Power as shown in image below,
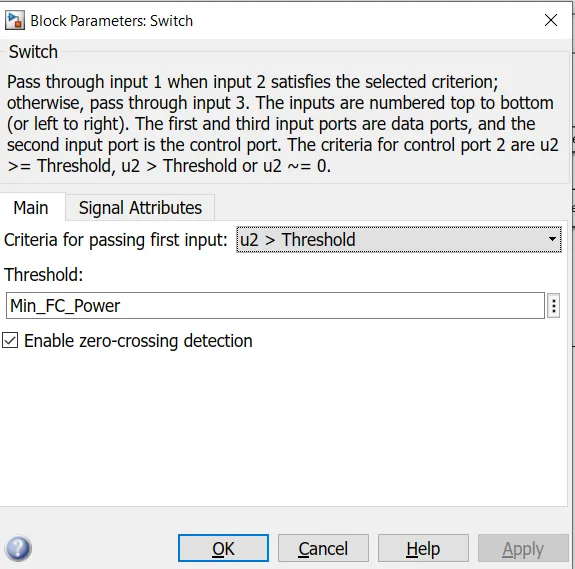
If the Power demand is less than FC minimum power, battery will supply the power which will be indcated by a constant block with value 2 in results. Else the FC will supply the power demand.
Also another switch block with threshold Max_FC_Power is used to use battery supply when the power demand exceeds the maximum operating limit of the fuel cell.
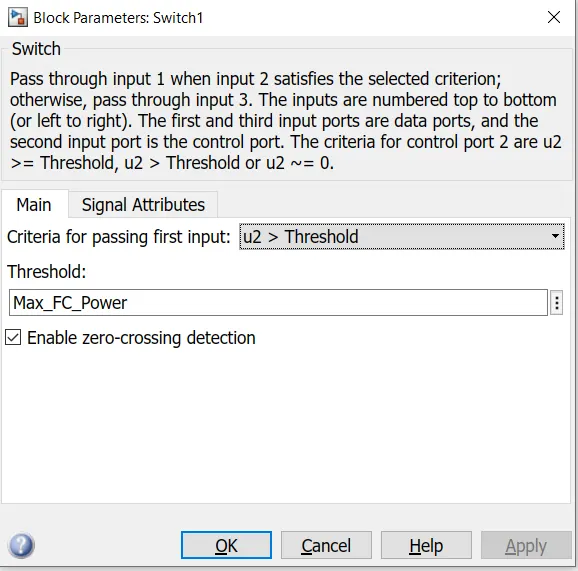
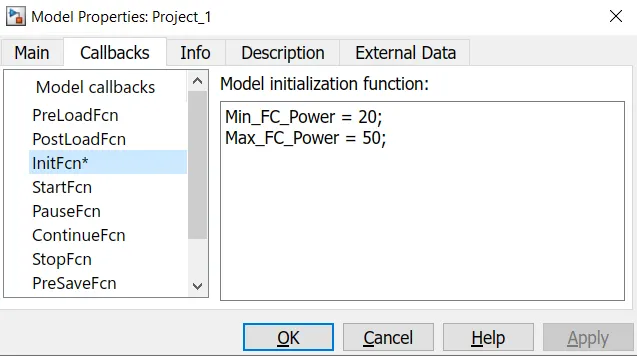
The minimum and Maximum limit for the Fuel cell is loaded initially in the matlab workspace using callback function.
The results obtained are
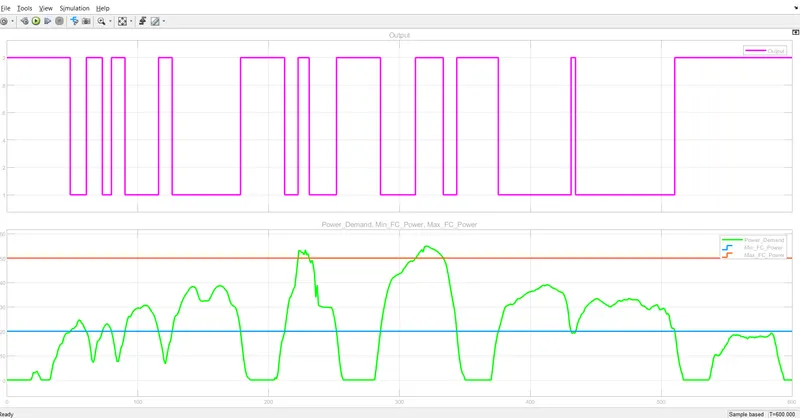
The first plot shows the output where 1 indicates FC in use and 1 indicates Battery in use.
The second plot shows the input power demand signal(green), FC maximum operating limit(Red) and FC minimum operating limit (blue). if the power demand comes in between the FC operating limit, the FC will supply the power, else if the power demand goes either up or down the FC limits then the battery will supplu the power demand.
To show the FC operating states a separate plot is made which is attached below,
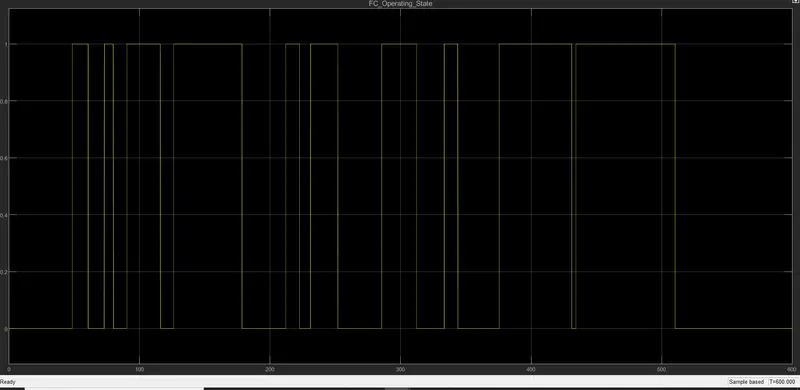
In this plot 0 indicates the FC in standby mode and 1 indicated the FC in operating mode.
Thus results are obtained as expected.