Project 1
Objective of the Question:
- Calculating flood levels of a river by using HEC-RAS software.
- Calculating flood for 25 and 100 years return period.
- Creating cross sections over the river.
- Developing a hydraulic model for a river.
River Reach:
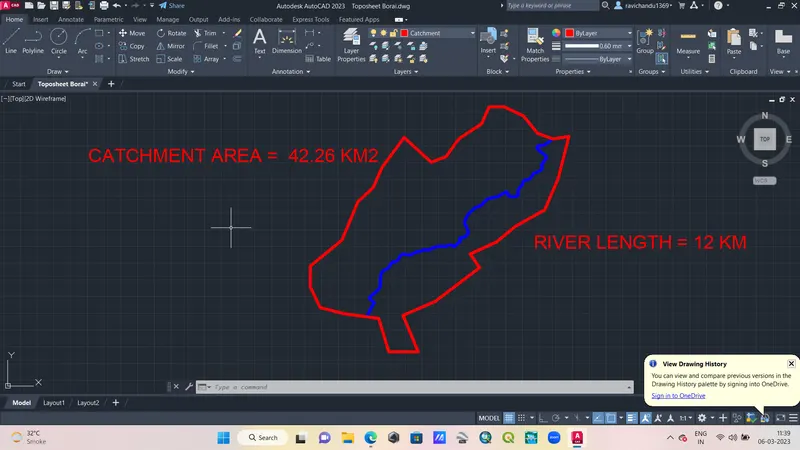
I consider Borai River in lower Tapi region. I consider and draw river with a length of 12 KM.
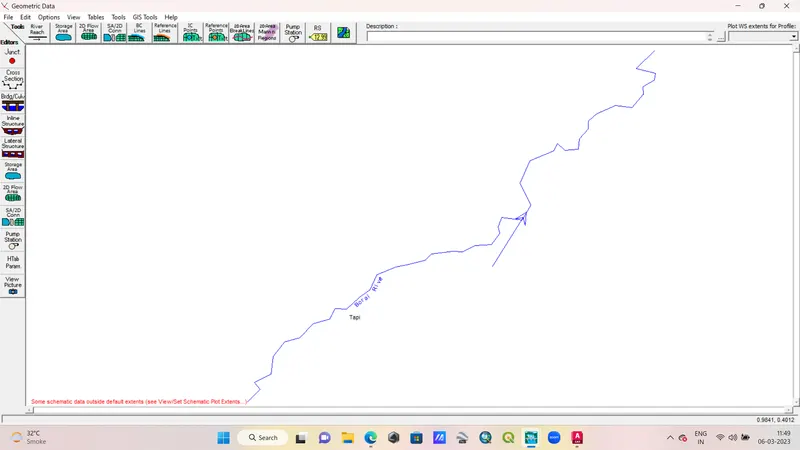
Downloading Toposheet and Calculation of Catchment Area:
1. Search SOI Nakshe in Google. Goto Open Series Maps website.

2. Login to Online Maps.
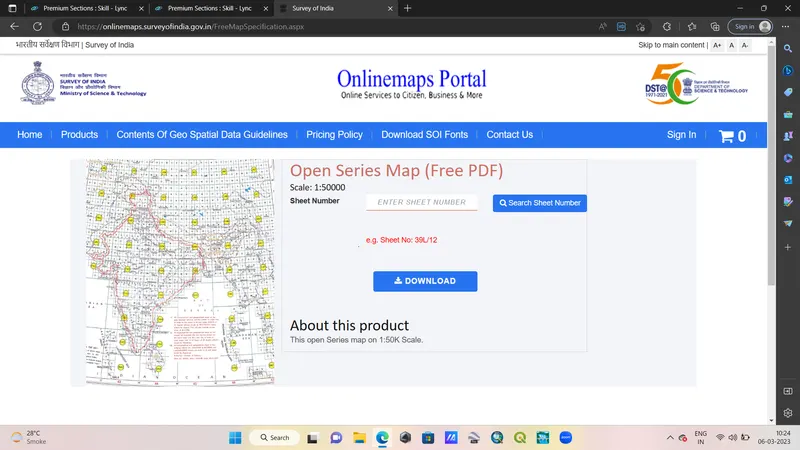
3. Select open series maps and click to buy (Free).
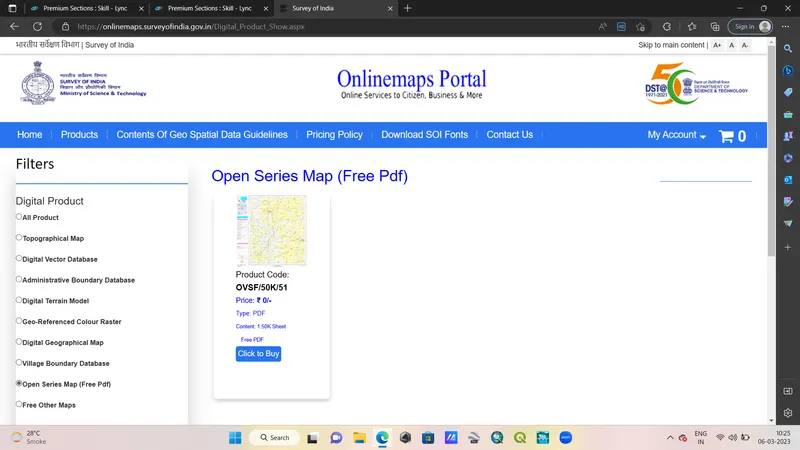
4. Search for Sheet no. by entering state and district. I used Sheet No: 46G/12.
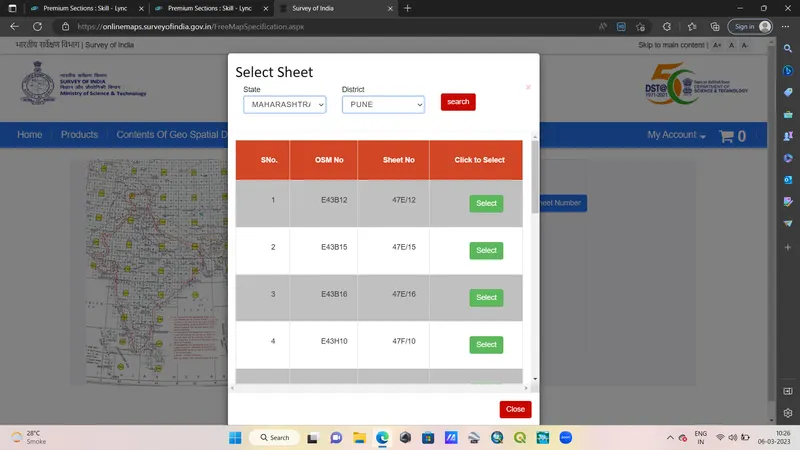
5. Download and Open it.
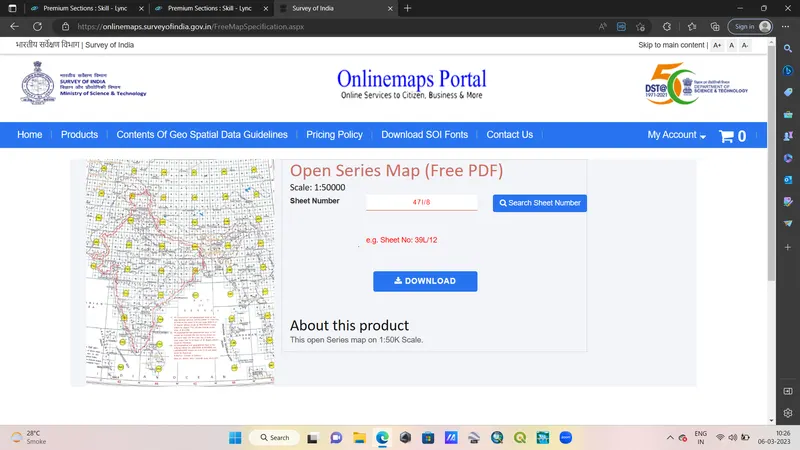
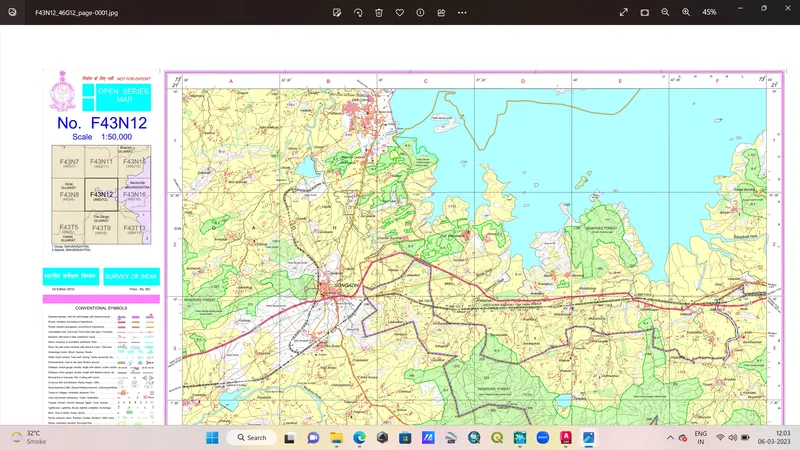
6. Convert it into Image and Import into AutoCAD.
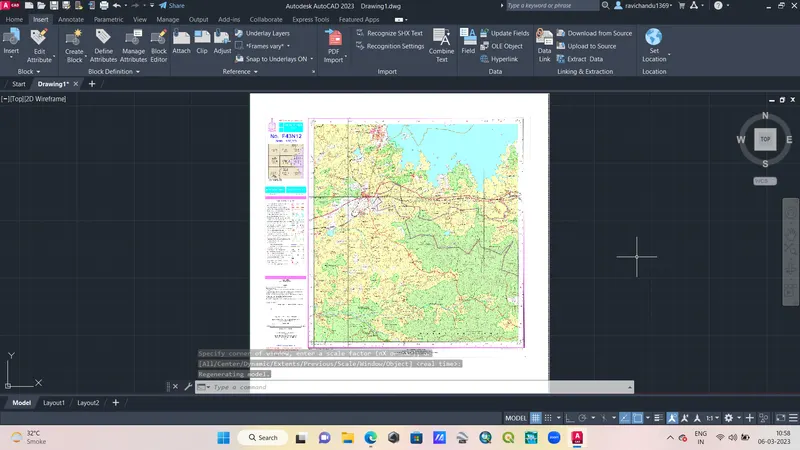
7. Draw River and Catchment for your selected river using Polyline command.
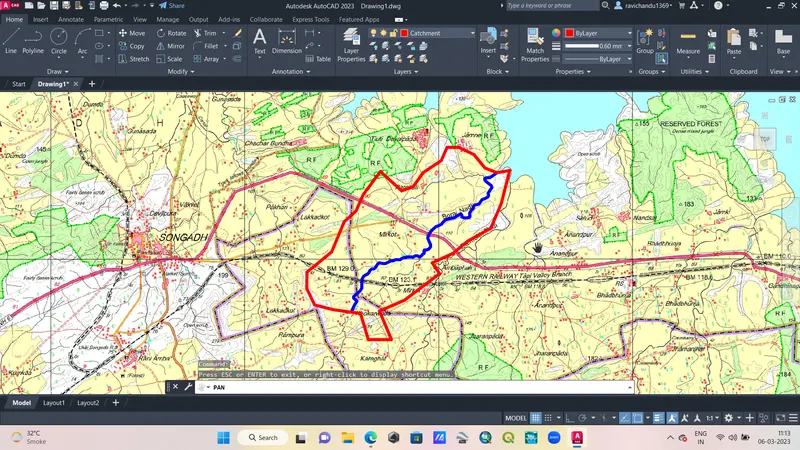
8. Using Properties command, I calculated River length and River Catchment area.
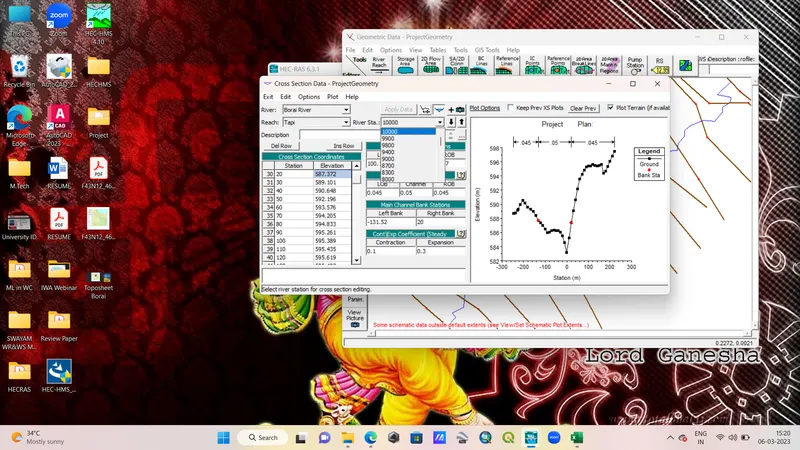
Entering Cross Section Data:
Once river reach was drawn then goto Cross section and enter station, elevation data, LOB & ROB, Manning's "n", Bank Stations, Expansion & Contraction values for all chainages from surveyed data presented in Excel sheet.
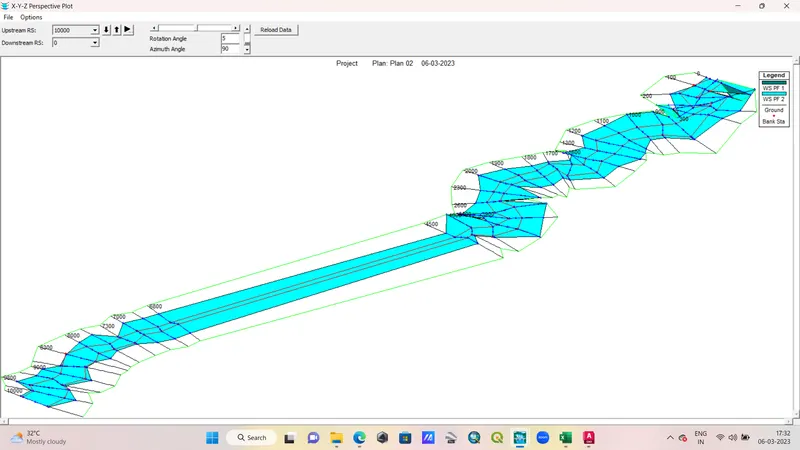
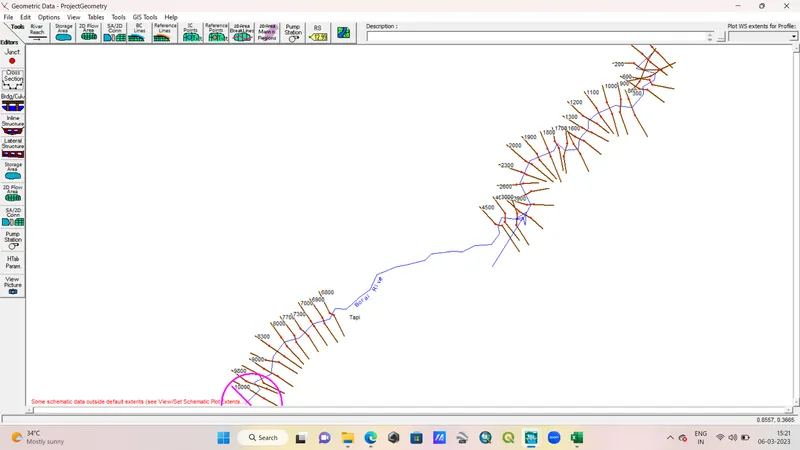
After completing cross section data river model will be looks as below:
Flow Calculations using Unit Hydrograph method:
Selected River: Borai River
CWC Maual: Lower Narmada & Tapi Subzone - 3(b)
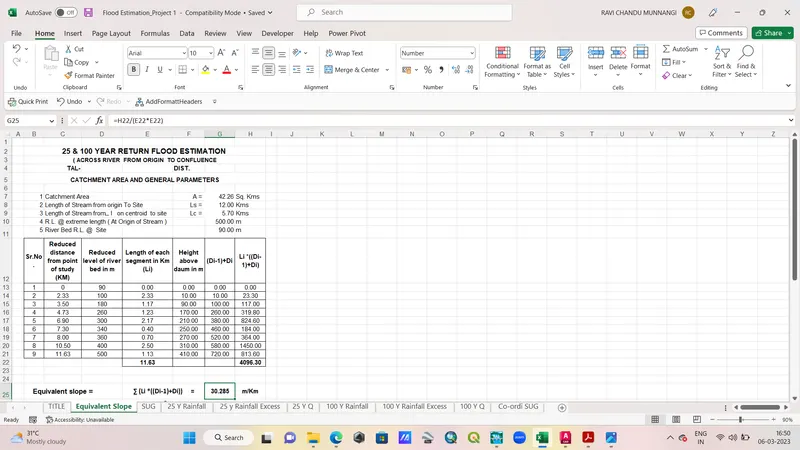
1. Compute Equivalent Slope as per CWC manual:
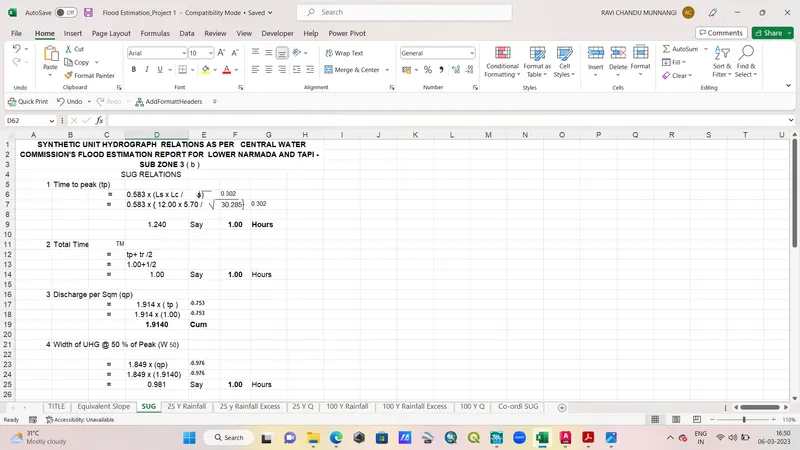
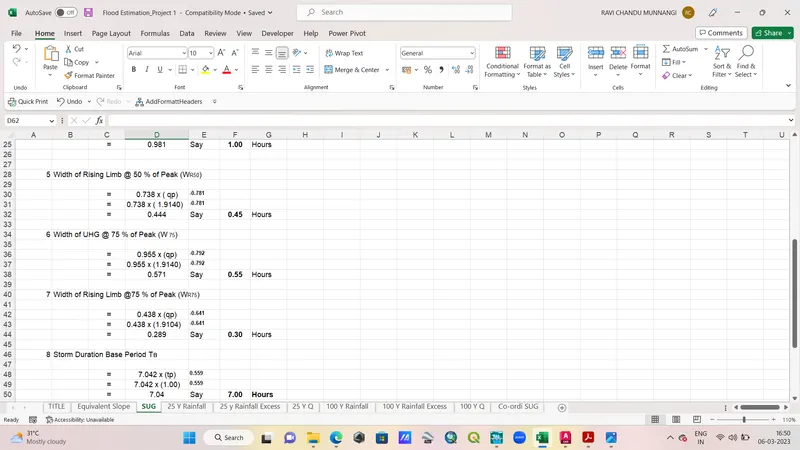
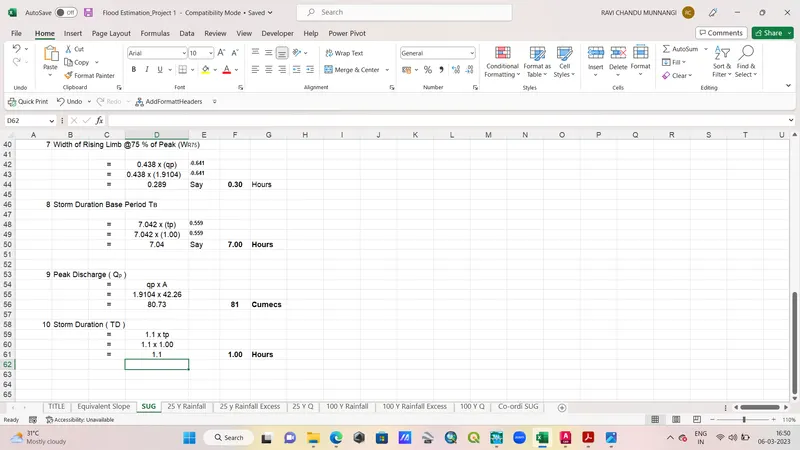
2. Compute SUG parameters as per CWC manual:
3. Calculate areal reduction factor for aerial rainfall for 25 year period:
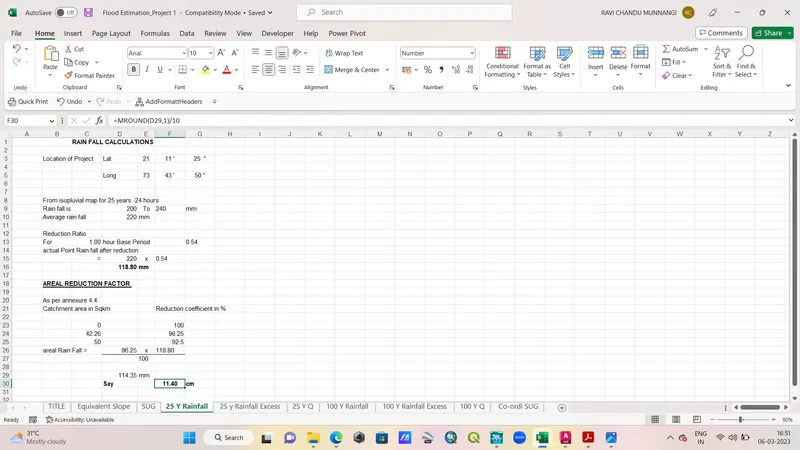
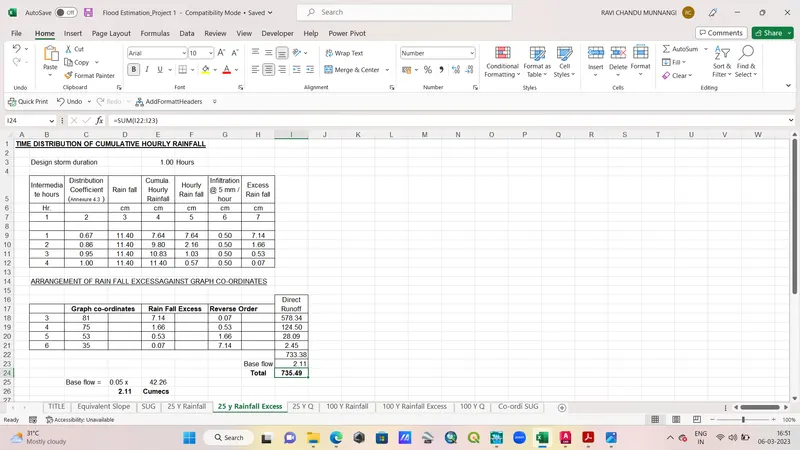
4. Calculate 25 year rainfall using distribution coefficients:
5. Calculate 100 year areal rainfall reduction factor:
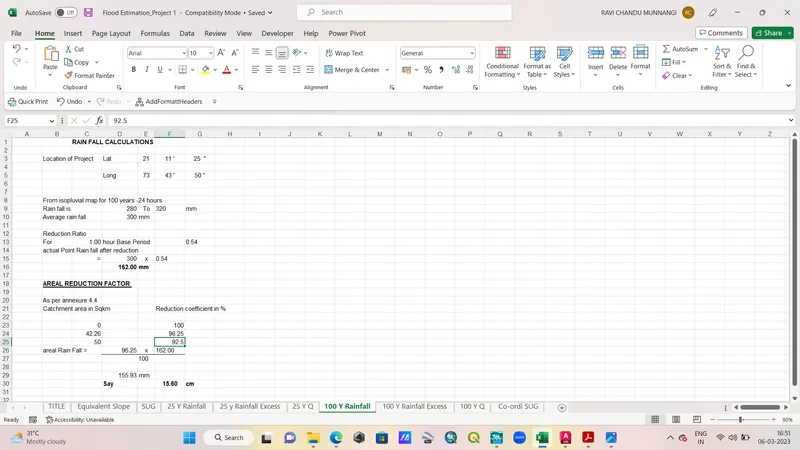
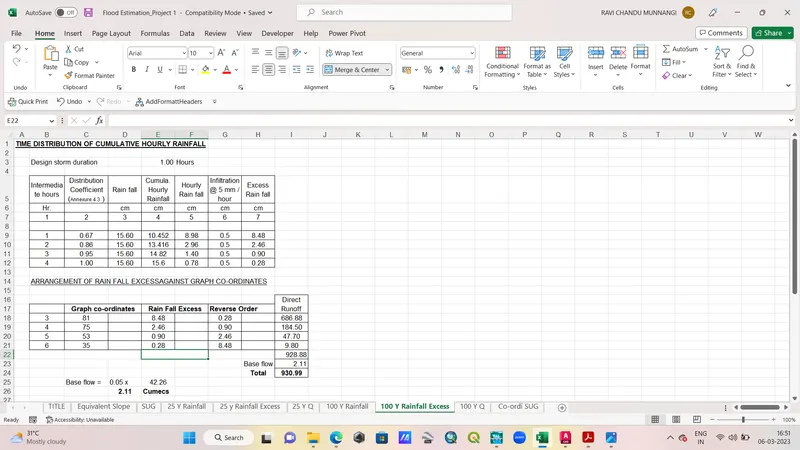
6. Comopute 100 year rainfall:
7. Final Hydrograph for given strom:
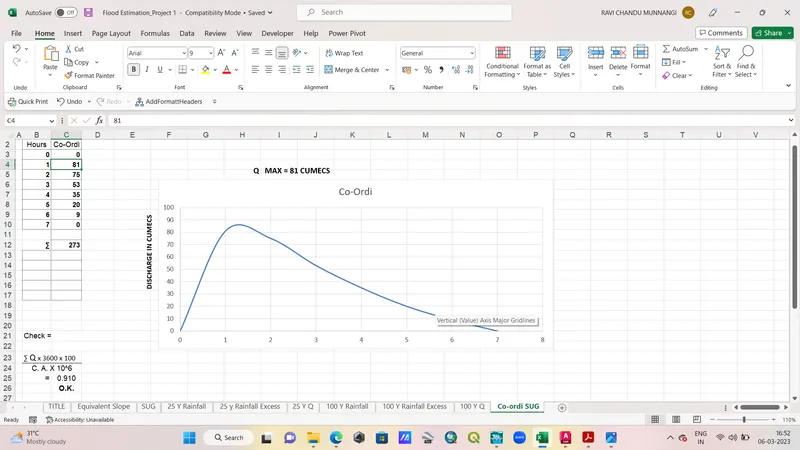
8. Peak Discharge Q: 81 Cumecs.
Peak Q is attained at 1 hour duration.
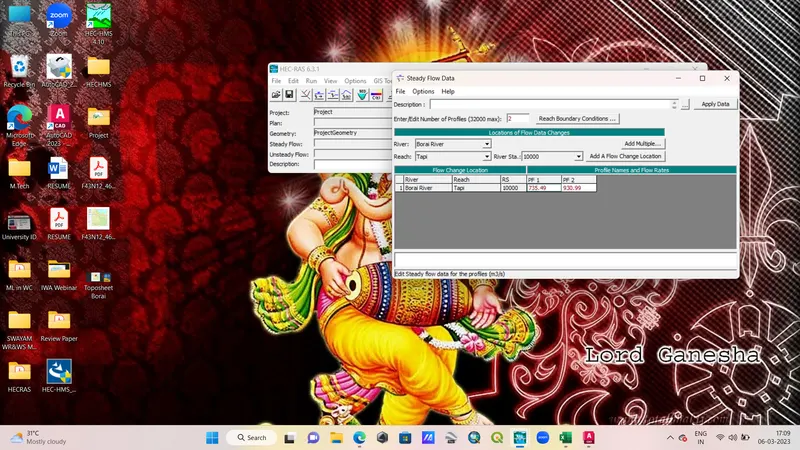
25 year peak flood: 735.49 Cumecs.
100 year peak flood: 930.99 Cumecs.
Entering Flow Data:
Open stady flow data window and enter profiles.
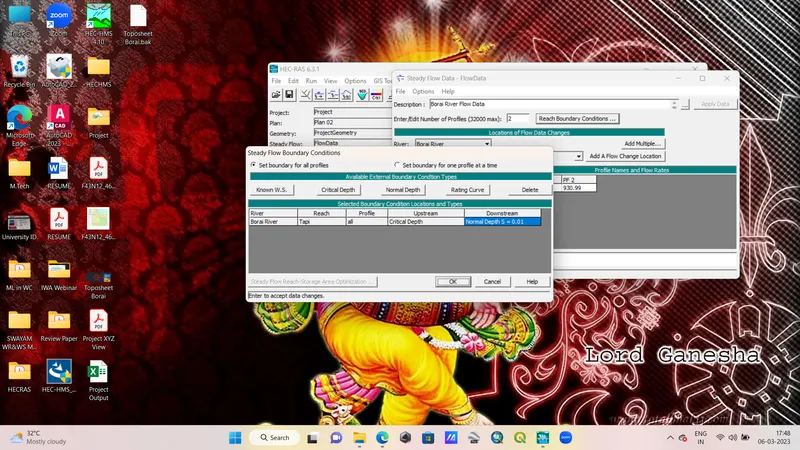
Enter Boundary conditions and save flow data:
Run the model:
Open steady flow analysis and give flow regime and compute:
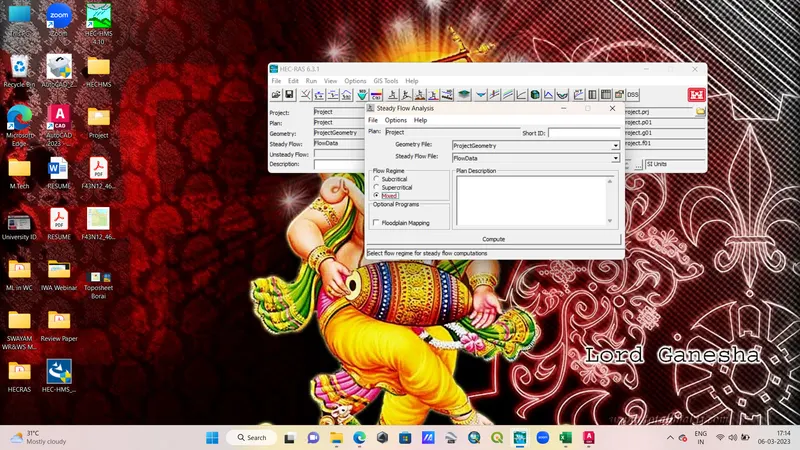
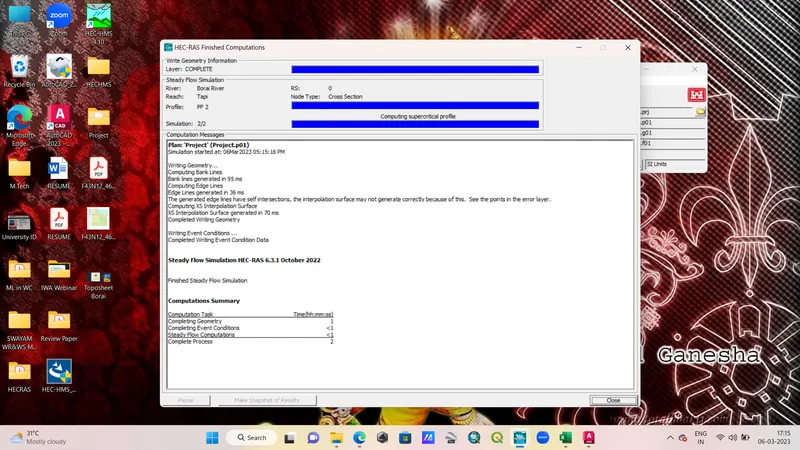
Comuputing is done as below, after completion close it:
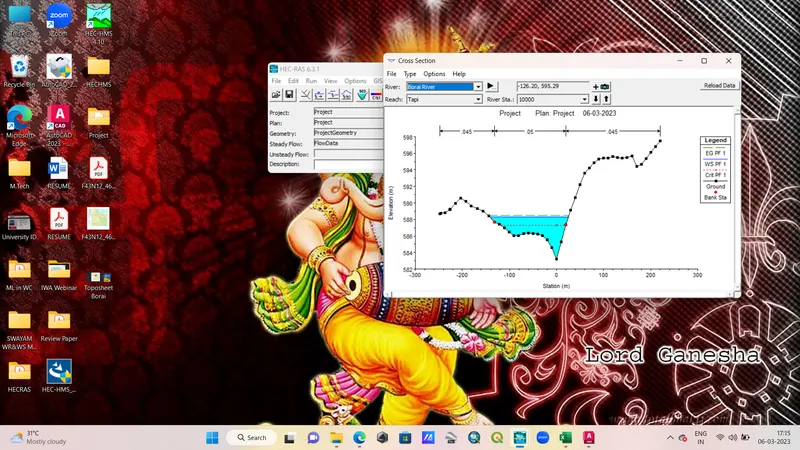
Cross section graphical view as below:
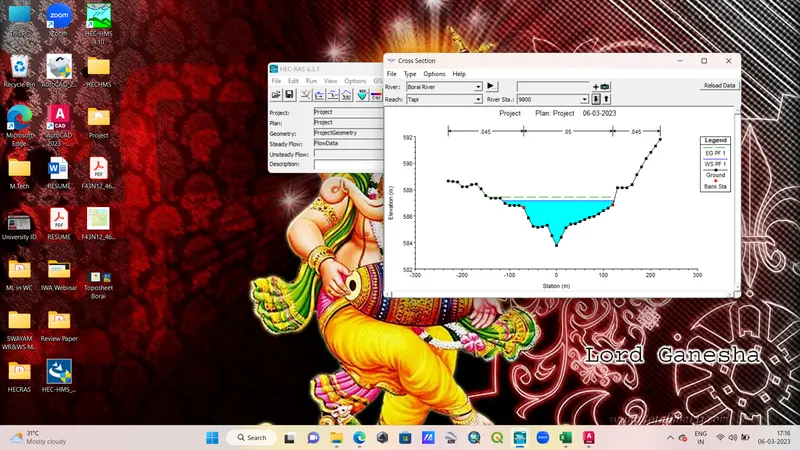
Result of Steady flow analysis:
Profile Output Table: This table presents data for all entered profile.
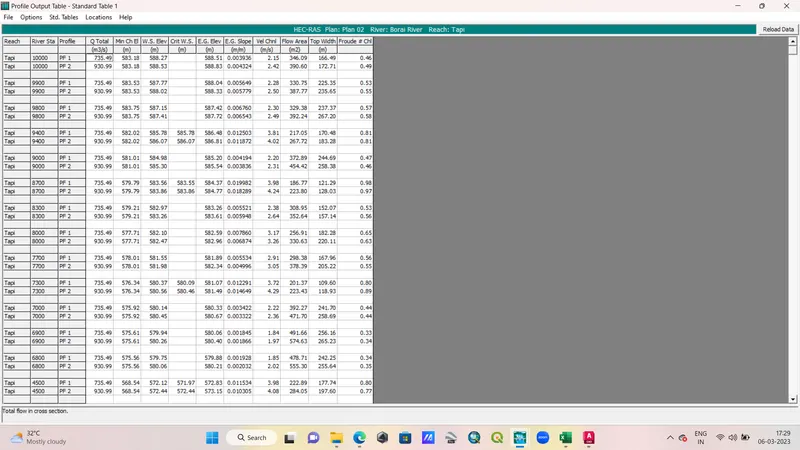
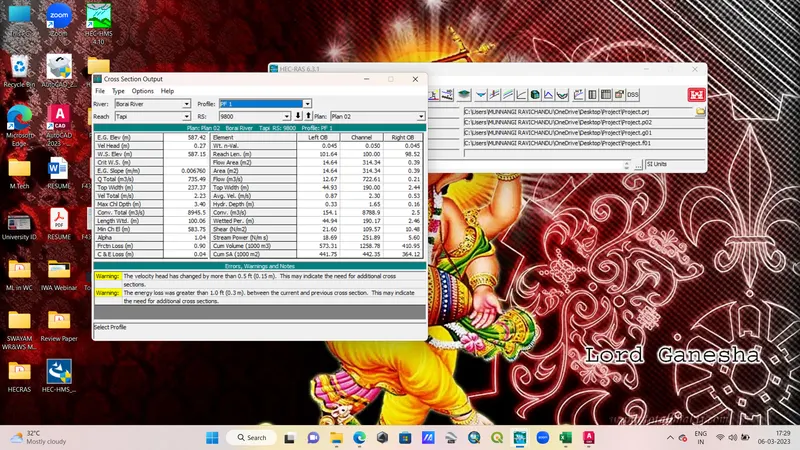
Cross-section Output Table: This table presents data to all banks of river.
XYZ Prespective View: This view represents the river model in 3D view.