Project 2
Objective of the Project:
Analysis of flood levels in a river.
Flood flow Computation.
Flood Analysis using GIS application RAS Mapper.
Steady and Unsteady analysis of flow in river.
River Reach:
Selected River: Musi River, Hyderabad, Telangana State, India. Musi river is the tributary to Krishna River.
Considered River Length: 94.4 KM.
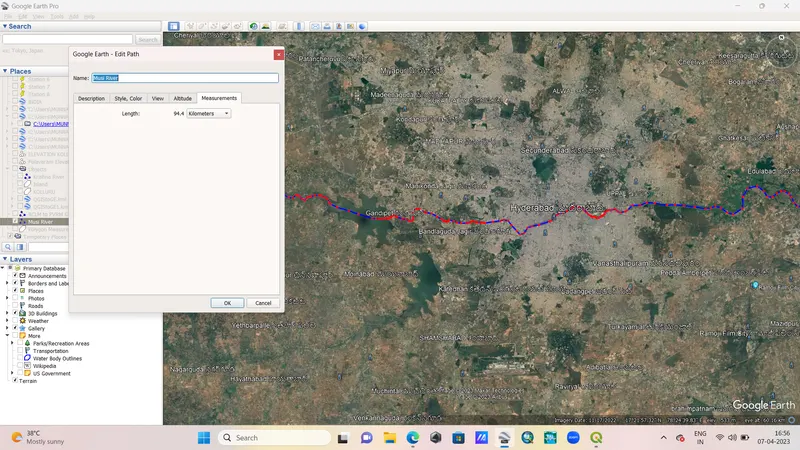
Creating boundaries in RAS Mapper:
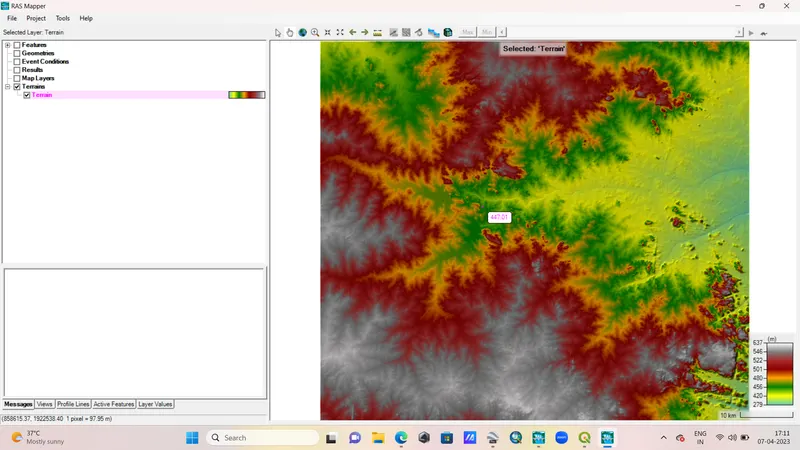
1. Create New Project, Set Units and Import DEM into RAS Mapper:
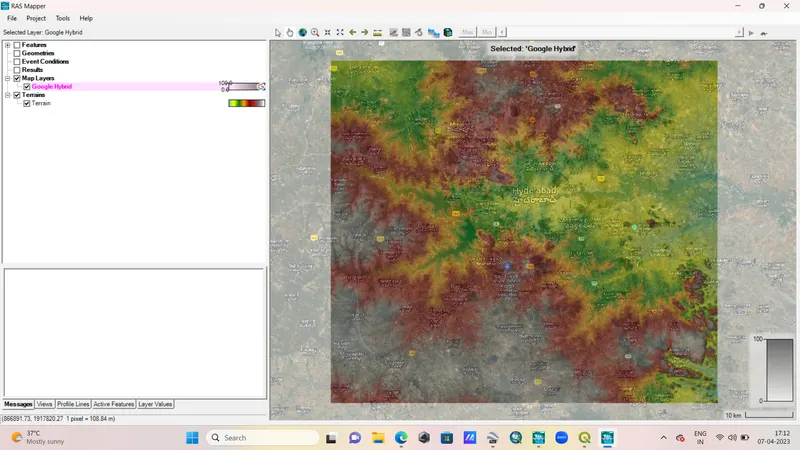
2. Add Web Imegery:
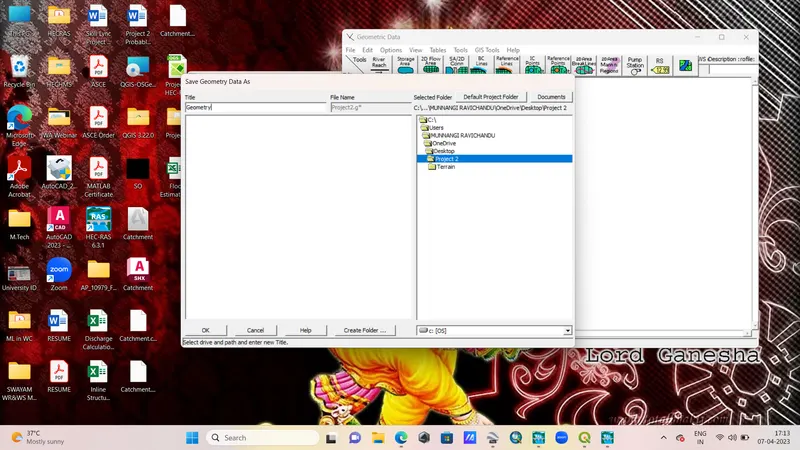
3. Save Geometry in Geometric Data Editor:
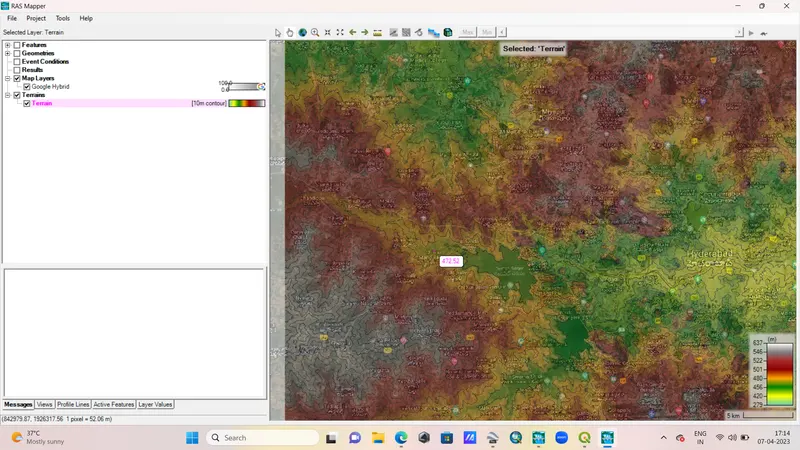
4. Plot Contours. I plot 10 m interval contours:
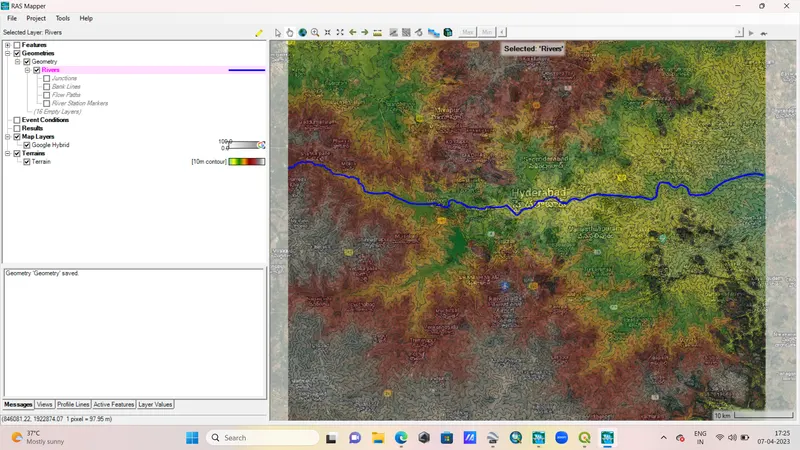
5. Draw River line using Geometry pointer:
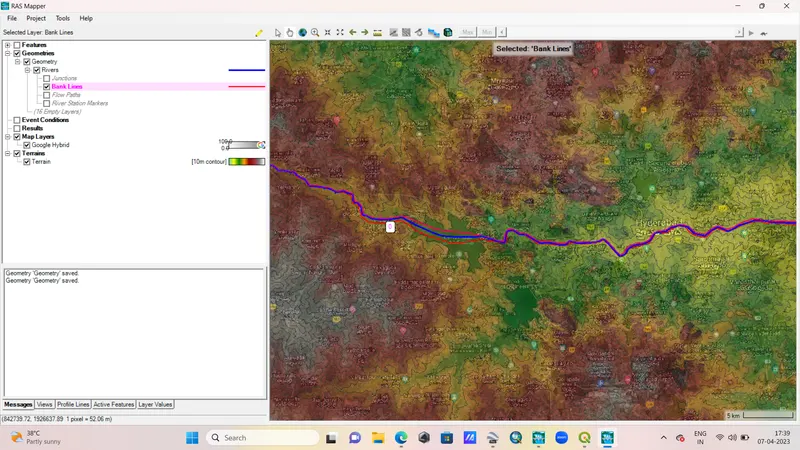
6. Draw Bank lines for left and right banks of the river.
7. Draw flow paths on Left and Right banks:
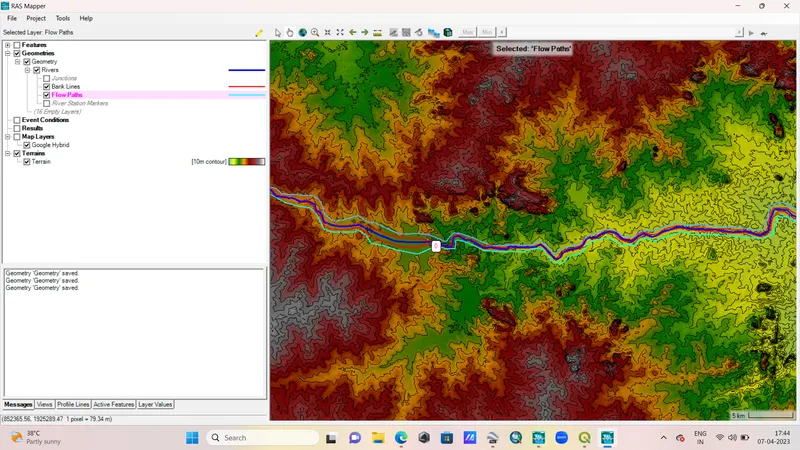
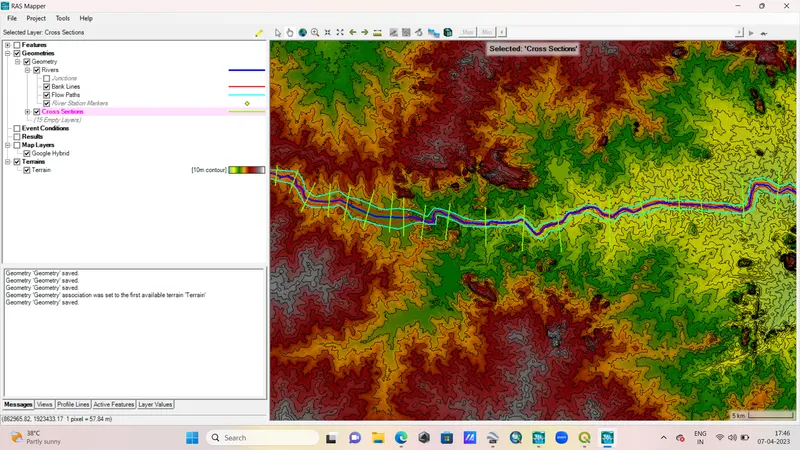
8. Draw Cross-sections across the river from upstream to downstream.
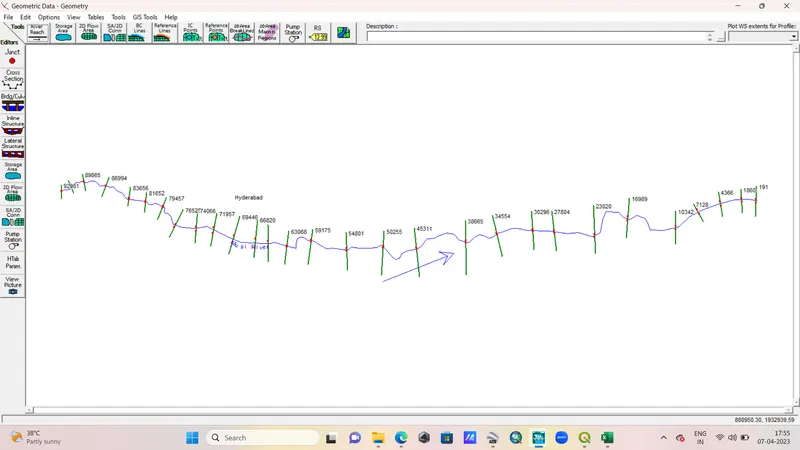
River Model in Geometric Data Editor:
Steady Flow Calculations:
I calculated stedy flow for 25 and 100 year return periods:
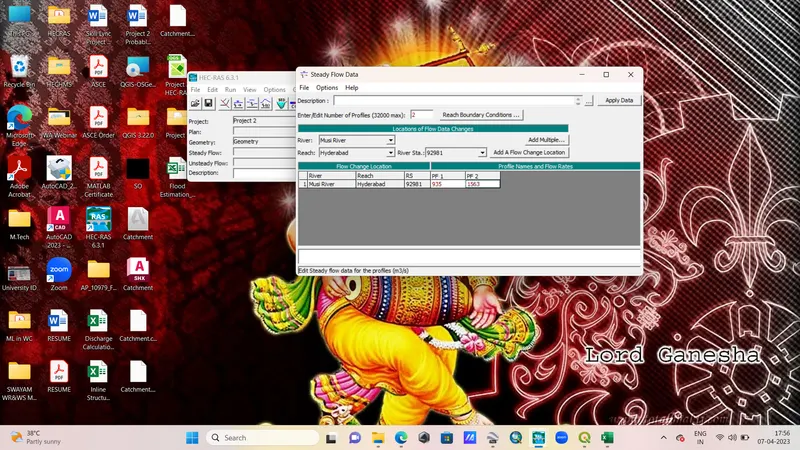
25 year return period flow: 935 Cumecs
100 year return period flow: 1563 Cumecs
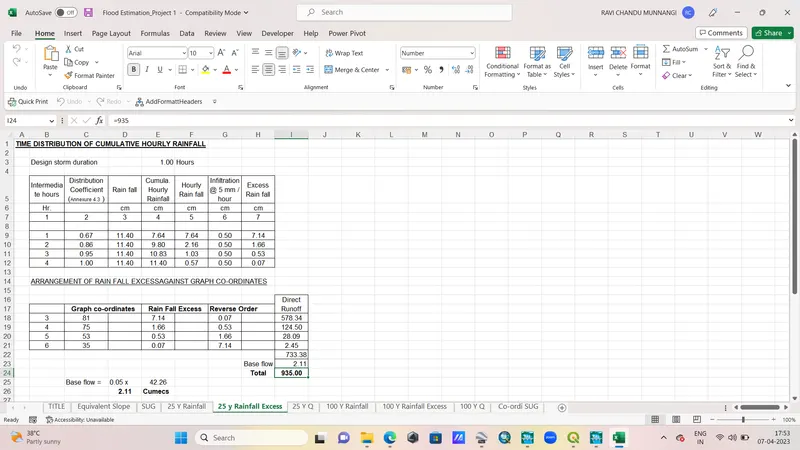
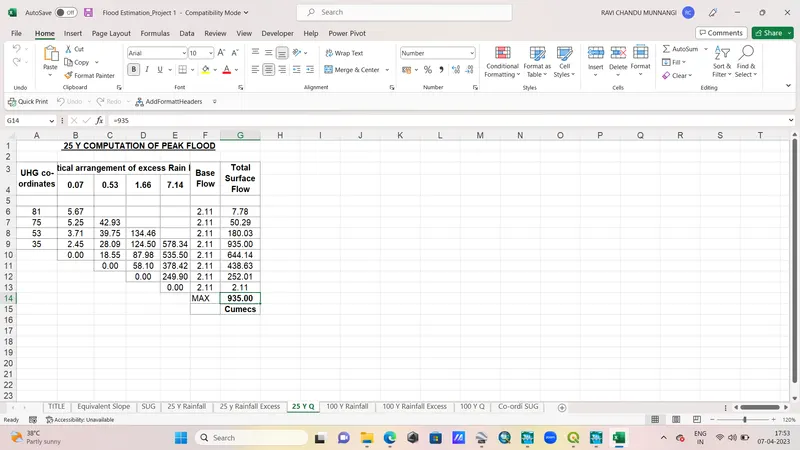
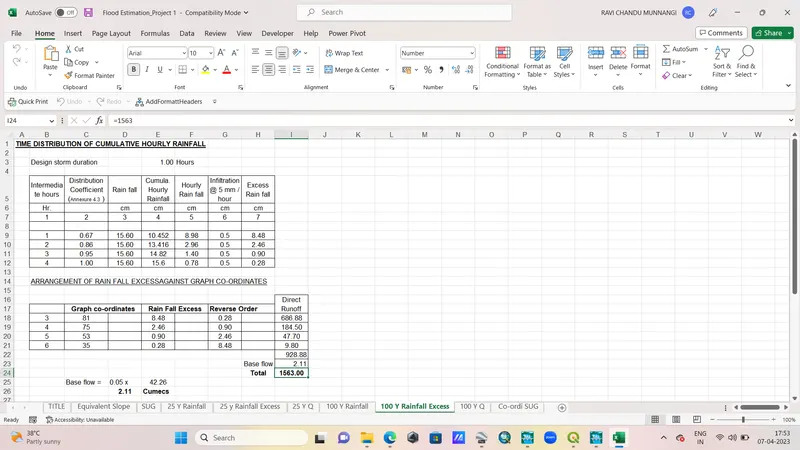
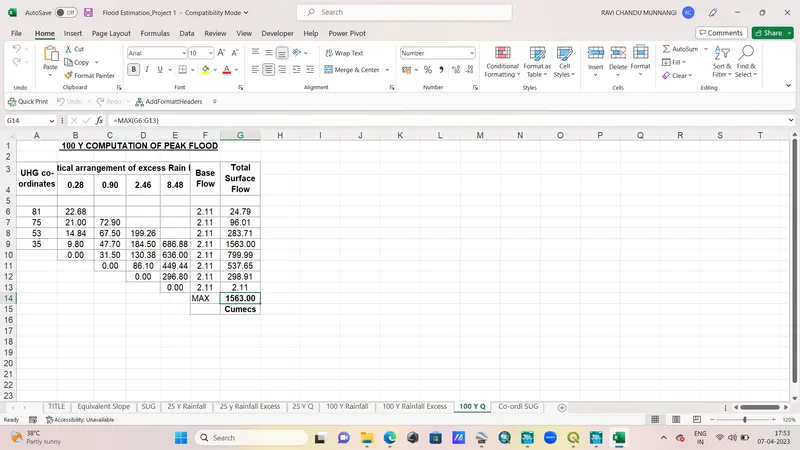
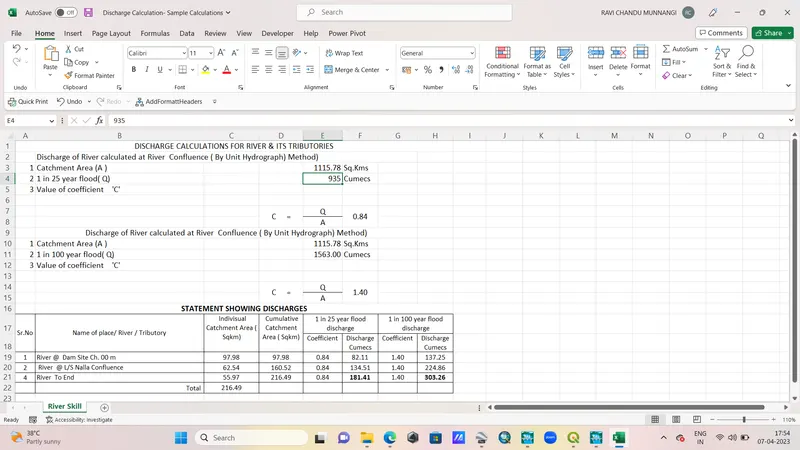
Discharge Claculation for Catchment area and Flow values: 1115.78 km2 and 935 and 1163 flows.
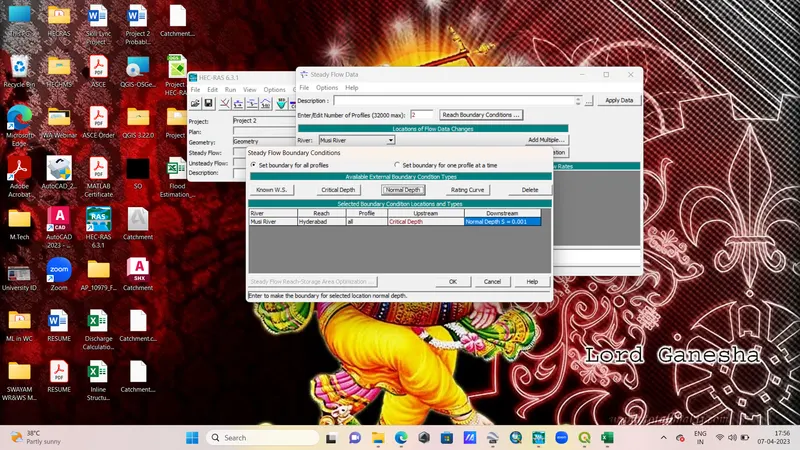
Goto Steady flow data and enter Profiles and Boundary Conditions and Save Flow Data:
Steady Flow Analysis:
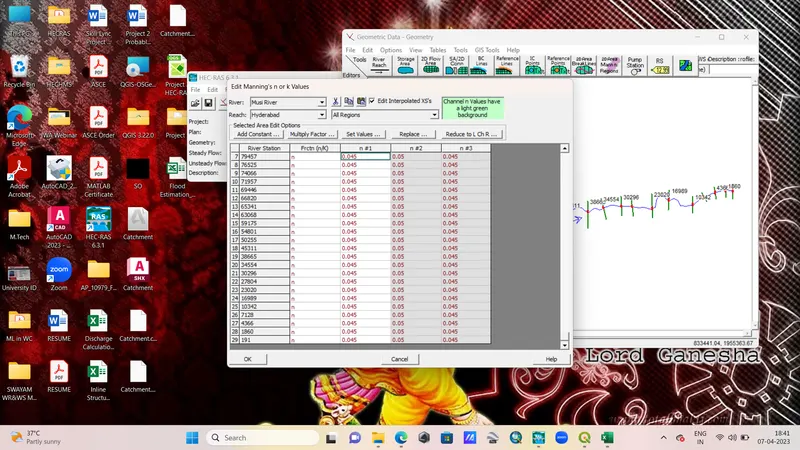
Open Geometric Data Editor and enter Manning's n values:
Open Steady Flow Analysis and enter Plan, Geometry and Steady Flow Data:
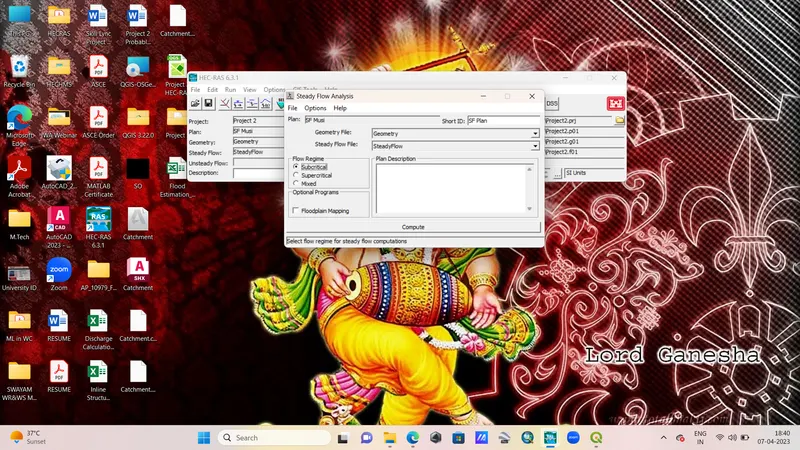
Compute the Flow Data:
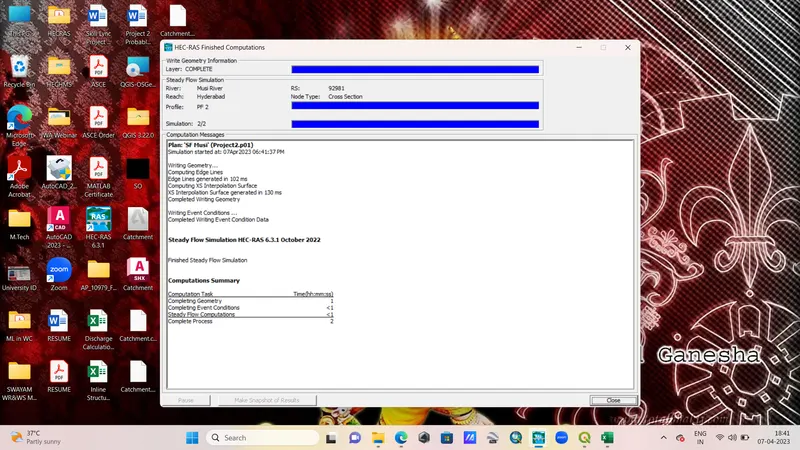
Sateady Flow Analysis Results:
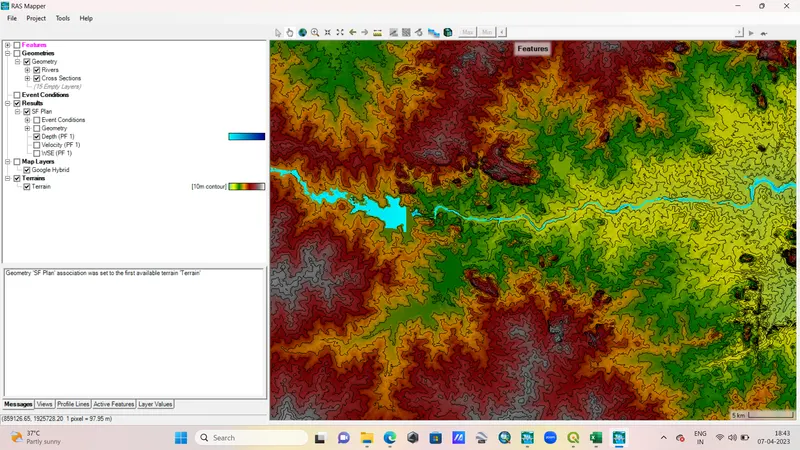
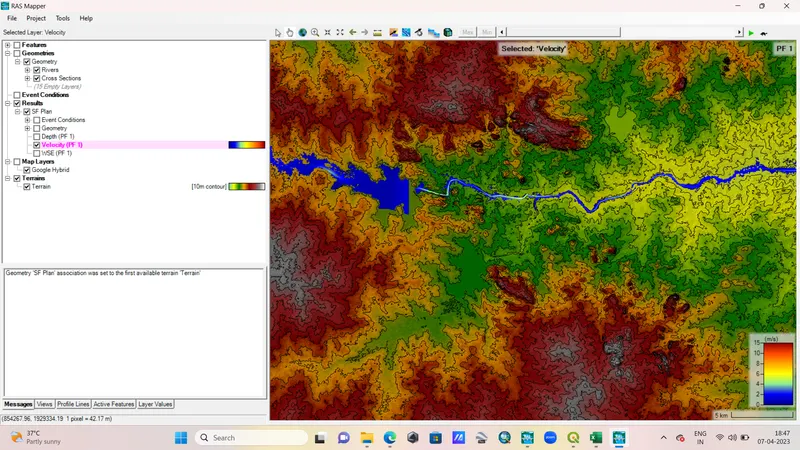
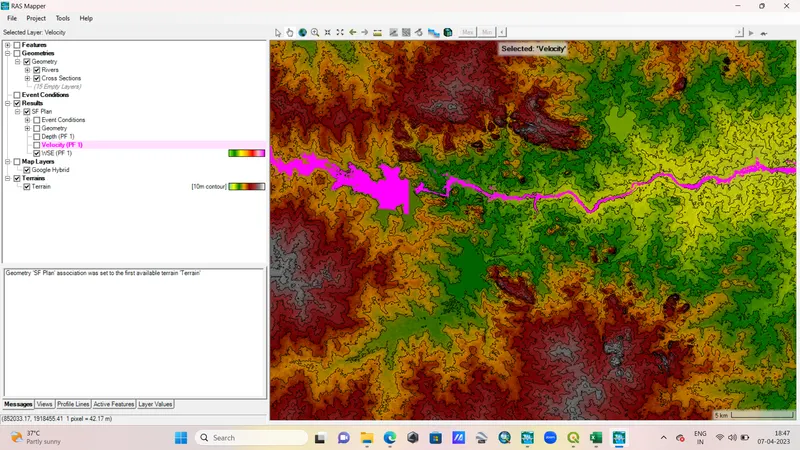
RAS Mapper Results: Depth, Velocity and Water Surface Elevation
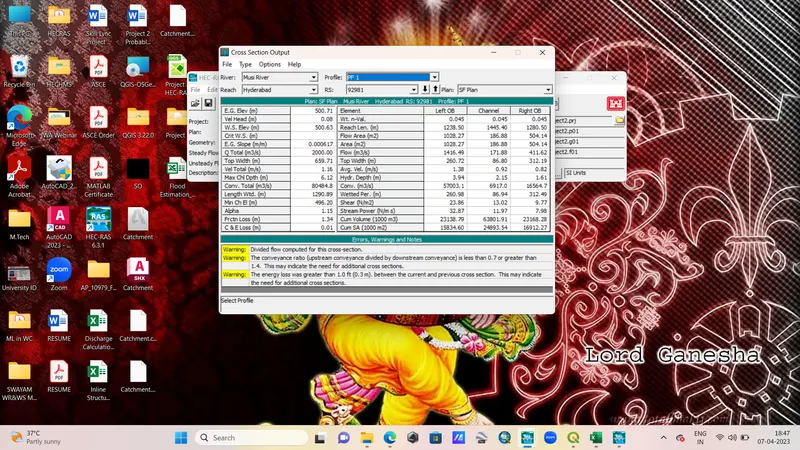
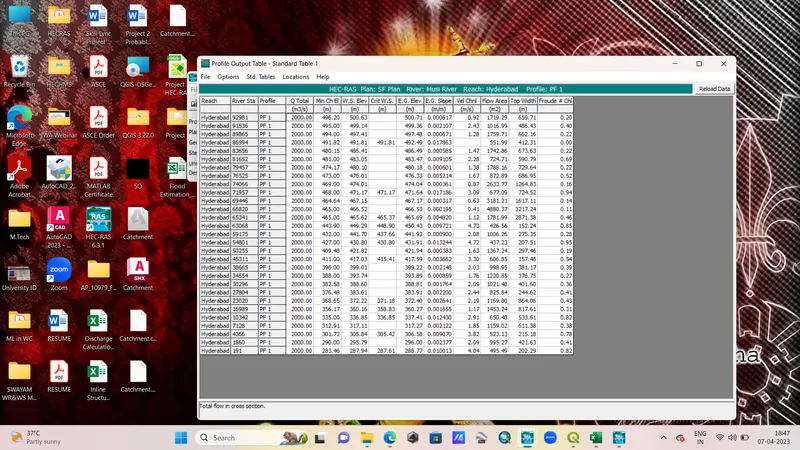
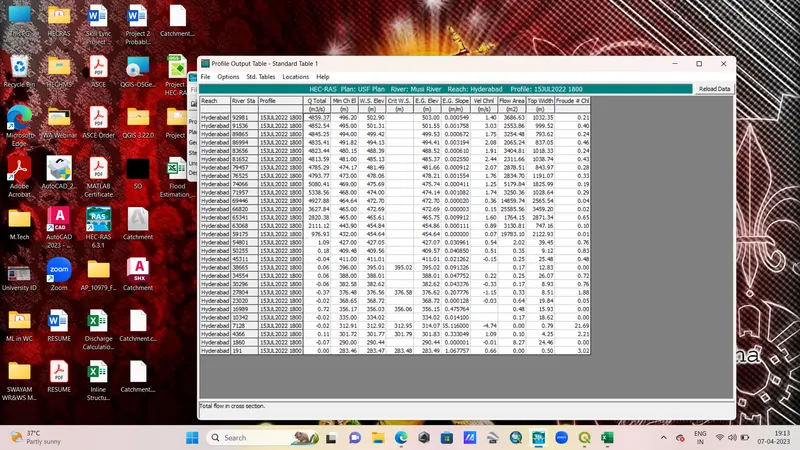
Cross-sectional and Profile Output Tables:
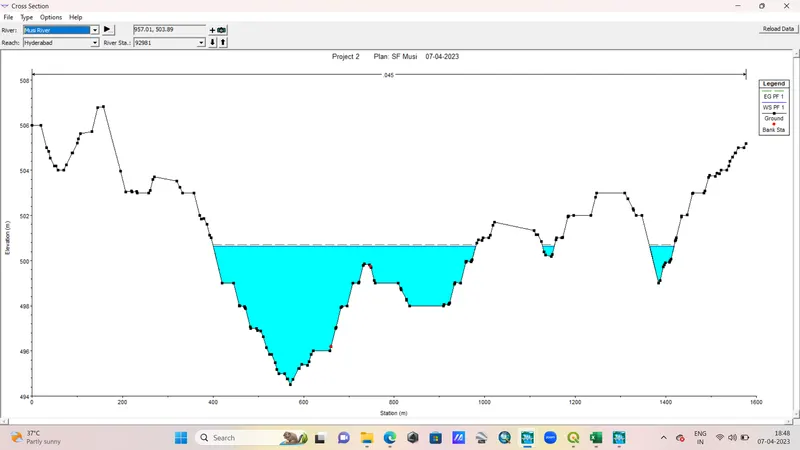
Cross-sectional View:
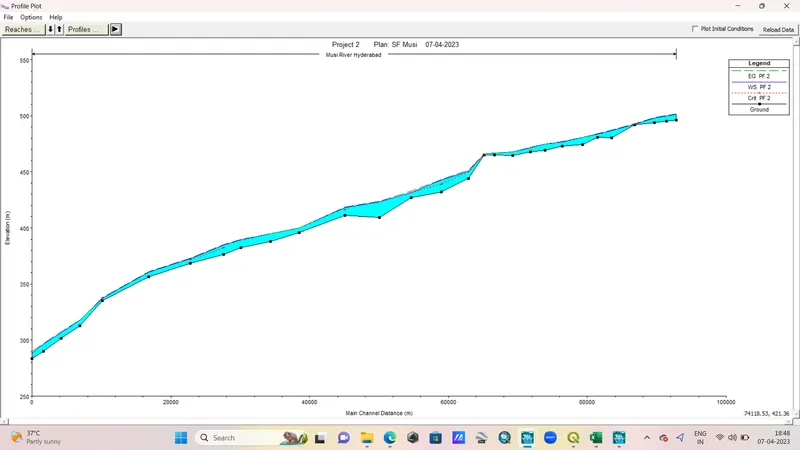
Profile Plot View:
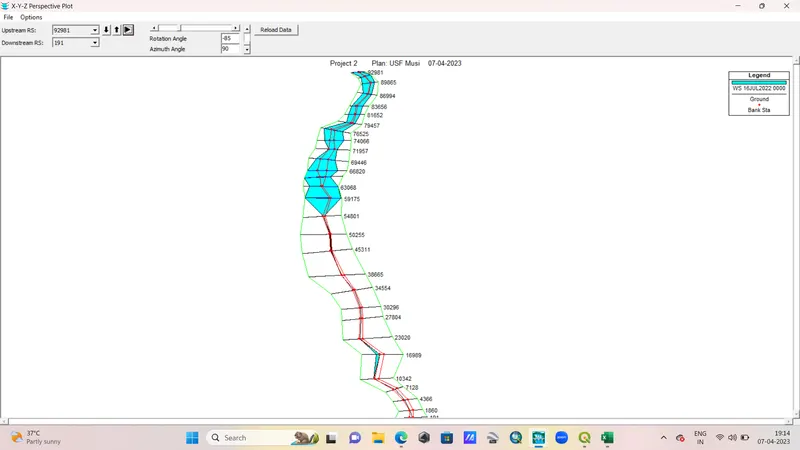
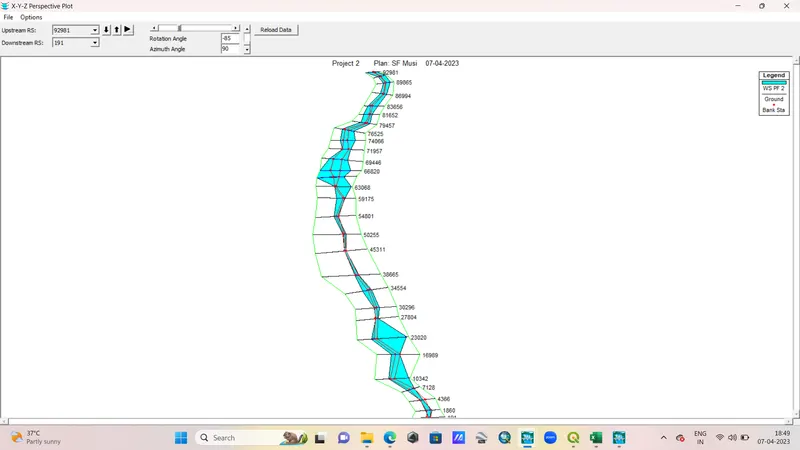
XYZ 3D View:
Unsteady Flow Analysis:
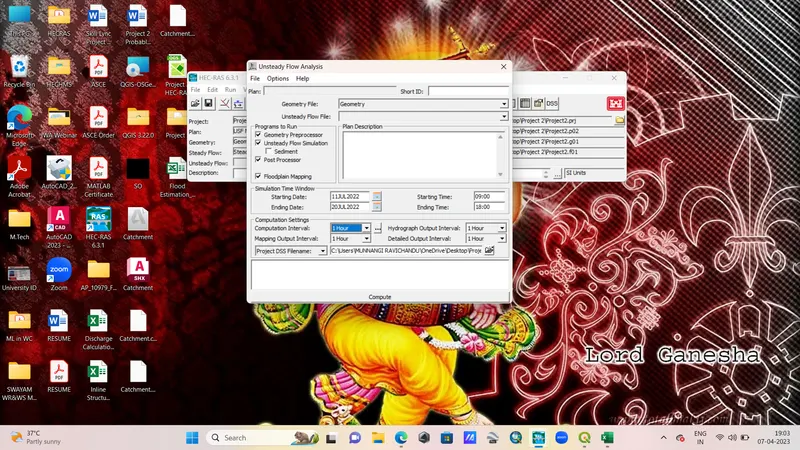
Open Unsteady flow analysis and enter plan, date, time and computing programs: Save Plan
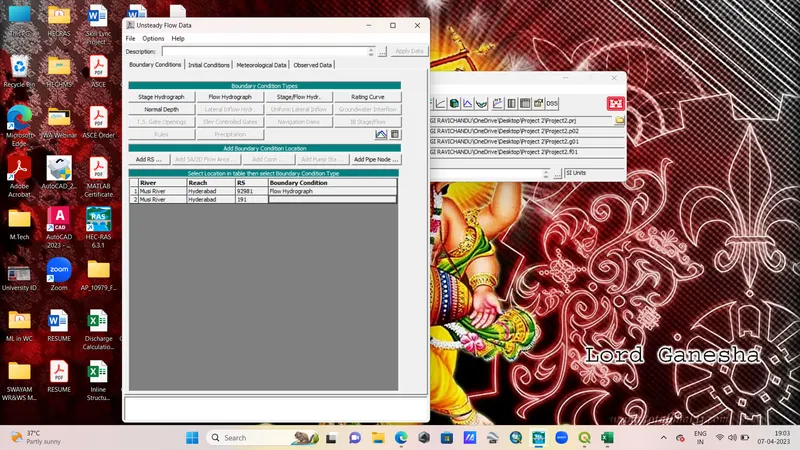
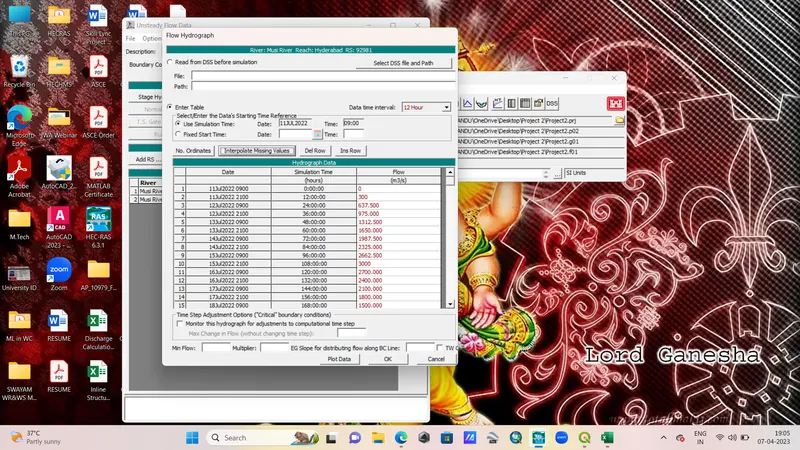
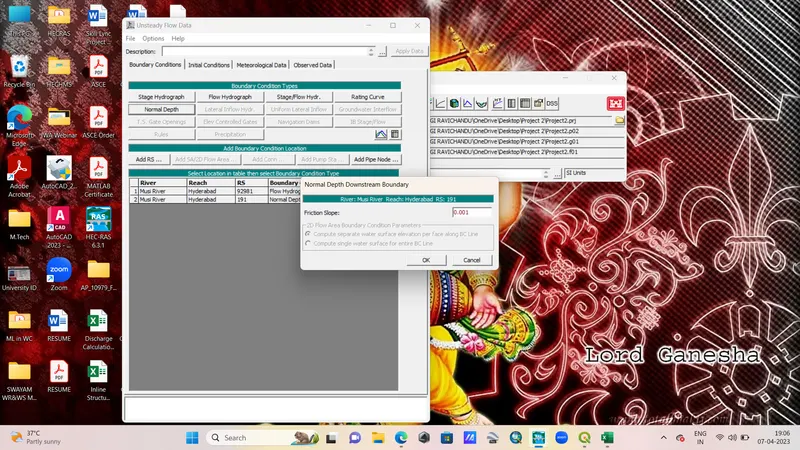
Goto Unsteady flow data, enter Flow Hydrograph and Normal Depth for U/S and D/S: Save Unsteady flow data.
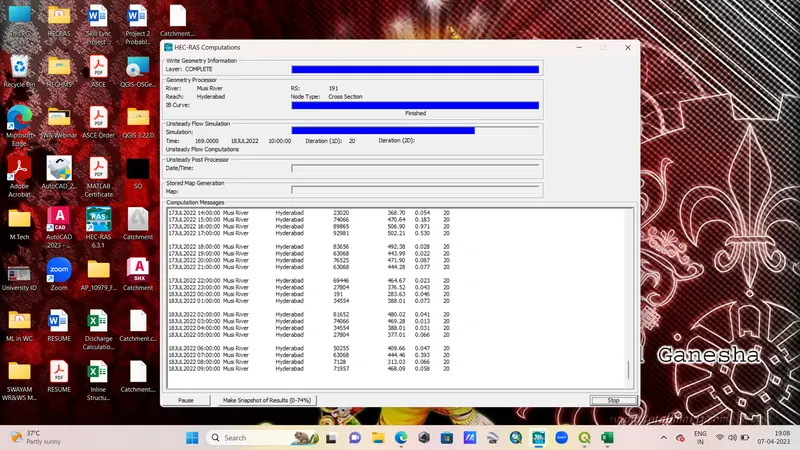
Compute Unsteady flow:
Unsteady Flow Results:
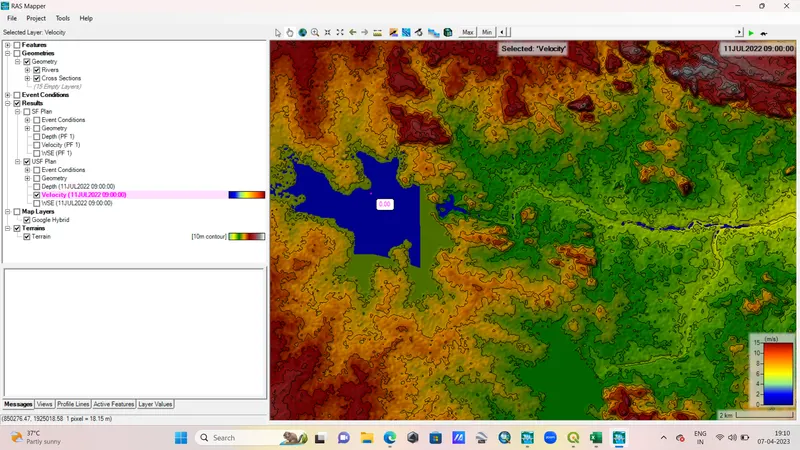
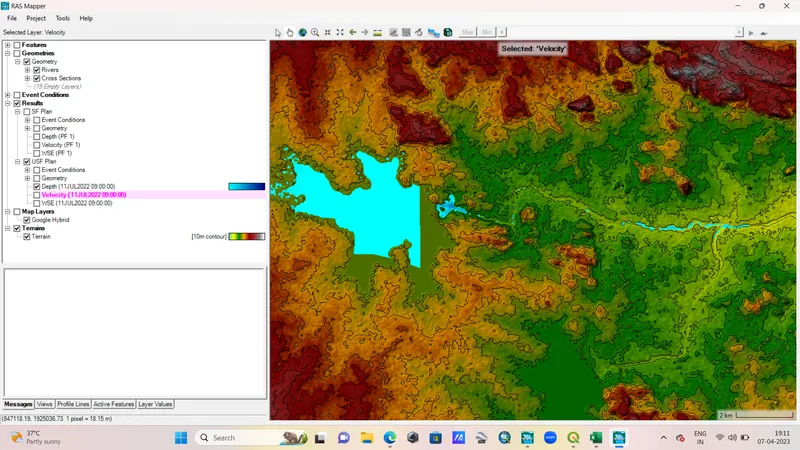
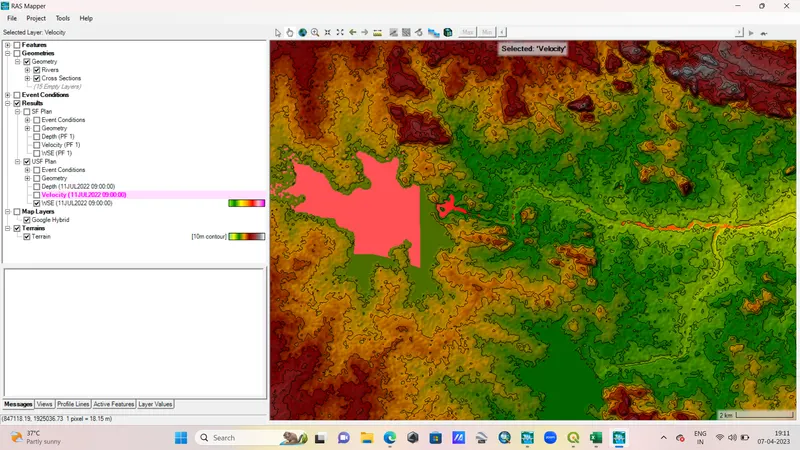
RAS Mapper Results: Depth, Velocity and WSE
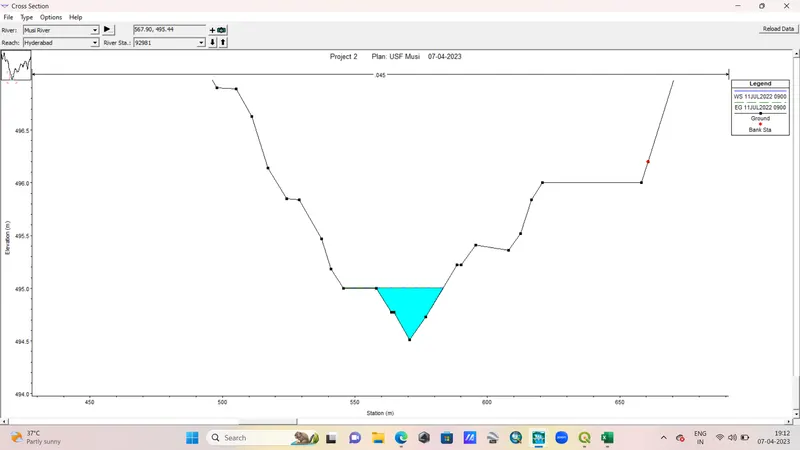
Cross-sectional View:
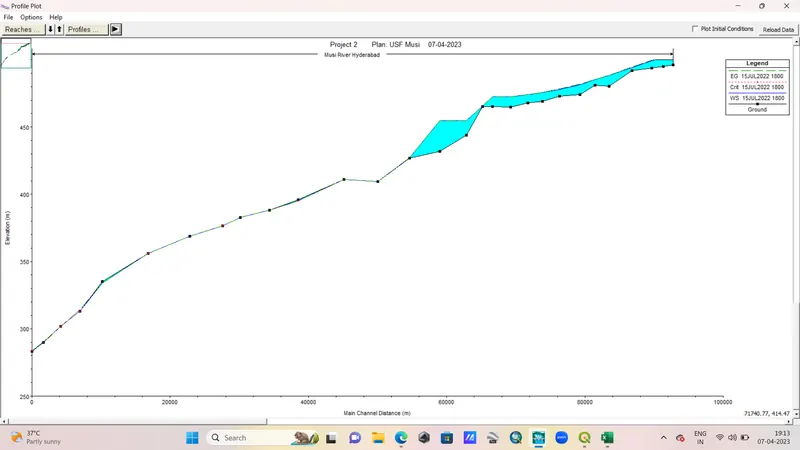
Profile Plot View:
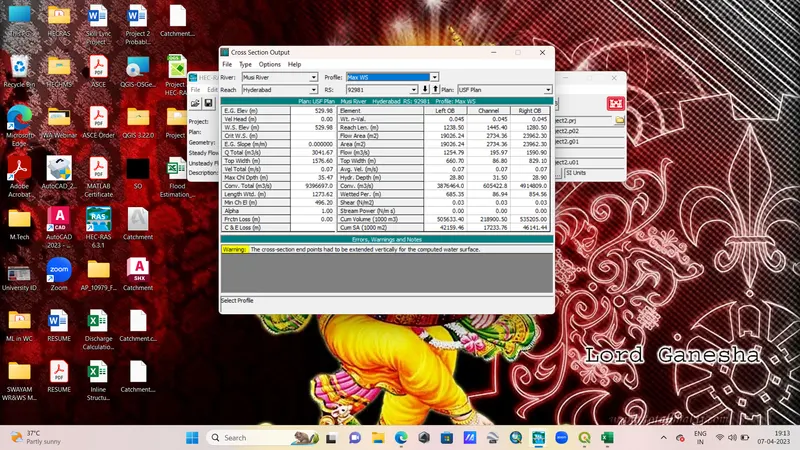
Cross-section and Profile Output Tables:
XYZ 3D View: