Project 1
The data seemed to have a lot of missing data with no column names.
- first had to asses the data to find out how many null values it had.
- '?' were placed instead of empty values. such values had to be removed and replaced with null value.
- Then each column was given name to ease the analysis process.
- removed normalized losses column since it has a lot of empty values and imputing may affect the outcome of the analysis.
- imputed the missing data with the most occuring value in the column.
- chose to use classification when using regression to find the price was the obvious,because i wanted to find out if choosing to classify the make of cars which had 22 different classes was viable.
- the dependant variable which is the make of the car was label encoded and the independent variables were one hot encoded.
- then the data was split and feature scaled to use Random Forrest classification.
- used for loop to find the optimum number of trees.
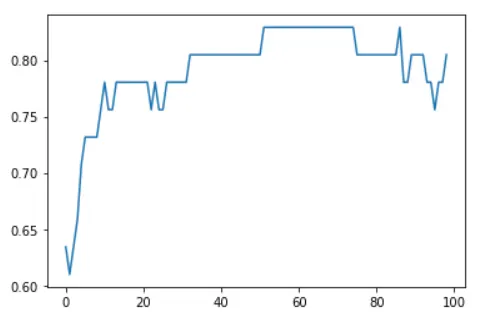
- the classification returned an accuracy of 0.829.
The program and data files are attached below.