Modelling and simulation of flow through a flowbench
AIM: To create a 3D model of a flow bench and run flow analysis. You will be obtaining a plot of lift vs mass flow rate.
Explanation of the entire case setup:
- DESIGN: We have to create the model’s cylinder, inlet port, and valve.
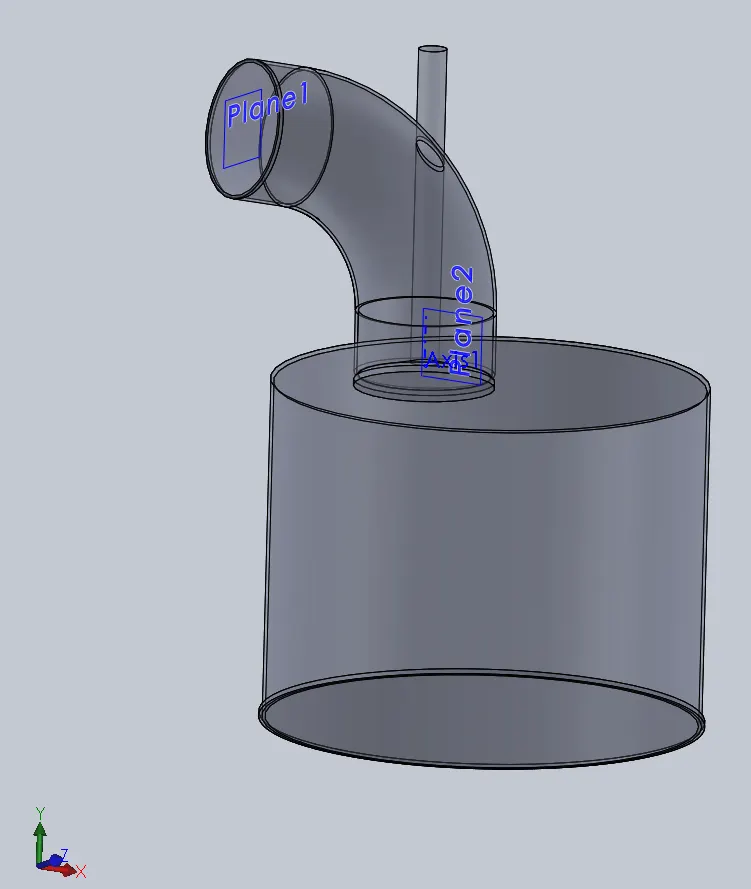
First, to create a cylinder select the top plane draw the circle of 70 mm diameter and extrude it by 110 mm to the downward direction.
Now select the front plane to sketch the port draw a line perpendicular to the top circular surface of length 70 mm, draw another line parallel to the top circular surface and perpendicular to the previous line, and with the length 70 mm. Now use the fillet option to generate the curve of 50 mm radius between the lines. Go to features and click on reference planes and select the plane option now select the line and the point where we want to create the plane. Now draw a circle of radius 22.5 mm on the new plane, go to features select swept boss now select the circle and the line it has to be swept on. Now over the port is Reddy.
Go to features and click on the shell option and select one face of the port and exit face of the cylinder to make the model hollow.
To create the valve first we have to create the go-to features and click on the reference plane and select the axis option and select the port now the axis is created and again go to features and click on reference plane and select the plane option and select the axis and right plane to create a plane on the center axis of the port to create the valve. Draw the valve with help of line command and give all the dimensions and make sure the valve moves only in up and down motion without changing in any dimensions. Now go to features click on the revolved base option and select the sketch and click ok. Now over design is completed.
Go to the flow simulation tab and click on create lid option and select the inlet face of the port and exit face of the cylinder to make the model completely close for the analysis.
Final design:
- CFD ANALYSIS:
Go to the flow simulation tab click on wizard option and create a simulation domine.
Computational domine:
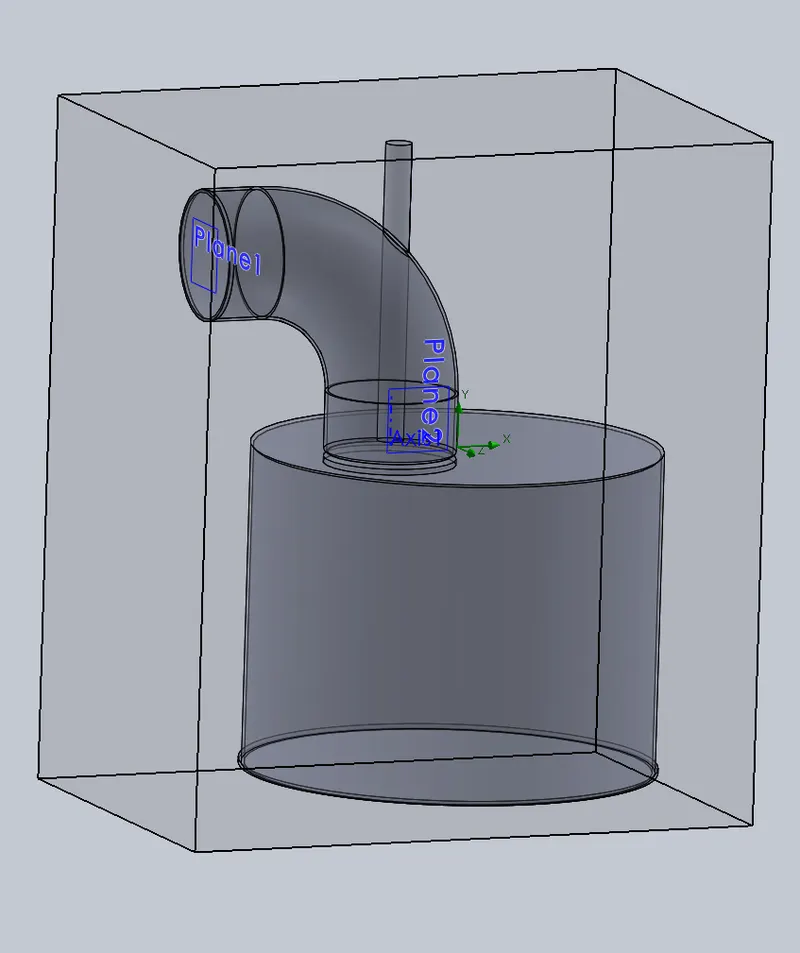
First, we have to run a Grid dependence test in order to determine the optimum mesh size for the analysis starting for three to six as grid size run your simulation at a particular valve lift.
Comparing the results in order to define optimum mesh size. Here we are comparing the cut plot results of the velocity of the fluid at various mesh sizes.
|
S.no |
MESH SIZE |
MAXIMUM VELOCITY (m/s) |
PERCENTAGE CHANGE IN VALUE |
|
1 |
3 |
144.158 |
|
|
2 |
4 |
149.329 |
3.46 % |
|
3 |
5 |
152.762 |
2.24% |
|
4 |
6 |
184.614 |
17.25% |
Mesh view:
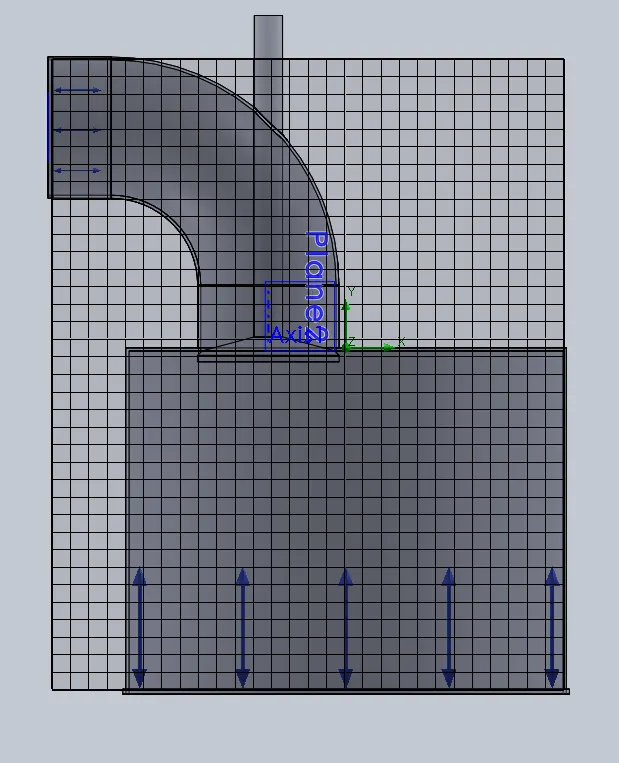
As we compare the results the mesh size of 6 is the optimum choice for the analysis for its accurate results.
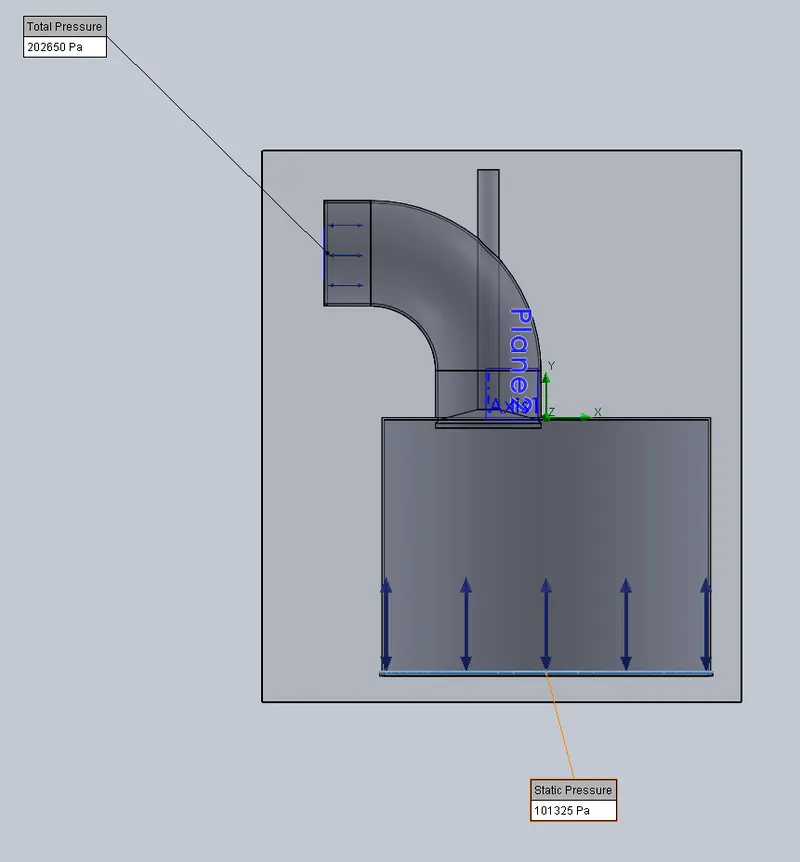
After setting up the computational domine we have to set the boundary conditions to right-click on boundary conditions and select insert boundary conditions inlet as total pressure of 2 atm. And outlet boundary condition is static pressure of 1 atm.
Boundary conditions:
Now we are setting the goals now right-click on goals and click on insert global goals is to be set up a mass flow rate. And select the surface goals to be the same mass flow rate.
Now we are setting the mesh with the right clicks on global mesh and editing the mesh size to be 6 and insert local mesh on the surface of the valve.
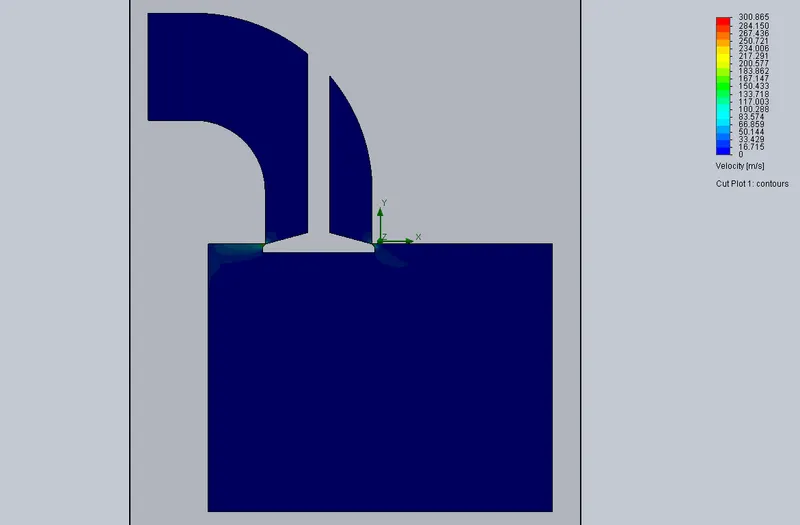
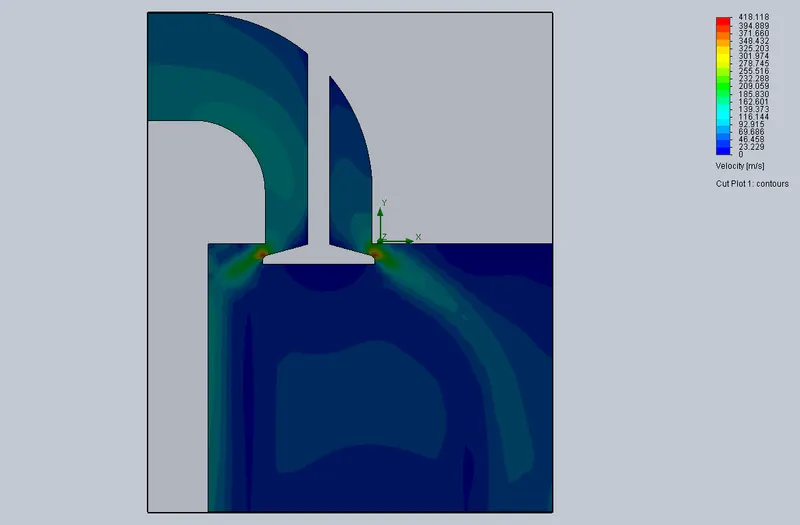
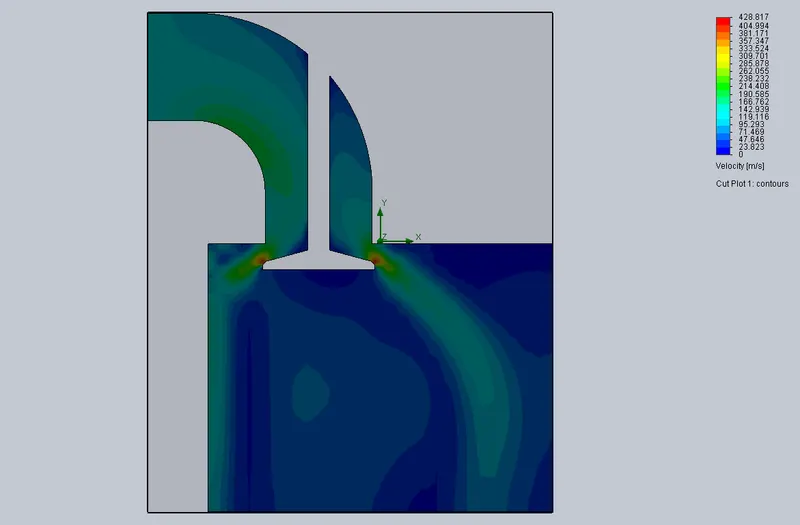
Now insert the cut plot on the front plane for showing the velocity results.
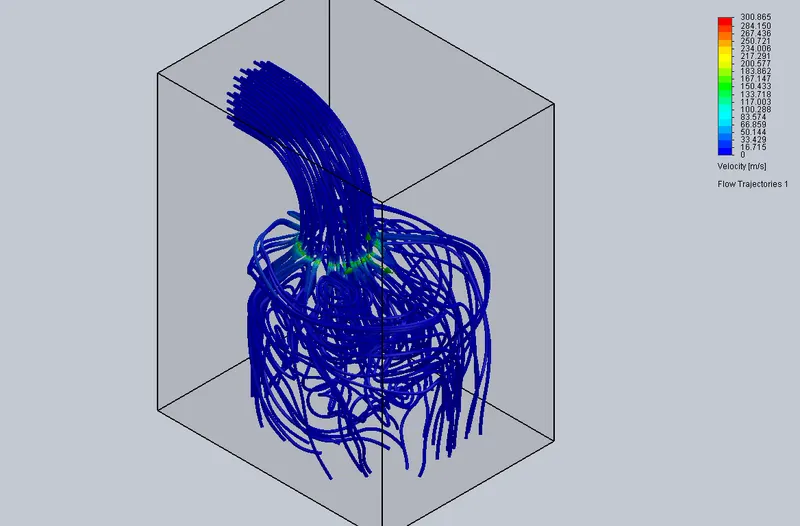
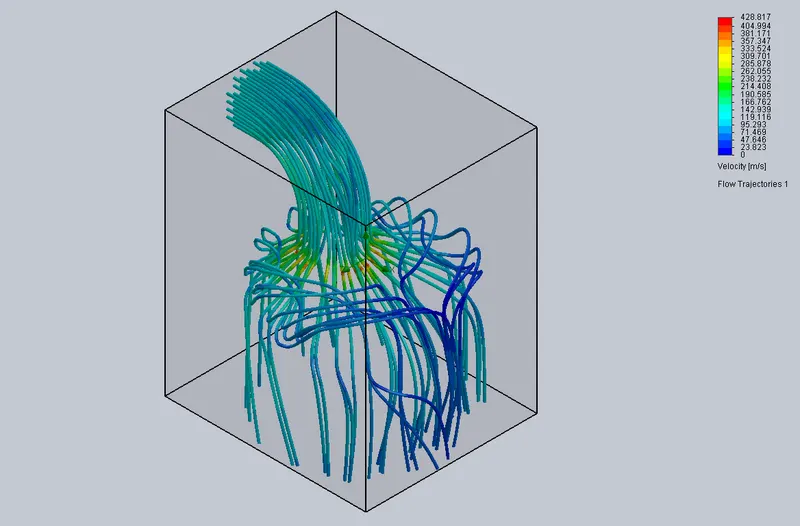
Now insert flow trajectory by selecting the inlet face.
Results and explanation:
We do this analysis to make Shure whether the pressure difference is sufficient for over required mass flow and also to calculate the pressure losses due to roughness factor, curve path, etc.(to determine whether we have to give increase /decrease the pressure at the inlet by help of pump,).
Here the fluid flow occurs due to pressure difference at the inlet of the port and outlet of the cylinder.
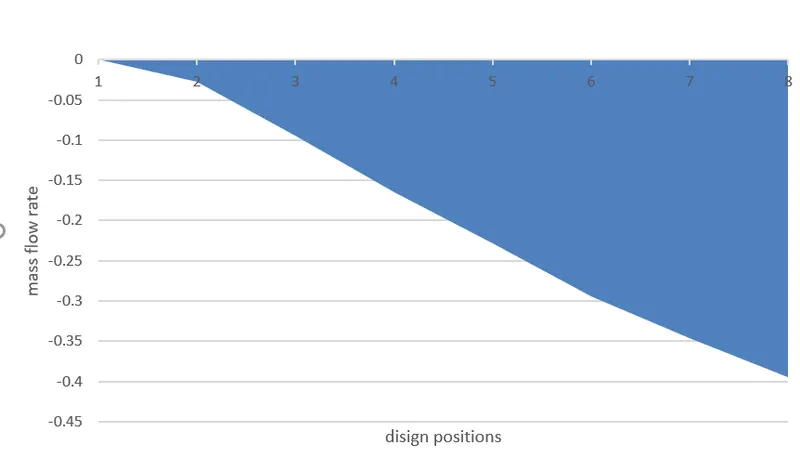
We are running a parametric study on opening the inlet valve let us assume that the valve is going to open from 1 mm to 8 mm. we had divided it into 7 parts and measured change in mass flow rate, velocity, and the trajectory of the fluid due to varying in valve position.
For changing the position from 1 to 8 mm there are changes :
- due to change in area mass flow rate increases.
- due to pressure difference the velocity increases.
- due to an increase in area, there is new trajectory of the fluid is changing.
Table and plot of mass flow rates at various positions:
| Goal (Value) | Design Point 1 | Design Point 2 | Design Point 3 | Design Point 4 | Design Point 5 | Design Point 6 | Design Point 7 |
| D8@[email protected] [m] | 0.001 | 0.002166667 | 0.003333333 | 0.0045 | 0.005666667 | 0.006833333 | 0.008 |
| SG Mass Flow Rate 1 [kg/s] | -0.027427992 | -0.094919808 | -0.164881005 | -0.22782994 | -0.29402587 | -0.345533142 | -0.395035114 |
Velocity Cut plot Results: flow trajectory:
at 1 mm:
at 2.166 mm:
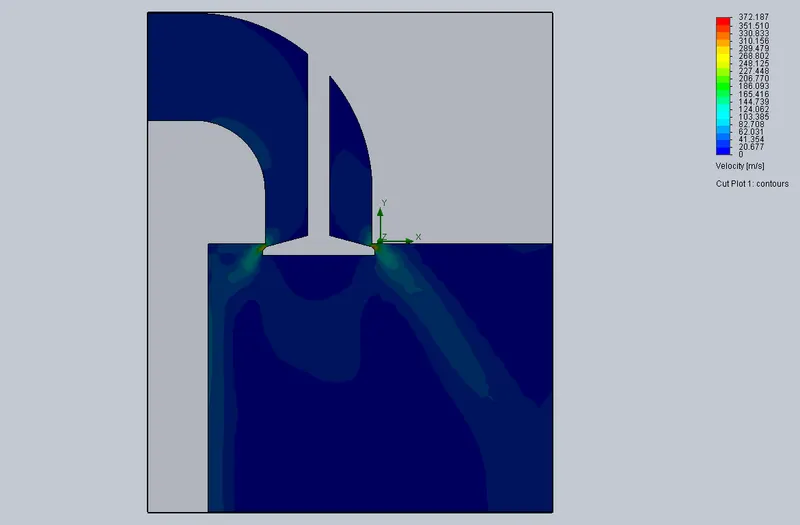
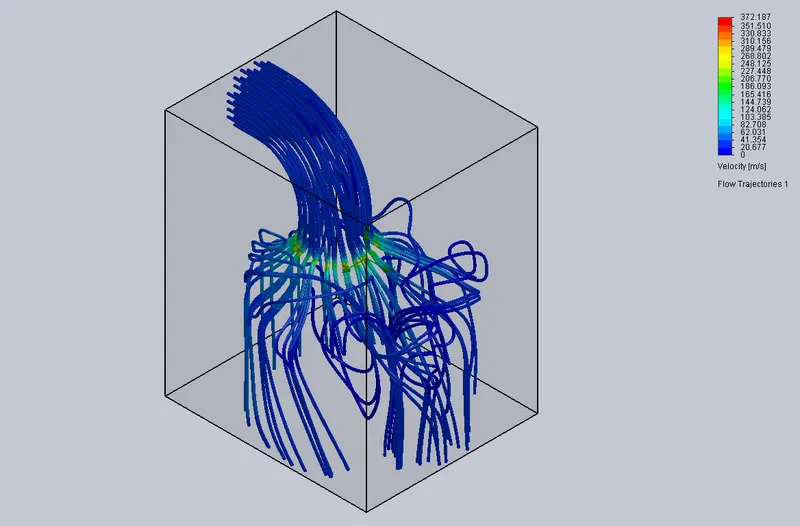
at 3.333 mm:
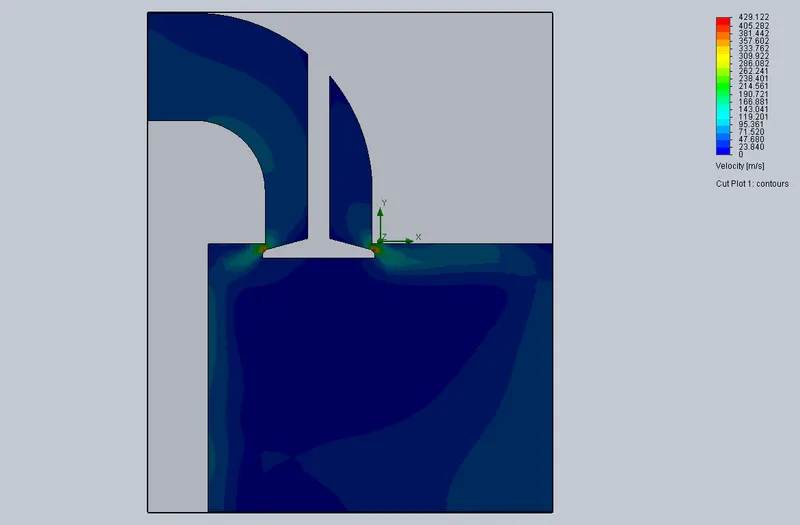
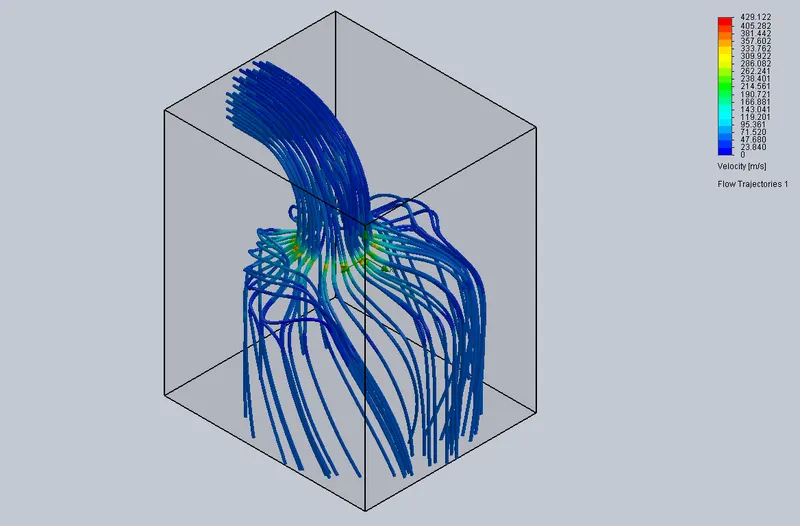
at 4.5 mm:
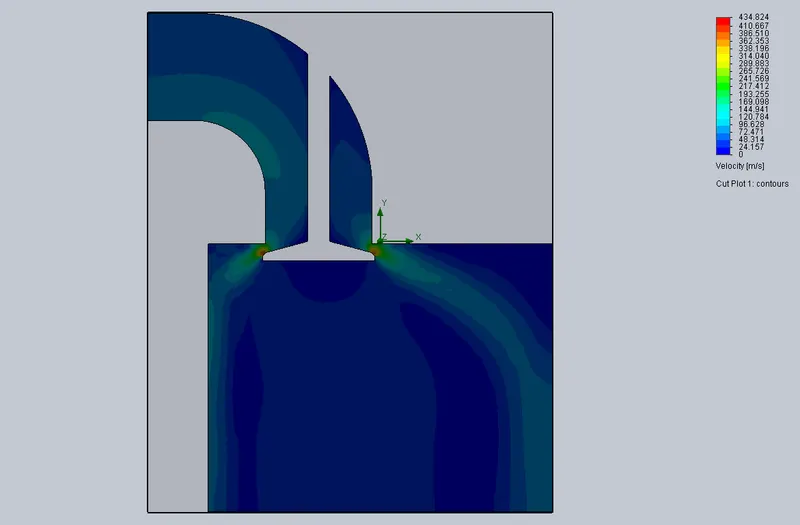
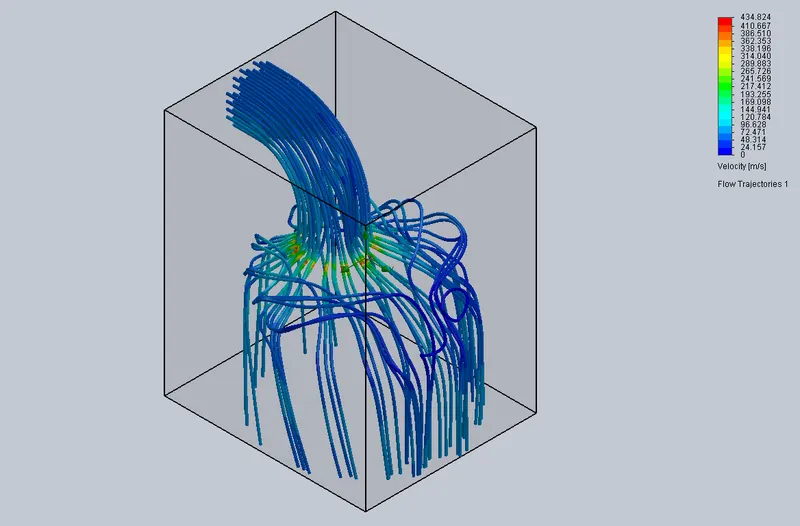
at 5.66 mm:
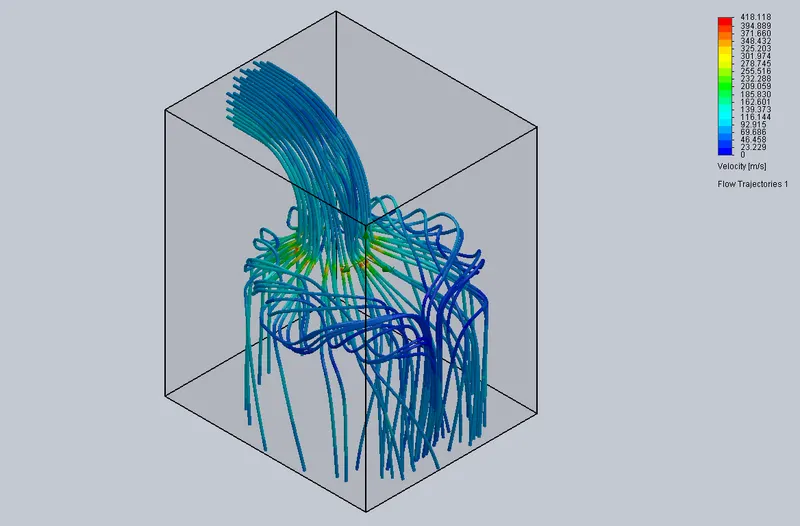
at 6.8 mm:
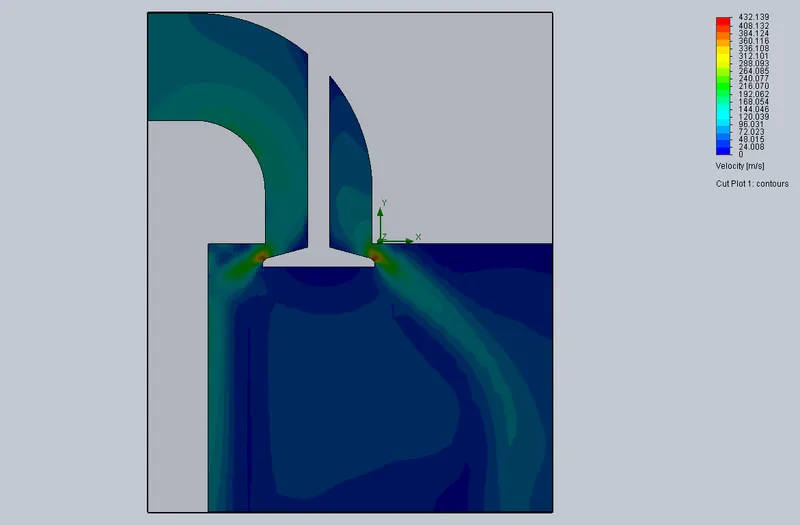
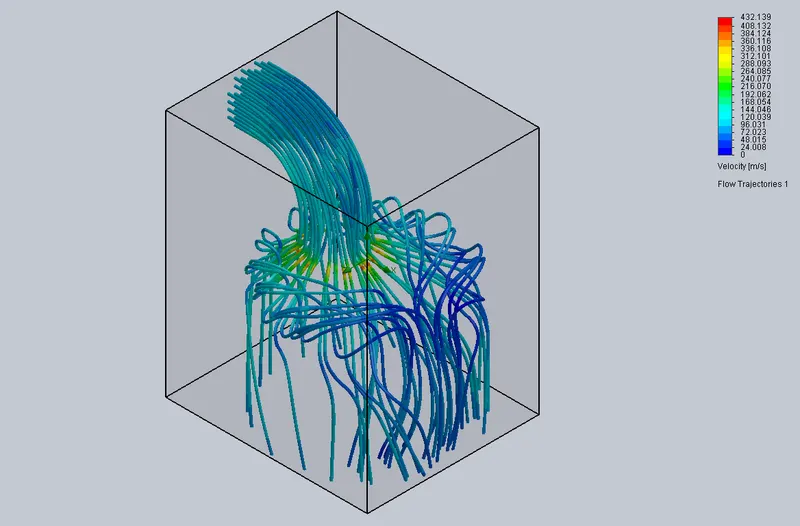
at 8 mm:
T