Modelling and simulation of flow through a flowbench
Aim: To study the flow bench simulation and to select the best mesh size and to run the parametric study on different valve lift.
Objective:
- Perform grid dependency test
- Study of parametric study of valve lift
- Plot the graph between mass flow rate and valve lift
Theory:
An air flow bench is a device used for testing the internal aerodynamic qualities of an engine component and is related to the more familiar wind tunnel.
It is used primarily for testing the intake and exhaust ports of cylinder heads of internal combustion engine. It is also used to test the flow capabilities of any component such as air filters, carburetors, manifolds or any other part that is required to flow gas. A flow bench is one of the primary tools of high performance engine builders, and poeting cylinder heads would be strictly hit or miss without it.
Creating flow bench geometry
Cylinder length: 20 mm
Cylinder inside diameter: 20 mm
Inlet port diameter: 5 mm
Assuming velocity in x direction is 10 m/s.
Total pressure:
Total pressure is the measure of the total energy of the airsteam and is equal to static pressure plus velocity pressure.
Static pressure:
Static pressure is the pressure that a fluid exerts when it is not moving.
Problem statement:
For this project, you will create a 3D model of a flow bench and run flow analysis. You will be obtaining a plot of lift vs mass flow rate
You need to do the following
- Grid dependence test
- For three grids run your simulation at a particular valve lift and explain your results
- Effect of valve lift on mass flow rate
- Once you have decided the best grid, run a parametric sweep to show the effect of valve lift on mass flow rate
- Result
- Grid Dependence test:
Considering the valve lift as 1 mm and run the simulation for the level of initial mesh size 4, 5 and 6.
For mesh size 4
For mesh size 5
For mesh size 6
- Valve Lift Parametric study:
Consider the valve lift from 1 mm to 8 mm and run the study and obtain the results.
Valve lift 0.001 m
Cut plot for velocity
Cut plot for pressure
valve lift 0.00275 m
Cut plot for velocity
Cut plot for pressure
Valve lift 0.0045 mm
Cut plot for velocity
Cut plot for pressure
Valve lift 0.00625
Cut plot for velocity
Cut plot for pressure
Valve lift0.00 8
Cut plot for velocity
Cut plot for pressure
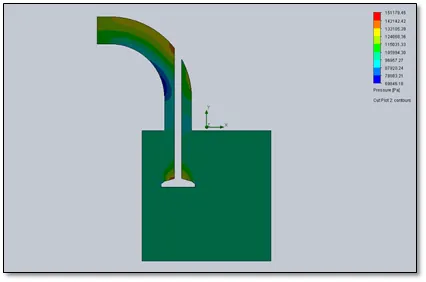
- Plot for mass flow rate for different valve lift
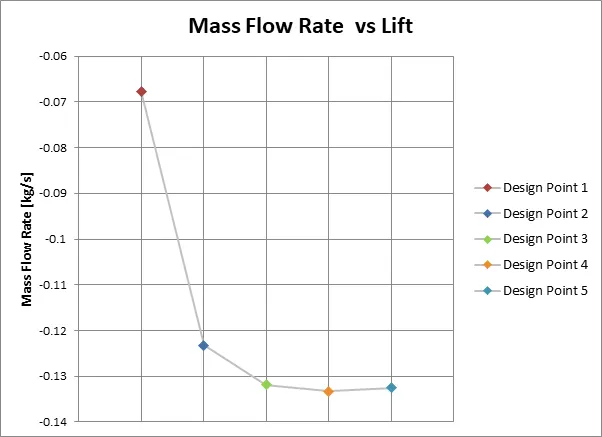
Result from parametric study of different valve lift
|
Goal (Value) |
Design Point 1 |
Design Point 2 |
Design Point 3 |
Design Point 4 |
Design Point 5 |
|
D6@Sketch4@flowbench new.Part [m] |
0.001 |
0.00275 |
0.0045 |
0.00625 |
0.008 |
|
SG Mass Flow Rate 1 [kg/s] |
-0.067678633 |
-0.123183585 |
-0.131904008 |
-0.133255468 |
-0.132495419 |
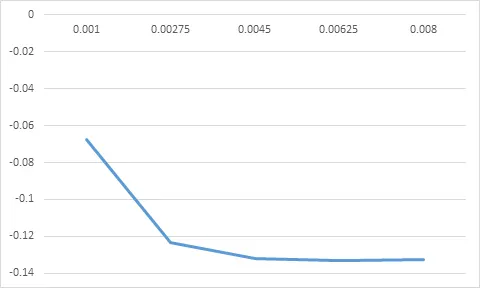
Plot from above data
- Flow Trajectory
At valve lift 1 mm
Conclusion
- Actually mass flow rate increases but as the goals are specified on valve surface only the result are negative.
- From above study we can say that parameters such as pressure, velocity mass flow rate are critical for designing of flow bench.
- As the lift increases, velocity rate increases which improves combustion of the furl and can produce more power.
- Also pressure requirement in inlet port is depend on the diameter of the inlet port.