Flow over a cylinder
Aim: To study the flow over cylinder using solidworks simulation feature for baseline simulation and with varying Reynolds number by a factor of 20%, 40%, 100% of the baseline simulation.
Objective:
- Calculate the Reynolds number for the baseline simulation.
- Run the baseline simulation.
- Run the transient flow simulation for an increasing Reynolds number by a factor of 20%, 40%, and 100% of the baseline Reynolds number.
- Create animation for pressure – velocity for all the three condition of Reynolds number.
Theory:
Prepare the cylinder for simulation of following dimensions
Cylinder diameter = 0.04 m
Cylinder length = 0.05 m
The characteristics of fluid flowing inside the pipe is given below,
Fluid: Air
Dynamic Viscosity: 0.00001825 N.S/m2
Density: 1.225 kg/m3
Assumption:
Surface of cylinder is smooth and roughness is considered zero.
Effect of temperature are not considered in study.
Computational domain in x-direction = 0.5 m
Problem statement:
Simulate the flow over a cylinder for the conditions shown in the video.
Calculate the baseline case Reynolds number.
Re = (ρ ×V ×D)/μWhere,
Re =Reynolds Number
= Density of fluid (kg/m3)
D = Inner Diameter of pipe (mm)
= Dynamic Viscosity (N.S/m2)
Run a baseline simulation and then calculate the Reynolds number. Then increase the Reynolds number by a factor of 20%, 40%, and 100% then run the transient flow simulation.
Simulation end time should be calculated properly. Make sure that end time is set to 2 times flow through time. According to the previous example, the end time would be 10 seconds. Create animations for pressure-velocity for all the three Reynolds number.
- Calculation:
- For baseline simulation
Assume velocity over cylinder is 10 m/s. Therefore
Re = (ρ ×V ×D)/μRe = (1.225 ×10 ×0.04)/0.00001825Re = 26849.3
Similarly,Reynolds number increasing at 20, 40 and 100% is calculated,
At 20% Re = 32219.1
At 40% Re = 37589.02
At 100% Re = 53698.6
- For Re = 120% of 26849.3 =32219.1
Velocity = 12 m/s
Flow through time = (Domain length )/(velocity )Flow through time =
Flow through time = 0.04166 sec
Simulation end time = 2 × flow through time
Simulation end time = 0.0833 sec
- For Re = 140% of 26849.3 =37589.02
Velocity =14 m/s
Flow through time = 0.0357 sec
Simulation end time = 2 × flow through time
Simulation end time = 0.0714 sec
- For Re = 200% of 26849.3 =53698.6
Velocity = 20 m/s
Flow through time = 0.025 sec
Simulation end time = 2 × flow through time
Simulation end time = 0.05 sec
Procedure:
Cylinder of above mentioned dimensions is created.
Set the external flow analysis in the wizard.
Calculated end time is taken as total analysis time.
Fluid as air is taken into consideration.
Velocity in the X –direction is taken as calculated velocity from Reynolds number.
Set the computational domain in X-direction as 0.5 m.
Run the project and finally get the cut plots of relative pressure and velocity.
- Result:
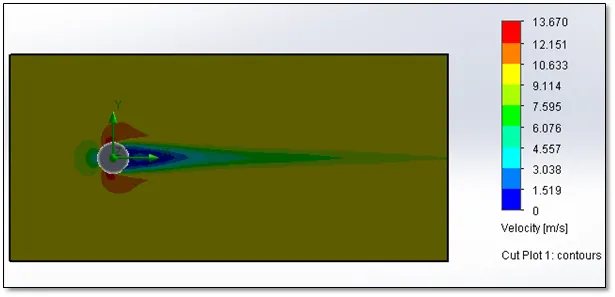
- Baseline simulation
Velocity distribution over cylinder
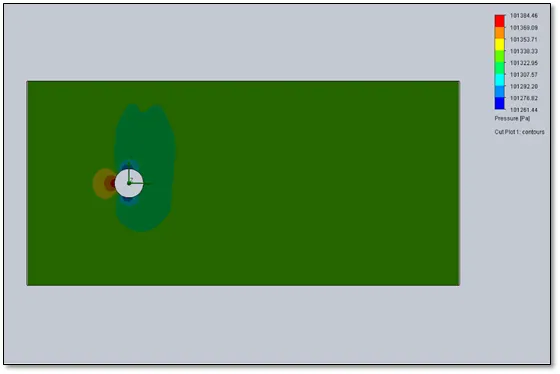
Pressure distribution over cylinder
Animation for velocity distribution over cylinder
Animation for pressure distribution over cylinder
- For Re = 120% of 26849.3 =32219.1
Velocity distribution over cylinder
Pressure distribution over cylinder
Animation for velocity distribution over cylinder
Animation for pressure distribution over cylinder
- For Re = 140% of 26849.3 =37589.02
Velocity distribution over cylinder
Pressure distribution over cylinder
Animation for velocity distribution over cylinder
Animation for pressure distribution over cylinder
- For Re = 200% of 26849.3 =53698.6
Velocity distribution over cylinder
Pressure distribution over cylinder
Animation for velocity distribution over cylinder
Animation for pressure distribution over cylinder
Conclusion
- Inlet velocity in x direction increases with the increase in Reynolds number, thus increasing the flow of air over the cylinder.
- The relative pressure variation does not vary to a large extend for the Reynolds number.
- It is observed that the high pressure is created on the surface facing the inlet velocity.
- The velocity variation in the above animations has different velocity profile, velocity is maximum at surface of the cylinder contact with inlet velocity and it is approximately zero nearer to the surface which is not in contact with inlet velocity.