Modelling and Analysis of a heat sink using Ansys ICEPAK
Project description :
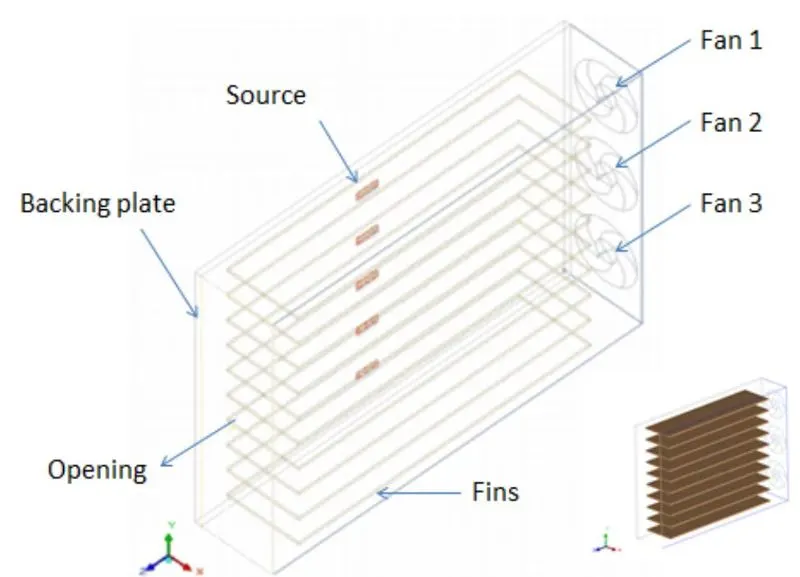
The cabinet contains an array of five high-power devices, a backing plate, ten fins, three fans, and a free opening, as shown in Figure. The fins and backing plate are constructed of extruded aluminum. Each fan has a total volume flow rate of 18 cfm and each source dissipates power at the rate of 33 W. According to the design objective, the base of the devices should not exceed 65°C when air sweeps the fins at an ambient temperature of 20°C.
Geometry Details:
Cabinet Size: 75 mm X 250 mm X 356 mm
Backing plate: 6 mm thick
Opening: Cabinet is open on Z max
Fan-1: center is at Z min (40mm, 47.5 mm, 0mm) having an external radius of 30 mm and an internal radius of 10 mm. the fan has fixed volumetric flow 18 CFM
Fan-2: 77.5 mm from Fan1
Fan-3: 77.5 mm from Fan 2
Source: Source 1 is located on the Backing plate at (0mm, 31.5 mm, 180.5 mm) having power dissipation 33W. there is total of 5 sources at 45mm distant apart.
Fins: total 10 fins of thickness 2.5 mm having width 69 mm in X dir and length 281 mm in Z dir and all fins are 25 mm apart (Fins are aluminum extruded)
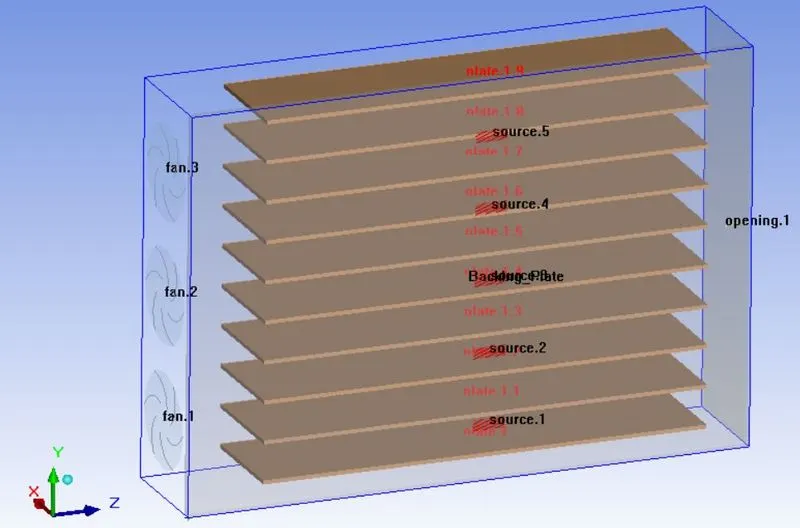
Fig-1: Geometry Model using Ansys ICEPAK
Physics Setup
Solution-1: Coarse Mesh
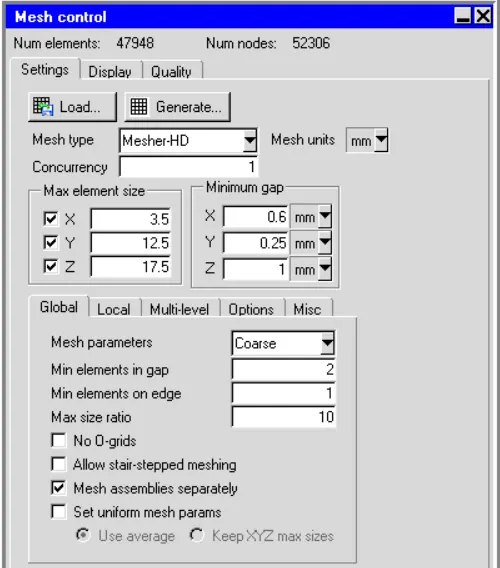
Fig-2: Mesh option used for coarse meshing
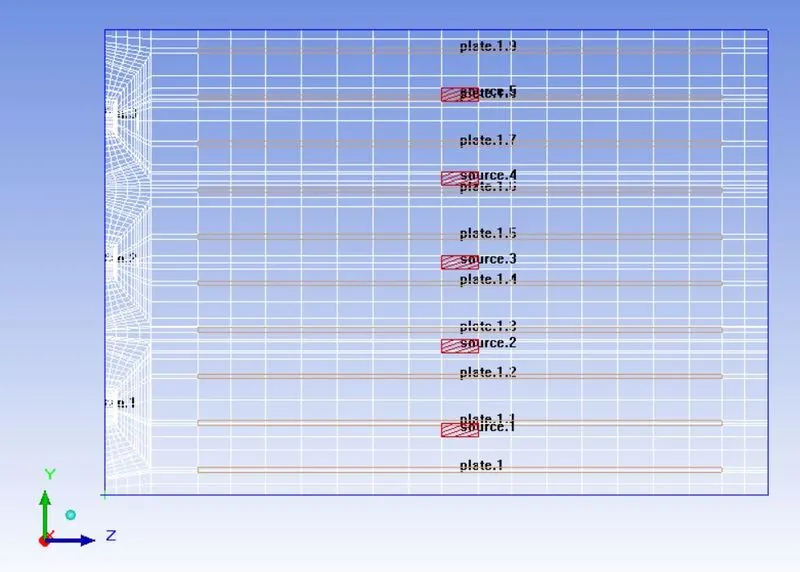
Fig-3: Mesh distribution at 50% cut plane (X-plane along the section)
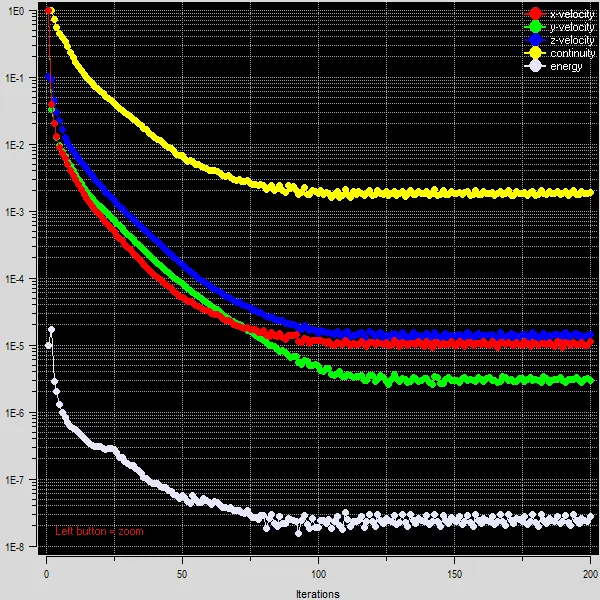
Convergence Plot
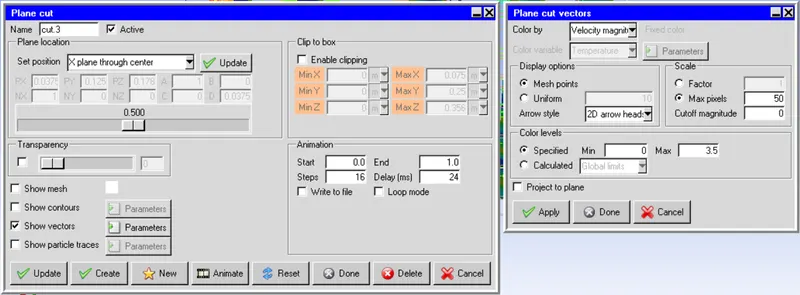
Fig-4: Cut-section information
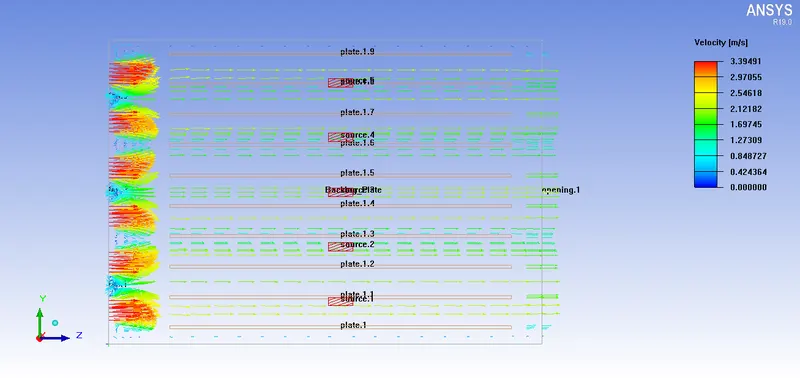
Fig-5:Velocity Vector plot at 50% cut plane (X-plane along the section)
In plane cut vector window (Fig-4)observe that for display option mesh points has been used. Since Mesh is coarse, flow distribution and recirculation region has not been captured appropriately between the plates)
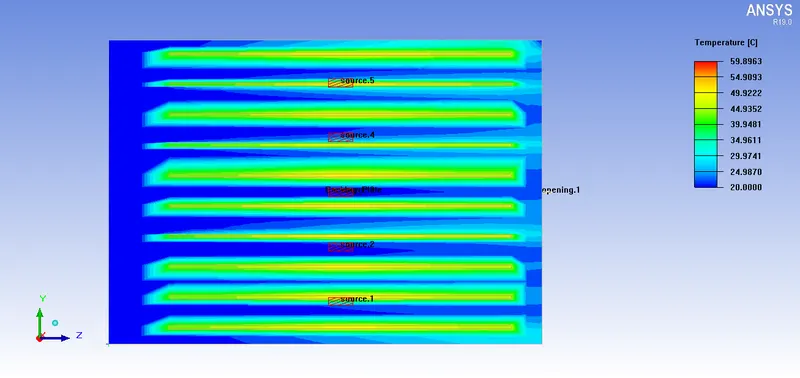
Fig-5: Temperature Contour plot at 50% cut plane (X-plane along the section)
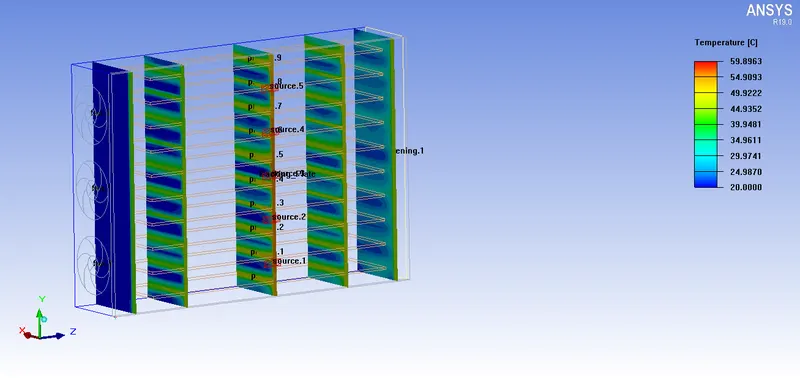
Fig-6: Temperature Contour plot at different sections along Z-plane
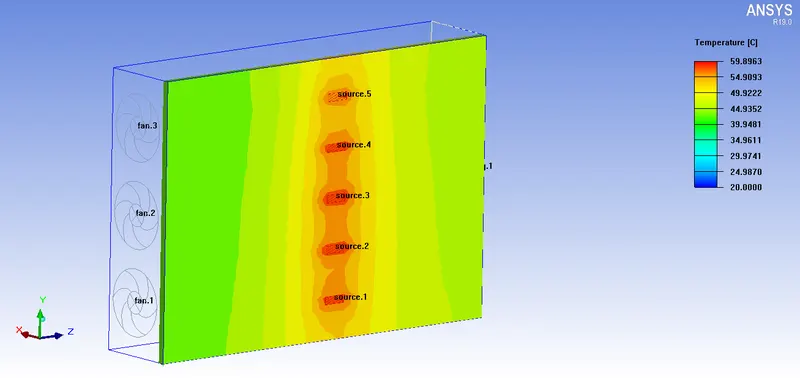
Fig-7: Temperature Contour plot on the surface of Backing Plate
Temparature values at different sections and on backing plate is less than 65 degree Centigrade as per problem defination.
(Heat transfer mode by radiation is not been considered in this problem setup)
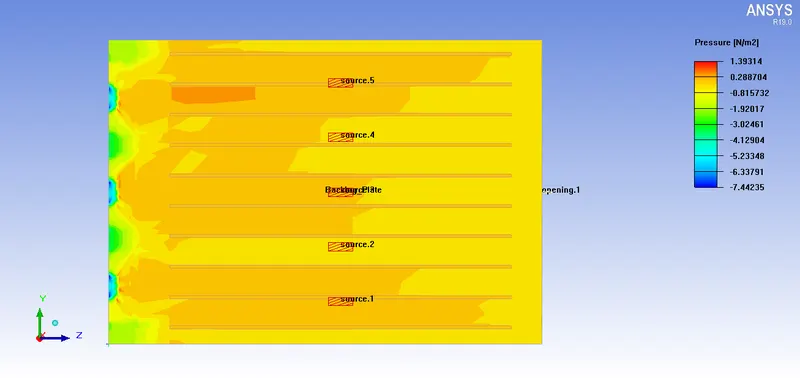
Fig-8: Pressure distribution at 50% cut plane (X-plane along the section).
Solution-2: Fine Mesh
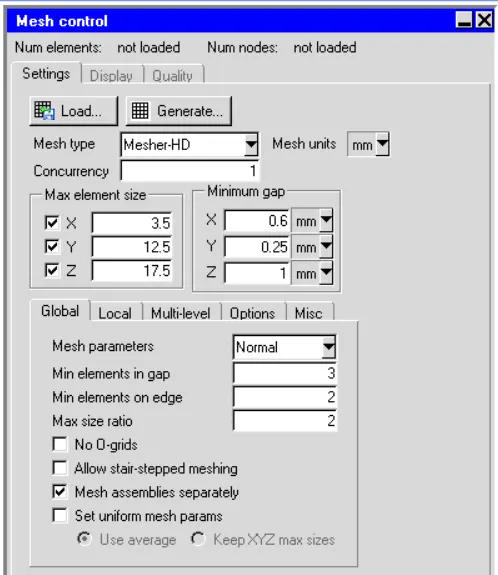
Fig-9: Mesh option used for Fine mesh (Changed mesh paramenter from "Coarse" to "Normal")
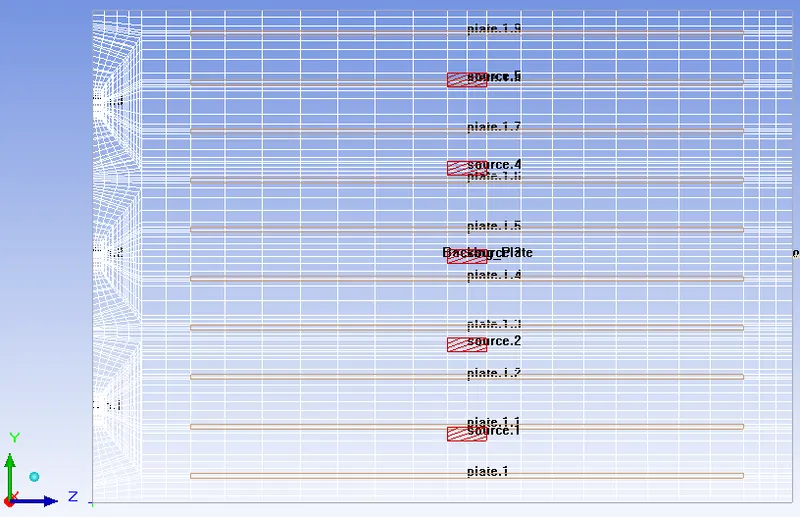
Fig-10: Mesh distribution at 50% cut plane (X-plane along the section)
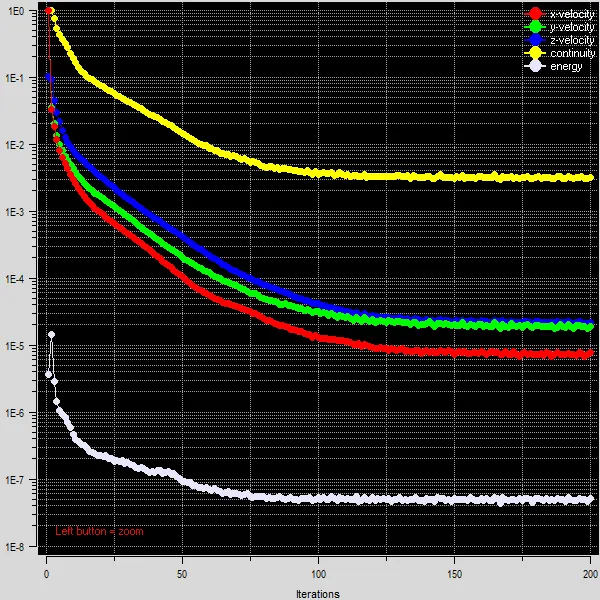
Convergence Plot
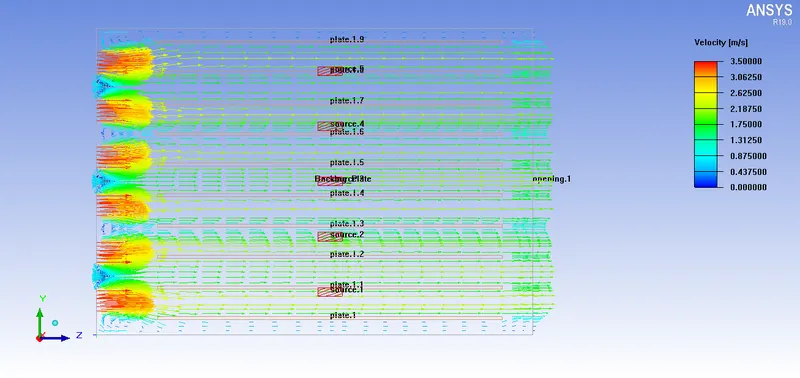
Fig-11:Velocity Vector plot at 50% cut plane (X-plane along the section)
In plane cut vector window (Fig-4)observe that for display option mesh points has been used. Need to increase number of cells to have a better view of flow distribution. (Flow distribution between plates can be improved with increased number of cell counts)
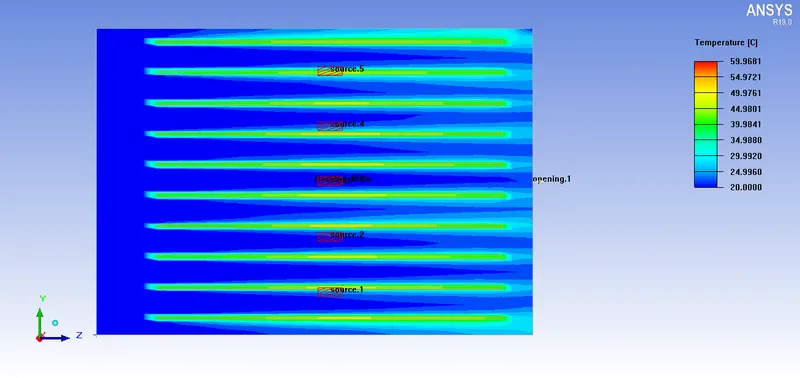
Fig-12: Temperature Contour plot at 50% cut plane (X-plane along the section)
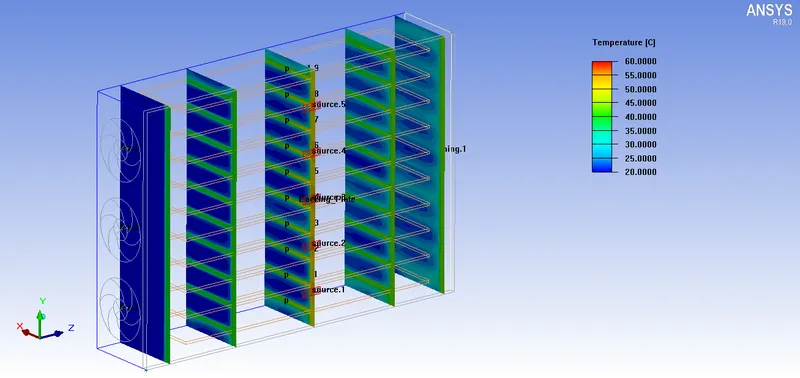
Fig-13: Temperature Contour plot at different sections along Z-plane
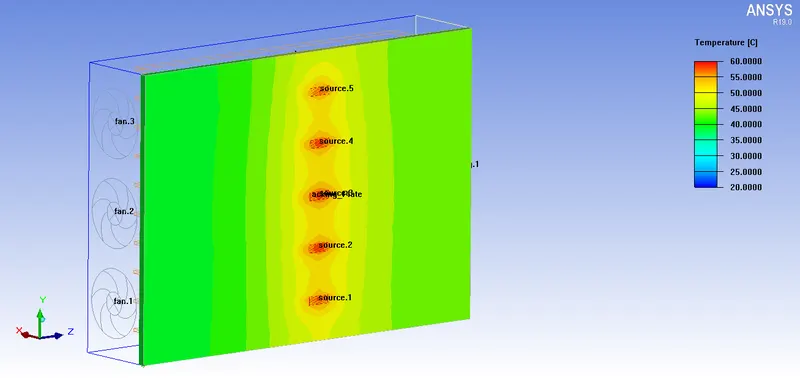
Fig-14: Temperature Contour plot on the surface of Backing Plate
Temparature values at different sections (refer Fig-12 & Fig-13) and on backing plate (Fig-14) is less than 65 degree Centigrade as per problem defination.
(Heat transfer mode by radiation is not been considered in this problem setup)
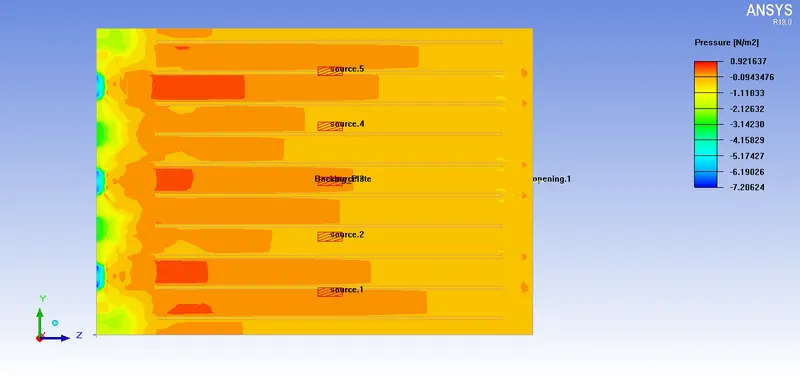
Fig-15: Pressure distribution at 50% cut plane (X-plane along the section)
Solution-3: Fine Mesh (reduced maximum cell size in Y and Z direction)
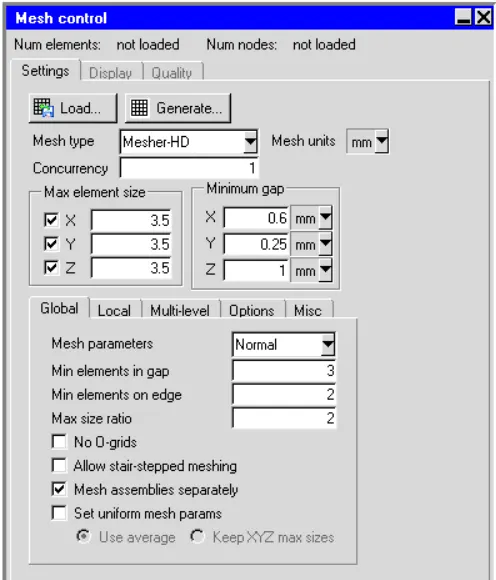
Fig-16: Mesh option used for Fine mesh (reduced maximum cell size in Y and Z direction)
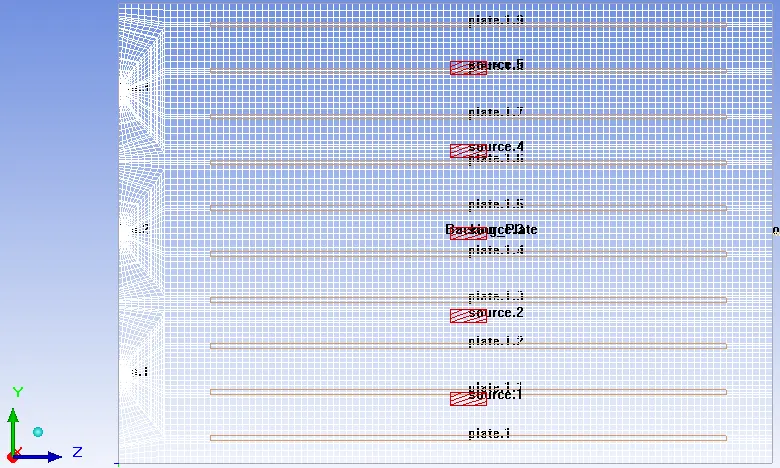
Fig-17: Mesh distribution at 50% cut plane (X-plane along the section)
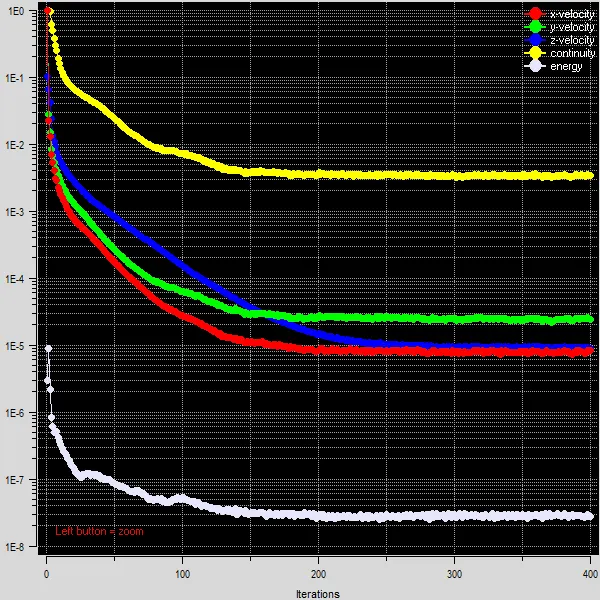
Convergence Plot
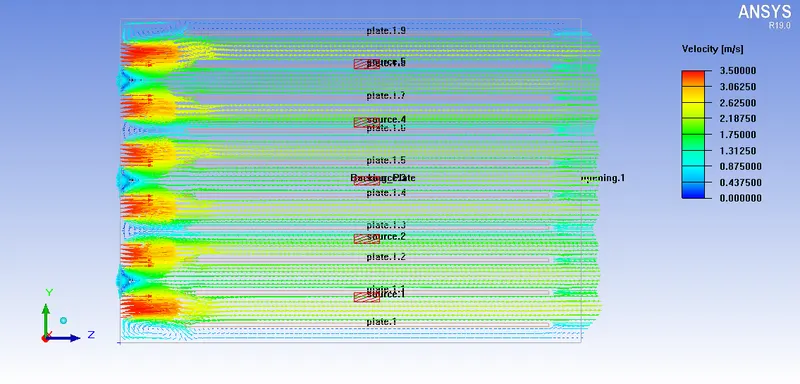
Fig-18: Mesh distribution at 50% cut plane (X-plane along the section)
In plane cut vector window (Fig-4)observe that for display option mesh points has been used.
Flow distribution between plates can has been improved with increased number of cell counts.
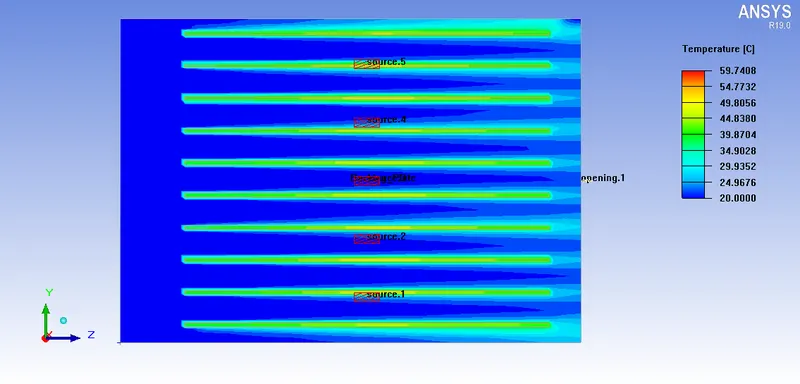
Fig-19: Temperature Contour plot at 50% cut plane (X-plane along the section)
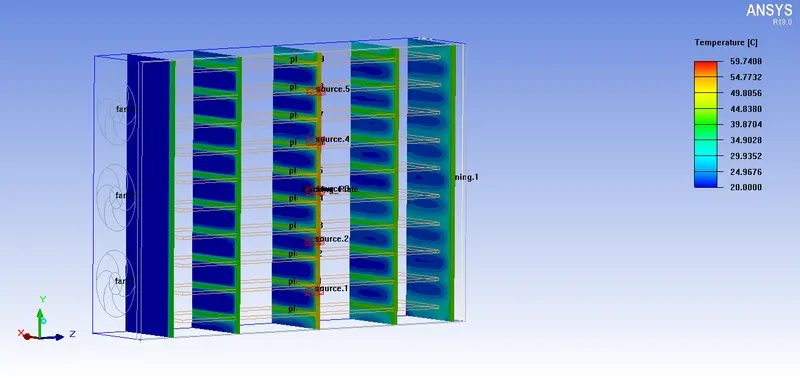
Fig-20: Temperature Contour plot at different sections along Z-plane
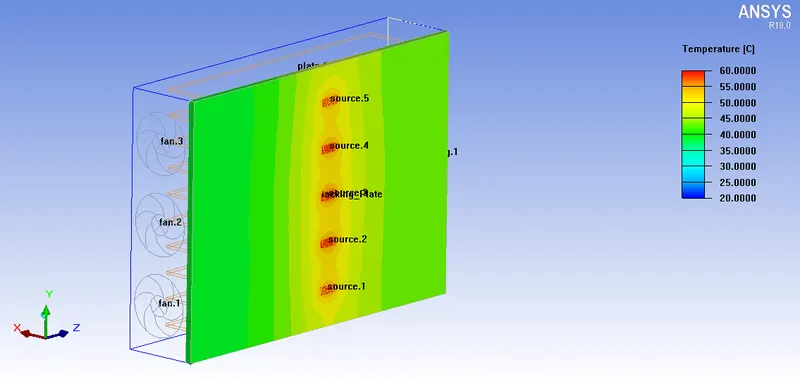
Fig-21: Temperature Contour plot on the surface of Backing Plate
Temparature values at different sections (refer Fig-19 & Fig-20) and on backing plate (Fig-21) is less than 65 degree Centigrade as per problem defination.
(Heat transfer mode by radiation is not been considered in this problem setup)
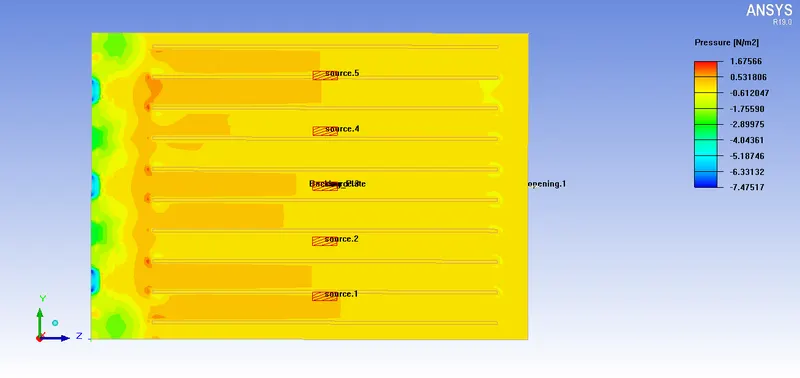
Fig-22: Pressure distribution at 50% cut plane (X-plane along the section)
Conclusion : Coarse mesh results for Temperature distribution is appreciable in comparision with fine mesh.
However inorder to have better flow visualisation more number of cells is required.