Matlab program to calculate drag force against a cyclist
AIM: Matlab program to calculate drag force against a cyclist.
The factors involved are Velocity,Drag coefficient,Frontal Area,Density of air.
THEORY
A drag force is the resistance force caused by the the motion of body through a fluid such as water or air. A drag force always acts opposite of the relatives motion of the body with respect to surrounfing velocity of the fluid. this can exist betwwen two fluid fluid layer or between a fluid layer and solid surface. Drag force is expressed as
F_d= (1/2)xC_dxAx rho x v^2
where C_d = drag coefficient
A = Frontal Area
rho = density
v = velocity of the object
Drag Coefficient is a dimensionless quantity that is used to quantify the drag or resistance of an object in a fluid environment, such as air or water. Lower drag coefficient indicates the object will have less aerodynamic or hydrodynamic drag.
Typically, the drag coefficient of a cyclist ranges from approx 0.6 for a streamlined position to >0.8 for an upright position.
Assumption while writing the command
1. Frontal area doesn't change for different values of drag coefficient for different position of the cyclist.
2. Drag coefiicient is constant for different values of velocity.
%  calculate drag force against a cyclist
clear all
close all
clc

%inputs
% Drag Coefficient
c_d1 = 0.8
c_d2 = linspace(0,1,8)

% Frontal Area (m^2)
A = 0.1
% Density (m^3/s)
rho = 1.2
 %Velocity (m/s)
 v = [0:20]
 V = 15

 %Drag Force (N)
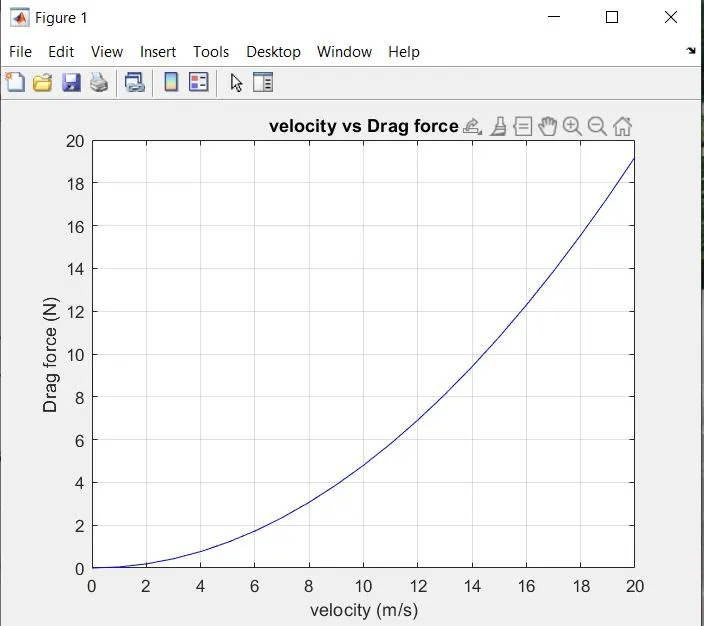
 F_d1 = 0.5*rho*c_d1*A*v.^2
 figure(1)
 plot(v,F_d1,'color','blue')
 grid on
 title('velocity vs Drag force')
 xlabel('velocity (m/s)')
 ylabel('Drag force (N)')

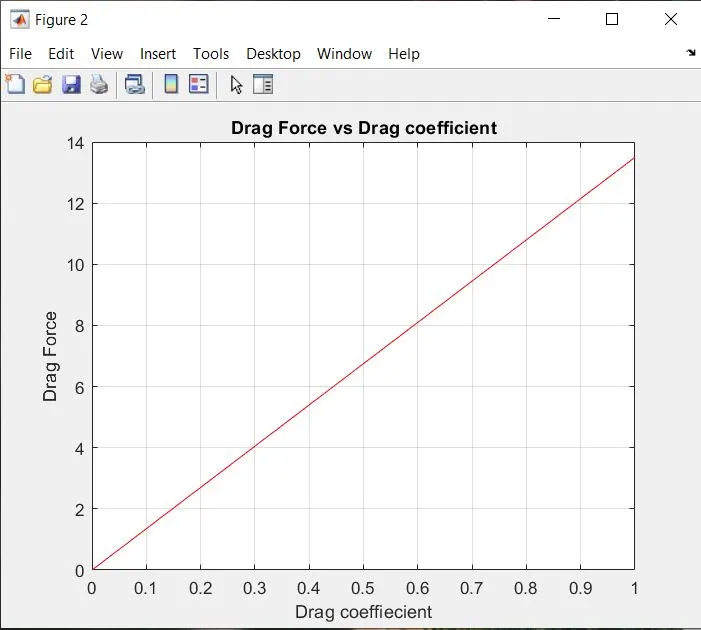
 F_d2= 0.5*rho*c_d2*A*V.^2
 figure(2)
 plot(c_d2,F_d2,'color','r')
 grid on
 xlabel('Drag coeffiecient')
 ylabel('Drag Force')
 title('Drag Force vs Drag coefficient')
c_d1 =
0.8000
c_d2 =
0 0.1429 0.2857 0.4286 0.5714 0.7143 0.8571 1.0000
A =
0.1000
rho =
1.2000
v =
Columns 1 through 17
0 1 2 3 4 5 6 7 8 9 10 11 12 13 14 15 16
Columns 18 through 21
17 18 19 20
V =
15
F_d1 =
Columns 1 through 10
0 0.0480 0.1920 0.4320 0.7680 1.2000 1.7280 2.3520 3.0720 3.8880
Columns 11 through 20
4.8000 5.8080 6.9120 8.1120 9.4080 10.8000 12.2880 13.8720 15.5520 17.3280
Column 21
19.2000
F_d2 =
0 1.9286 3.8571 5.7857 7.7143 9.6429 11.5714 13.5000Plot of Velocity vs Drag force
Plot of Drag Co-efficient vs Drag force.
Result:
From the governing equation and plot, it is concluded that drag force varies parabolically with the change in velocity and linearly with change in drag coefficient keeping frontal area constant.