Independent Research Project
Static Bending Test on CCTV Camera Mount Stand
OBJECTIVES:
To carry out a Static Structural Analysis of Bending on CCTV Camera Mount Stand for two different Design Models using six different materials 3(Non-Metals) and 3(metals) for two load cases. Then Grid Dependency Test has been performed on both design models and compared with the Analytical Results for the Equivalent stress, deformation, and Equivalent Elastic strain.
MODELS:
There are two design models used for this analysis. First, the Camera Stand was made up of an inverted U – Section, since the CCTV Mount Stand acts like a Cantilever Beam with a load at its end. Second, the Camera Stand was made up of an I – Section. The Length of the Beam in both cases was 255mm with a plate of dimension 75mmx65mm.
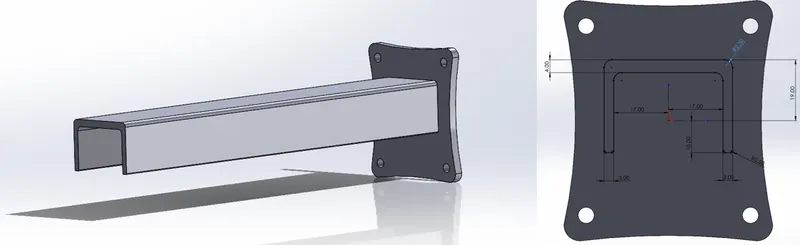
Fig.1 Inverted U Section Model
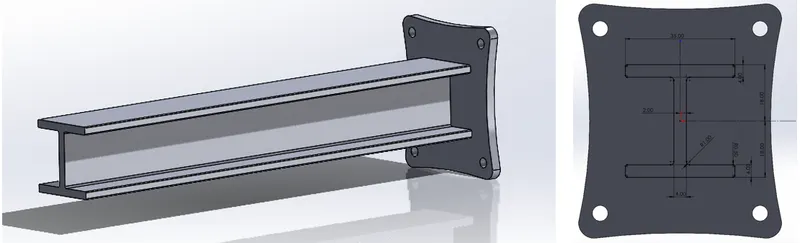
Fig.2 I Section Model
MATERIALS:
For the analysis, six different materials were used. Out of six, three are Non-Metals and the other three are Metals.
The Non-Metals include:
- Plastic ABS (High Impact)
- Plastic PS (High Impact)
- Composite Epoxy/Glass fiber
The Metals include:
- Stainless Steel, 316
- Aluminum Alloy, 6061, T6
- Cast Iron
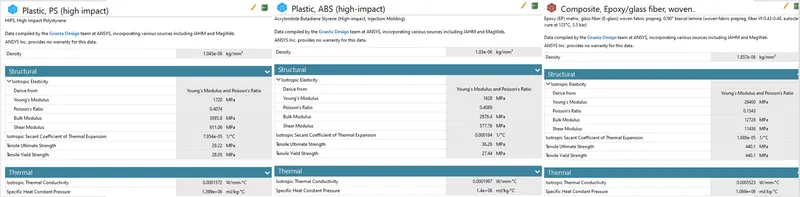
Fig.3 Non-Metals Property Data
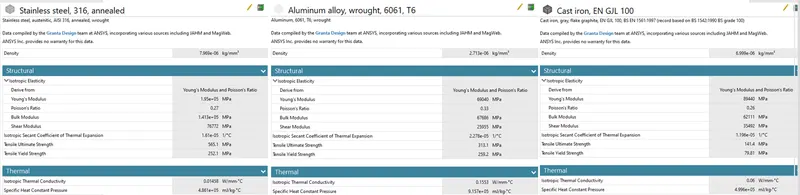
Fig.4 Metals Property Data
LOAD CASES:
The Analysis was carried out with two different load cases, One, 5N, and the other 15N load were applied to the end of the beam. So, a total of 24 tests were performed on the Beam CCTV Mount Stand.
CASE SETUP:
Design Models:
Two Design models were used as specified above.
- Design-1: Inverted U-Section
- Design-2: I-Section
Meshing:
First, the default mesh/element size was used for this analysis with Plastic ABS materials for both design models, and then the analysis was carried out using ANSYS Mechanical Enterprise. Adaptive Sizing OFF and Smoothing LOW.
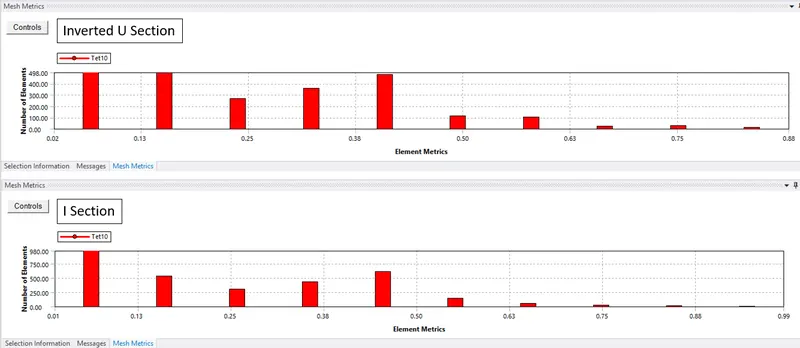
Fig.5 Element Quality
A mesh metric that identifies elements according to their quality was employed and it can be seen that the elements of the lowest quality are minimal. Most of the elements have very high quality in the range of 0.01 to 0.05. Hence, the mesh is of acceptable quality. The meshed model is shown below.
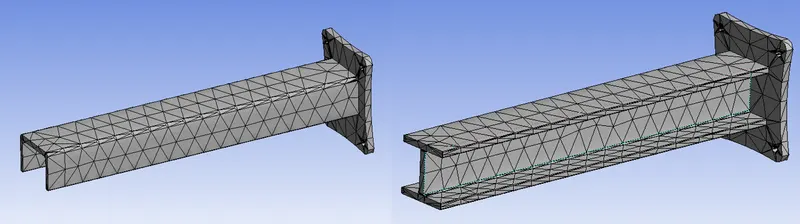
Fig.6 Meshed Model – Default element size
ANALYSIS SETTING (All Cases):
- of Steps: 1
- Auto Time Stepping: Program Controlled
- Solver Type: Program Controlled
- Large Deflection: ON
- Weak Spring: OFF
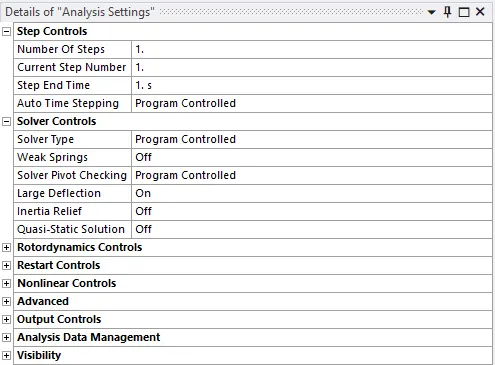
Fig.7 Analysis Setting (all cases)
BOUNDARY CONDITIONS AND LOAD (5N, 15N):
- Fixed Support: Back Side of the Plate
- Force: To the free end edge of the beam
- Y Component: -5N/-15N
- Y and Z Component: 0N
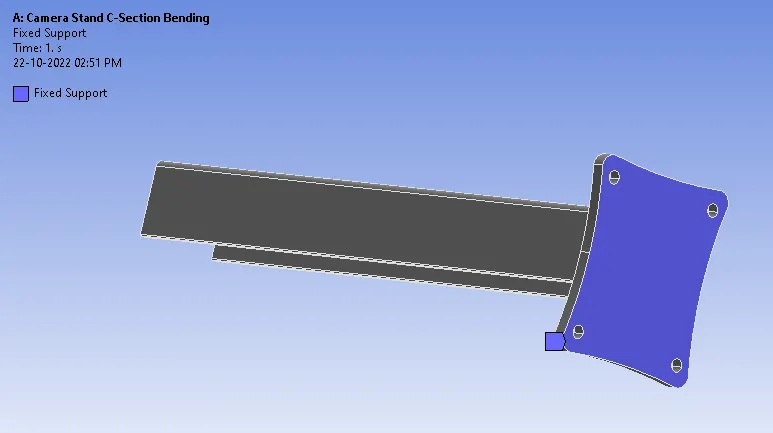
Fig.8 Fixed Support
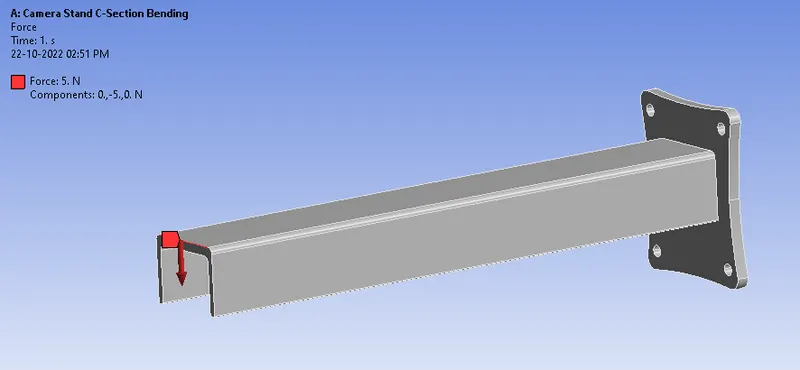
Fig.9 Load Applied -5N
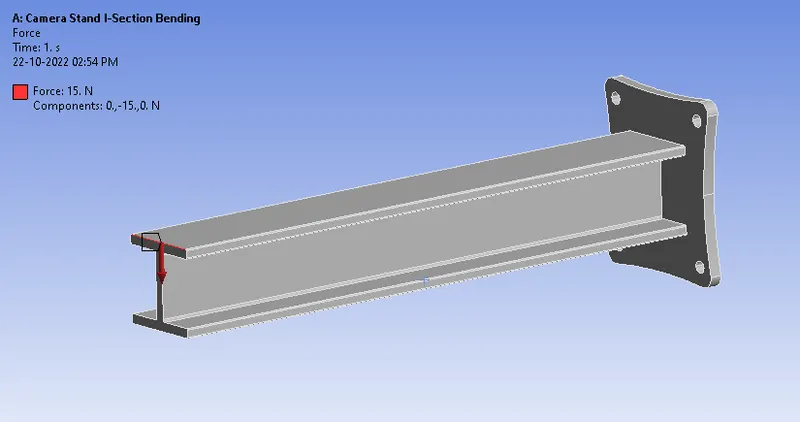
Fig.10 Load Applied -15N
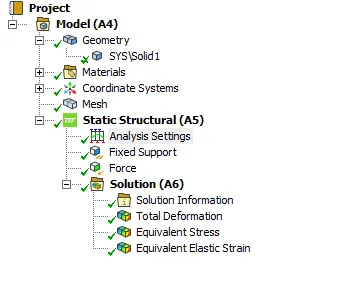
Fig.11 Case Setup.
GRID DEPENDENCY TEST:
Both design models were taken and carried out a Grid Dependency Test with default and other various element sizes for an applied load of 5N. Their results were compared against the Analytical calculation using the Cantilever Beam formulas. The approximate results of the comparison with their corresponding mesh size were used for the analysis using different load forces and materials. The Element sizes used for the GDT are 13.682(default), 10, 8, 6, 5, 4, 3, and 2mm
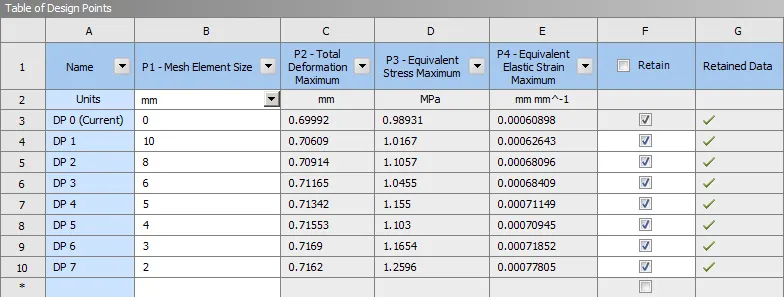
Fig.12 GDT Results – U Section
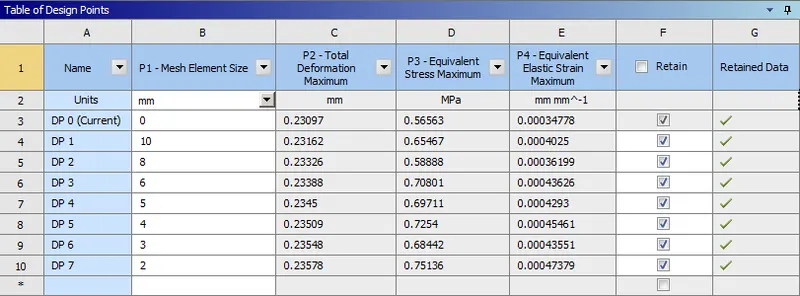
Fig.13 GDT Results – I Section
ANALYTICAL CALCULATION:
The Deformation, Bending Moment and Stresses were calculated using the analytical formulas available for the Cantilever Beam end loads. The formulas and data used for the calculation to arrive at the final results are given below.
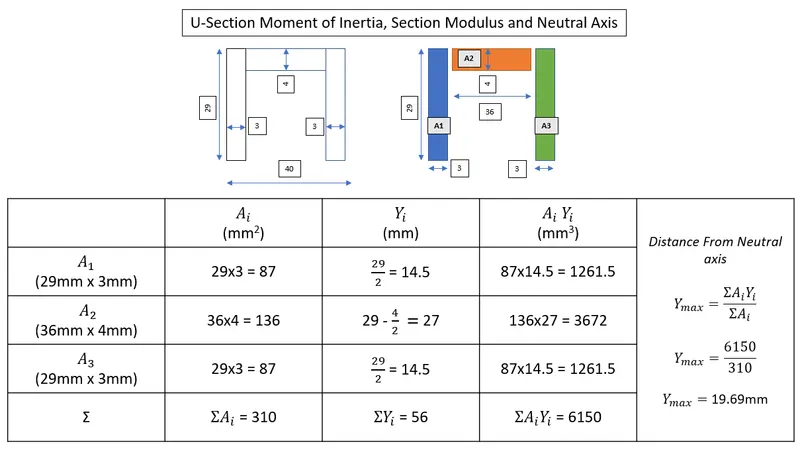
Fig.14 Inverted U Section Neutral Axis Data Calculation
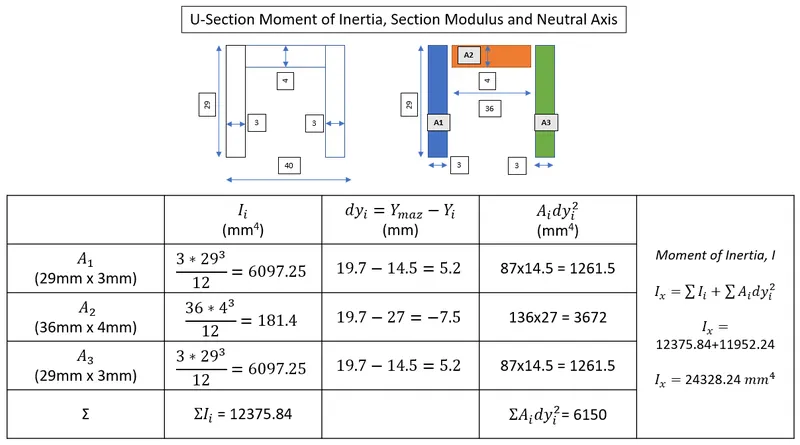
Fig.15 Inverted U Section Moment of Inertia and Section Modulus
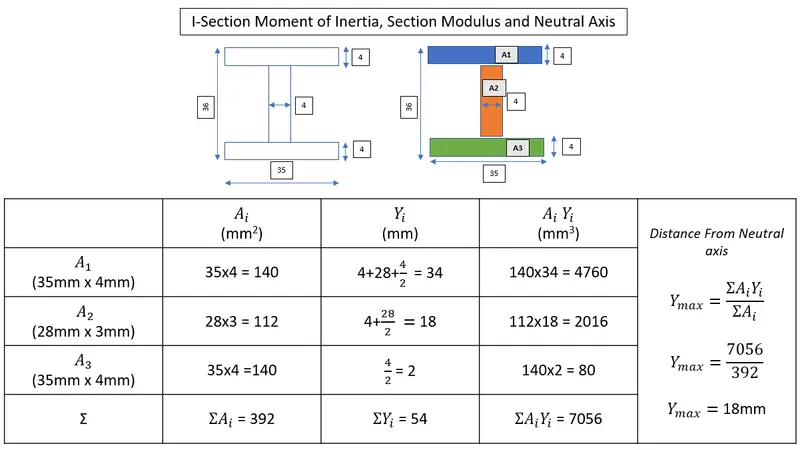
Fig.16 Inverted I Section Neutral Axis Data Calculation
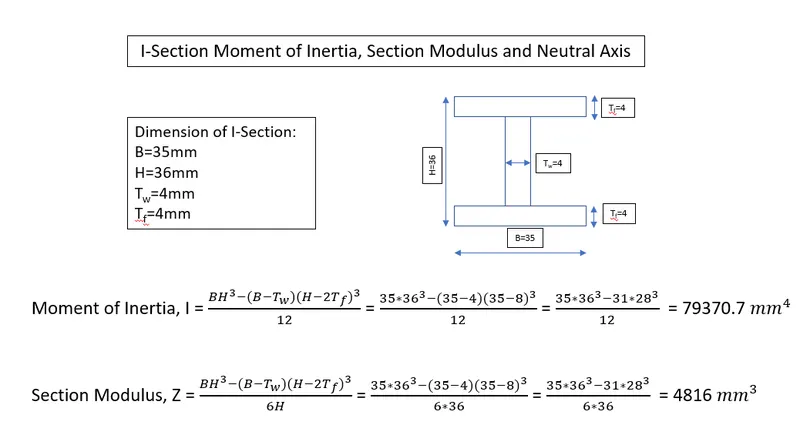
Fig.17 Inverted I Section Moment of Inertia and Section Modulus
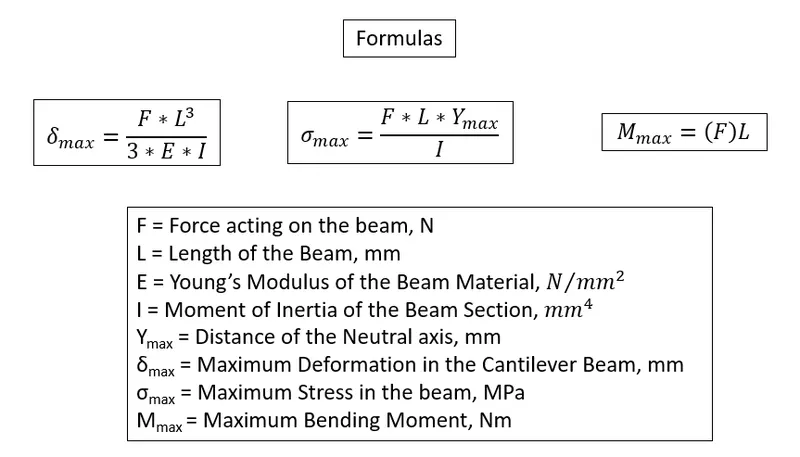
Fig.18 Maximum Deformation, Max. Bending Moment, and Max. Stress Formula
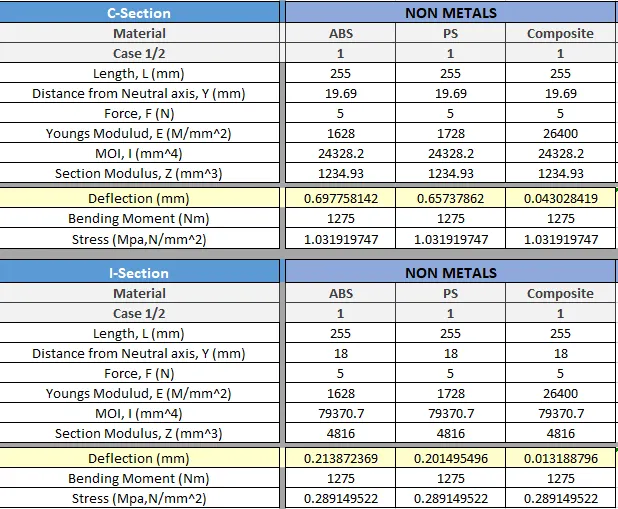
Fig.19 Analytical Calculation Results
|
C-Section |
NON-METALS |
||
|
Material |
ABS |
PS |
Composite |
|
Length, L (mm) |
255 |
255 |
255 |
|
Distance from Neutral axis, Y (mm) |
19.69 |
19.69 |
19.69 |
|
Force, F (N) |
5 |
5 |
5 |
|
Youngs Modulus, E (M/mm^2) |
1628 |
1728 |
26400 |
|
MOI, I (mm^4) |
24328.2 |
24328.2 |
24328.2 |
|
Section Modulus, Z (mm^3) |
1234.93 |
1234.93 |
1234.93 |
|
Deflection (mm) |
0.697758142 |
0.65737862 |
0.043028419 |
|
Bending Moment (Nm) |
1275 |
1275 |
1275 |
|
Stress (MPa, N/mm^2) |
1.031919747 |
1.031919747 |
1.031919747 |
|
I-Section |
NON-METALS |
||
|
Material |
ABS |
PS |
Composite |
|
Length, L (mm) |
255 |
255 |
255 |
|
Distance from Neutral axis, Y (mm) |
18 |
18 |
18 |
|
Force, F (N) |
5 |
5 |
5 |
|
Youngs Modulus, E (M/mm^2) |
1628 |
1728 |
26400 |
|
MOI, I (mm^4) |
79370.7 |
79370.7 |
79370.7 |
|
Section Modulus, Z (mm^3) |
4816 |
4816 |
4816 |
|
Deflection (mm) |
0.213872369 |
0.201495496 |
0.013188796 |
|
Bending Moment (Nm) |
1275 |
1275 |
1275 |
|
Stress (MPa, N/mm^2) |
0.289149522 |
0.289149522 |
0.289149522 |
COMPARISON GDT Vs ANALYTICAL CALCULATION:
On comparing the Grid Dependency Test and Analytical Calculation results, it was observed that the Default mesh size (13.682mm) is close approximate to the Analytical Solution. So, the Default Mesh Size was chosen and used for meshing in the rest of the analysis. The below table provides the Analytical data with Default Mesh Simulation results.
|
Section |
Material |
Plastic ABS |
Plastic PS |
Composite Epoxy/Glass |
|||
|
Output |
Analytical |
Simulation |
Analytical |
Simulation |
Analytical |
Simulation |
|
|
Inverted U |
Deformation (mm) |
0.697 |
0.699 |
0.657 |
0.662 |
0.043 |
0.043 |
|
Stress (MPa) |
1.03 |
0.989 |
1.03 |
0.9892 |
1.03 |
0.990 |
|
|
I Section |
Deformation (mm) |
0.213 |
0.23 |
0.201 |
0.21 |
0.013 |
0.0143 |
|
Stress (MPa) |
0.289 |
0.56 |
0.289 |
0.566 |
0.289 |
0.724 |
|
SIMULATION RESULTS:
The simulation was run successfully with the default mesh size for all six materials and two different load cases. The simulation results are provided below.
NON-METALS Load of 5N:
Inverted U Section: The Total Deformation, Stress, and Strain obtained from the simulation are provided below.
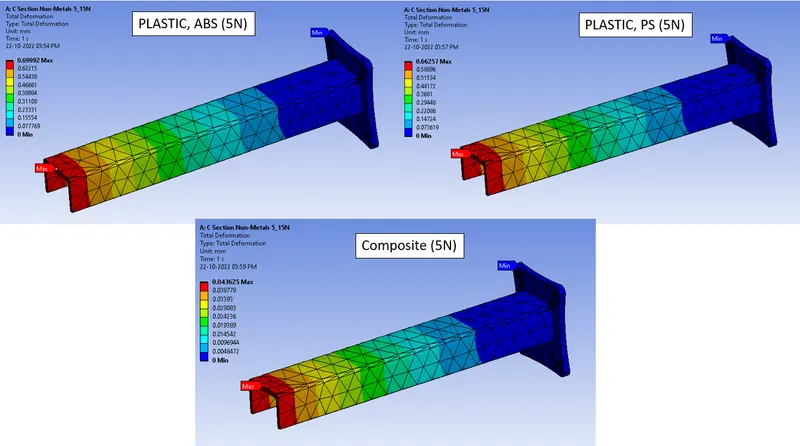
Fig.20 Total Deformation Counter Plot
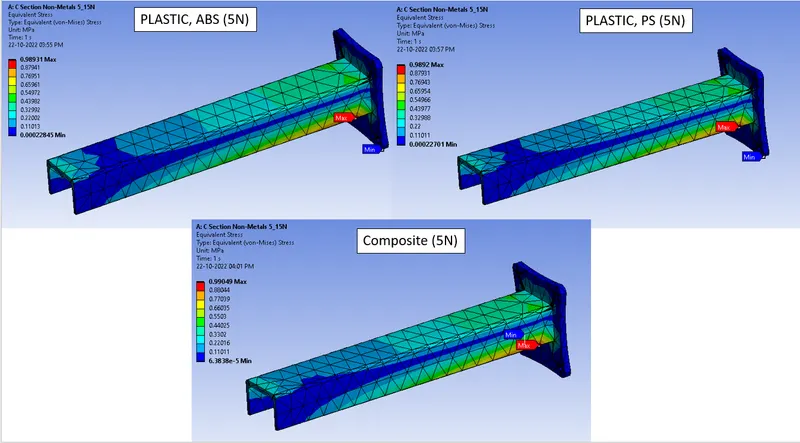
Fig.21 Equivalent Stress Counter Plot
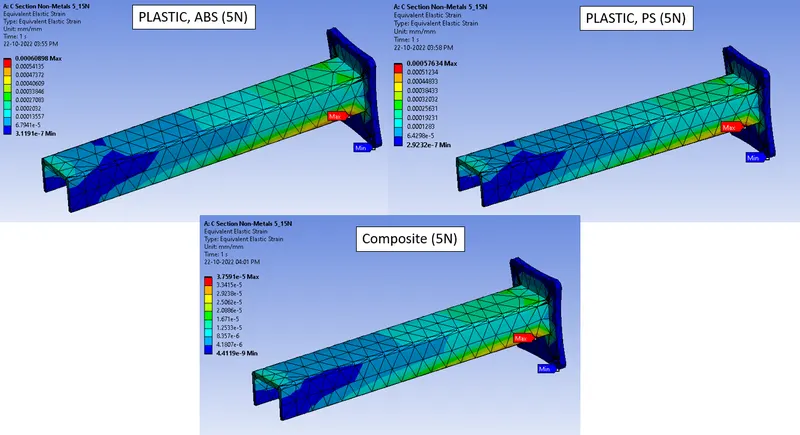
Fig.22 Equivalent Strain Counter Plot
I Section: The Total Deformation, Stress, and Strain obtained from the simulation are provided below.
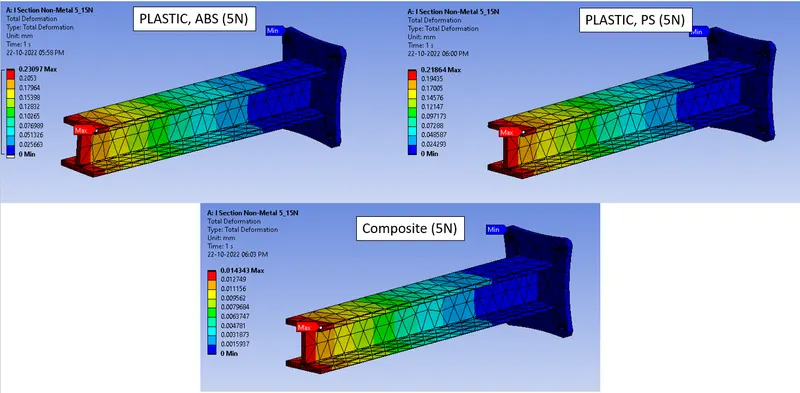
Fig.23 Total Deformation Counter Plot
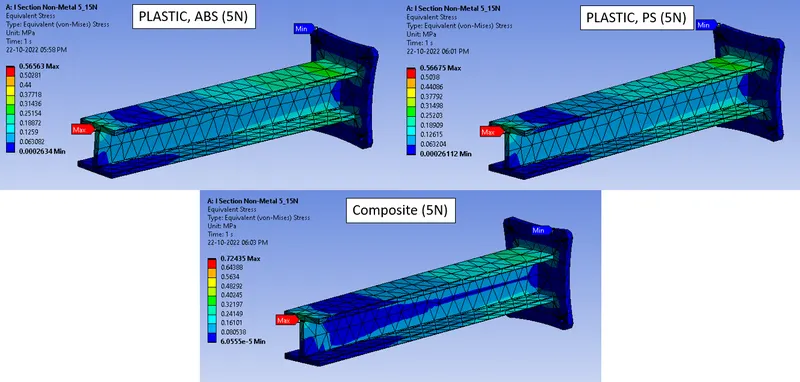
Fig.24 Equivalent Stress Counter Plot
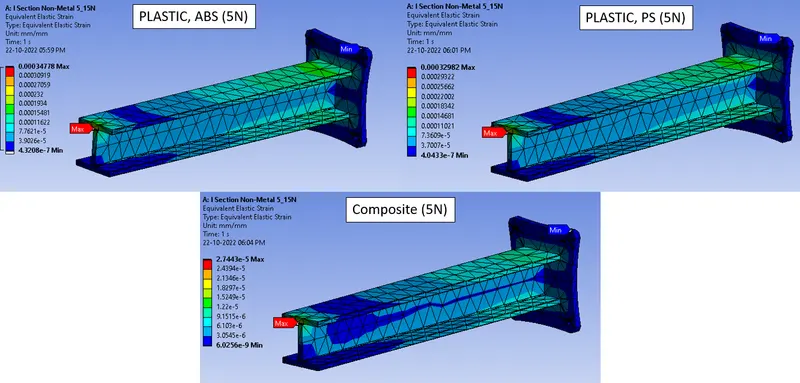
Fig.25 Equivalent Strain Counter Plot
NON-METALS Load of 15N:
Inverted U Section: The Total Deformation, Stress, and Strain obtained from the simulation are provided below.
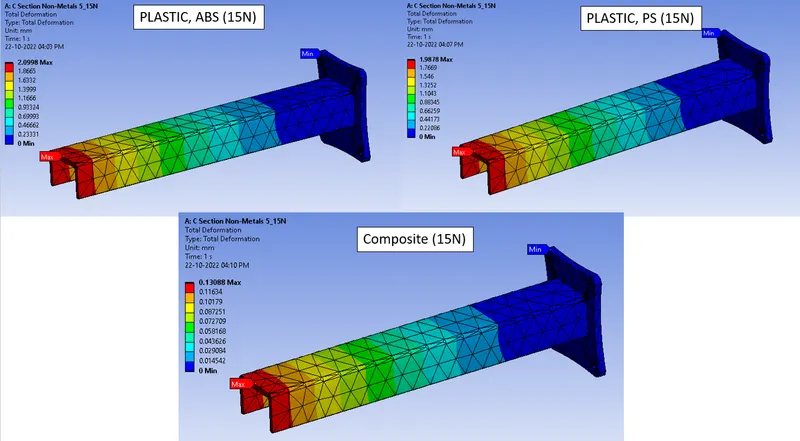
Fig.26 Total Deformation Counter Plot
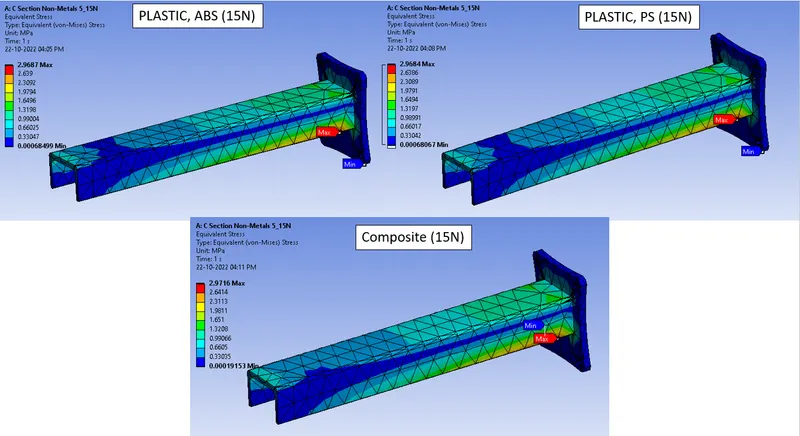
Fig.27 Equivalent Stress Counter Plot
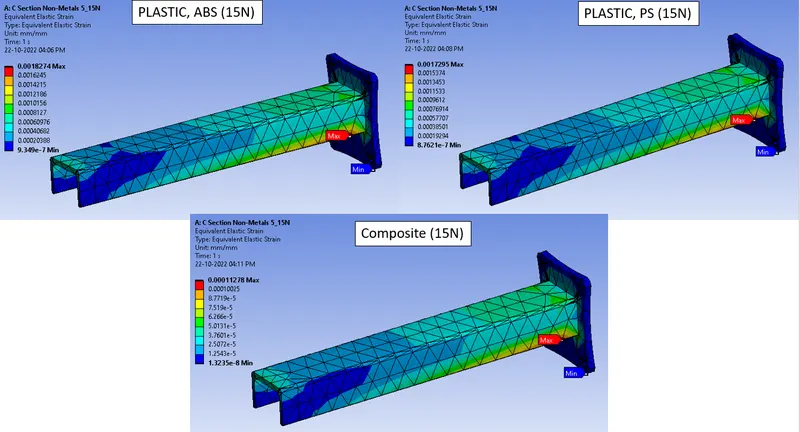
Fig.28 Equivalent Strain Counter Plot
I Section: The Total Deformation, Stress, and Strain obtained from the simulation are provided below.
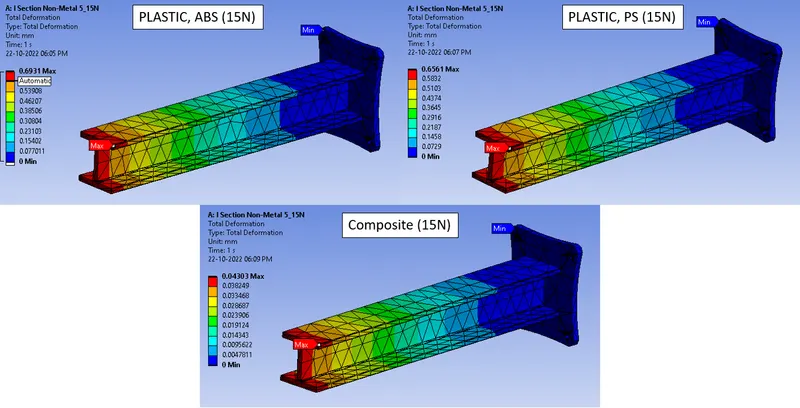
Fig.29 Total Deformation Counter Plot
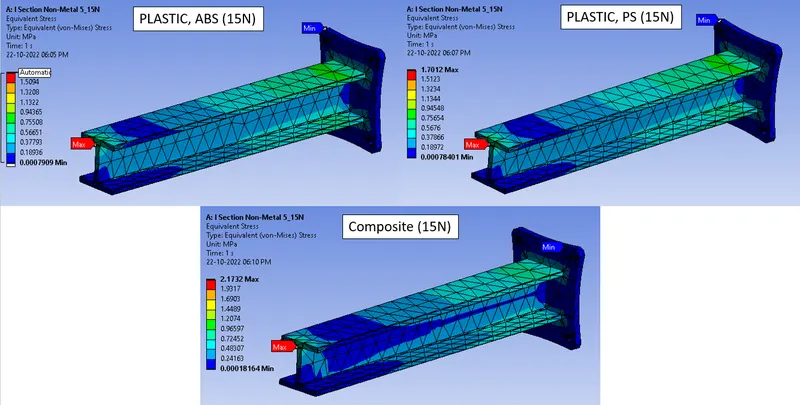
Fig.30 Equivalent Stress Counter Plot
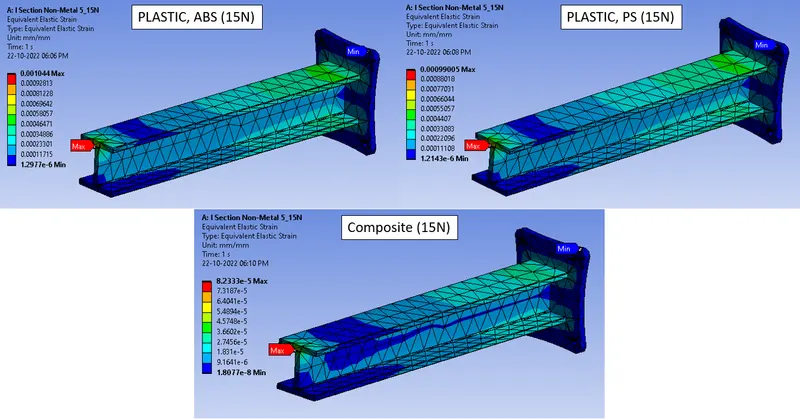
Fig.31 Equivalent Strain Counter Plot
METALS Load of 5N:
Inverted U Section: The Total Deformation, Stress, and Strain obtained from the simulation are provided below.
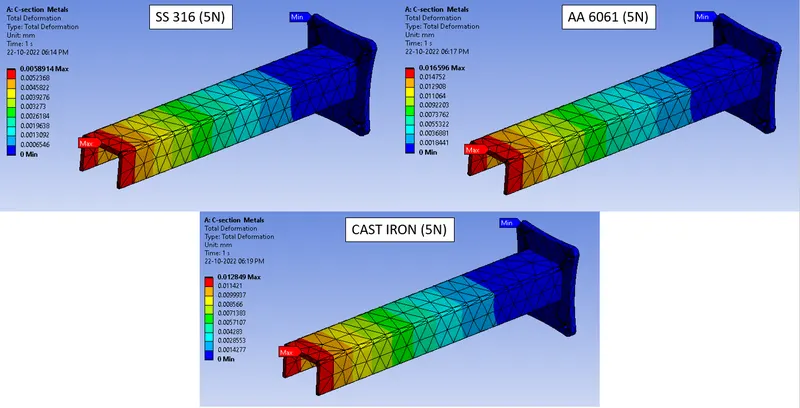
Fig.32 Total Deformation Counter Plot
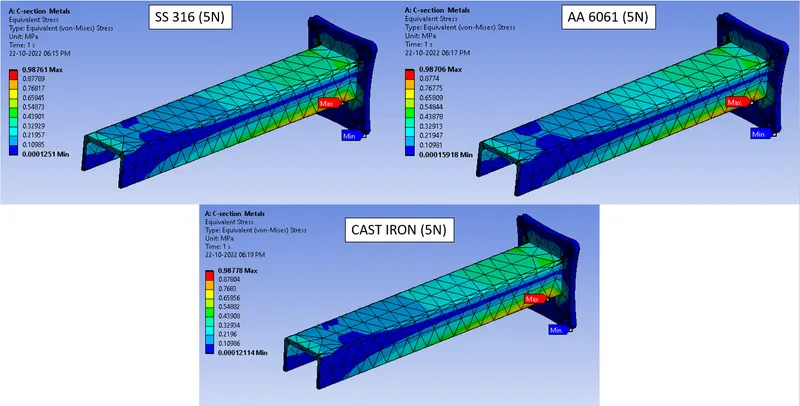
Fig.33 Equivalent Stress Counter Plot
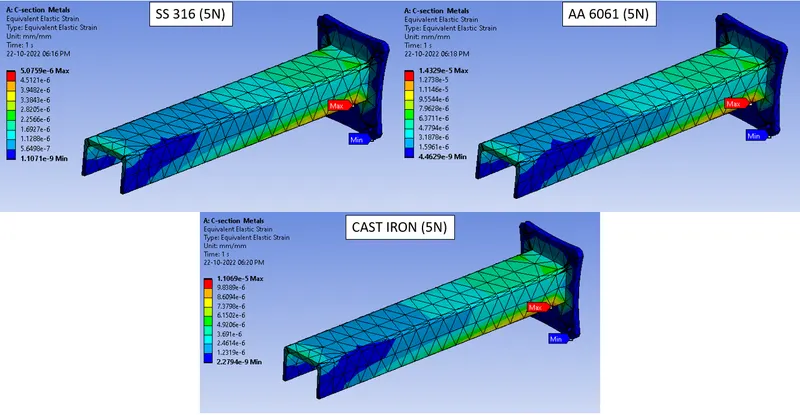
Fig.34 Equivalent Strain Counter Plot
I Section: The Total Deformation, Stress, and Strain obtained from the simulation are provided below.
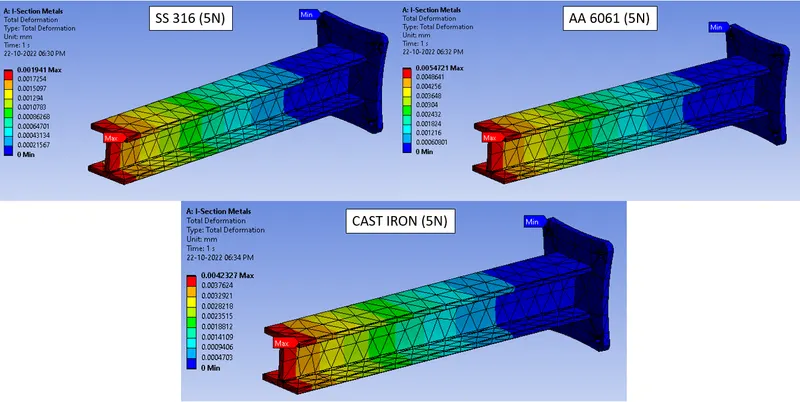
Fig.35 Total Deformation Counter Plot
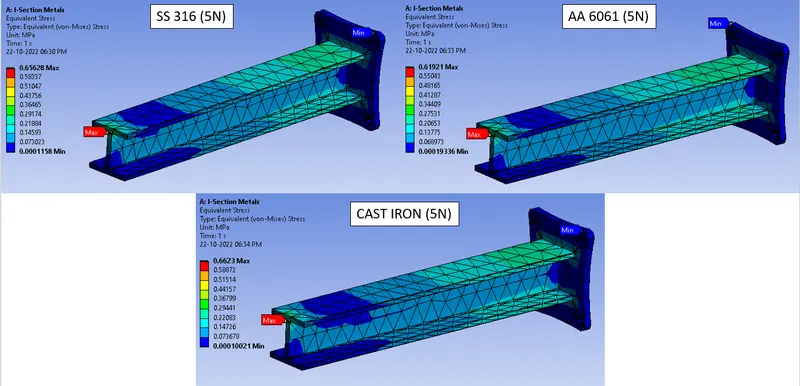
Fig.36 Equivalent Stress Counter Plot
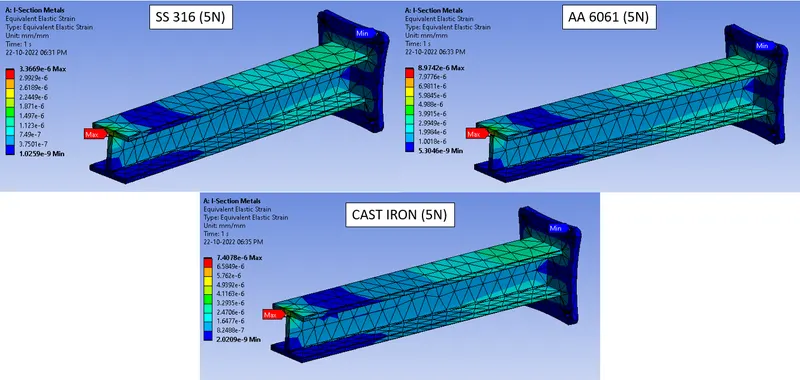
Fig.37 Equivalent Strain Counter Plot
METALS Load of 15N:
Inverted U Section: The Total Deformation, Stress, and Strain obtained from the simulation are provided below.
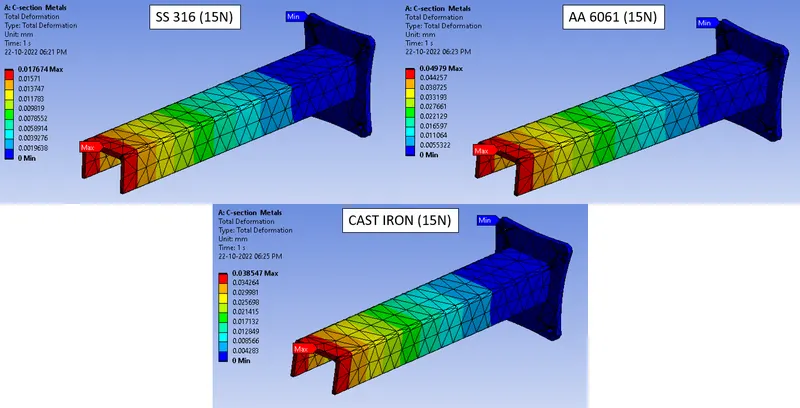
Fig.38 Total Deformation Counter Plot
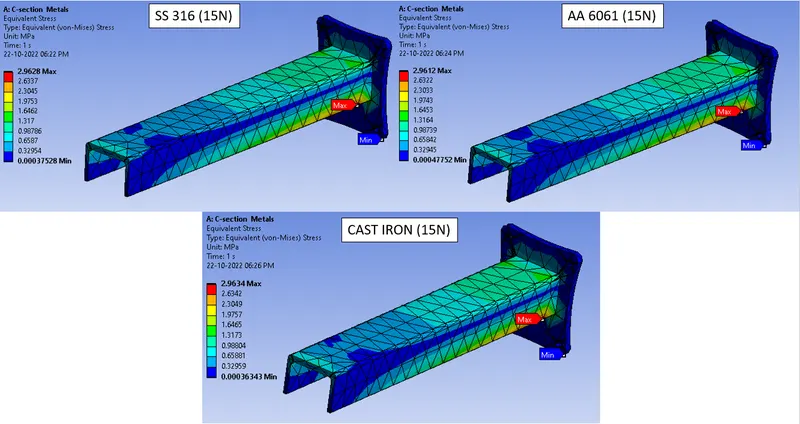
Fig.39 Equivalent Stress Counter Plot
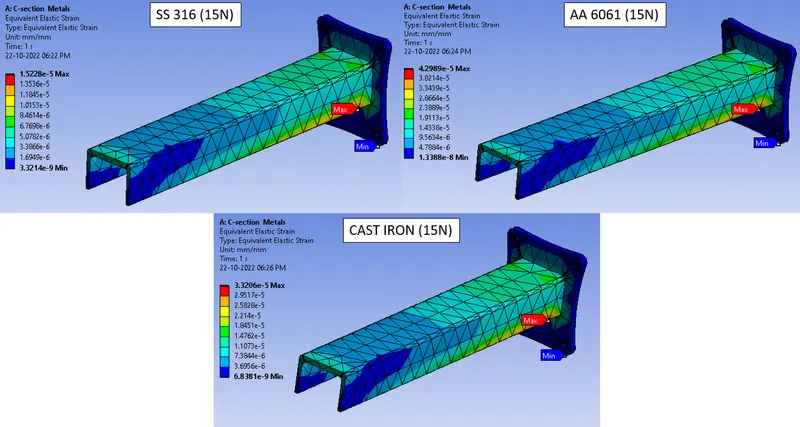
Fig.40 Equivalent Strain Counter Plot
I Section: The Total Deformation, Stress, and Strain obtained from the simulation are provided below.
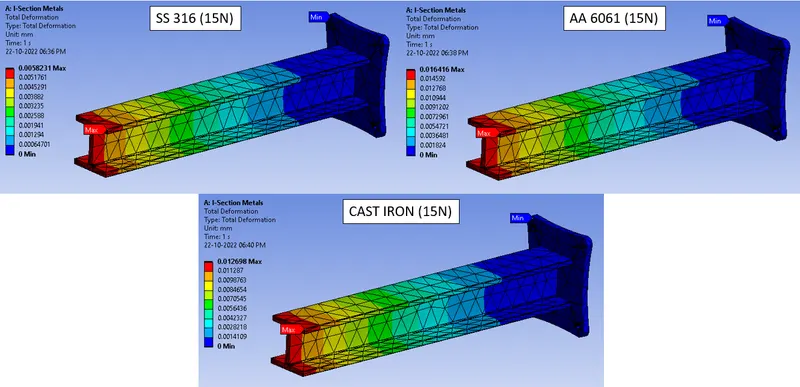
Fig.41 Total Deformation Counter Plot
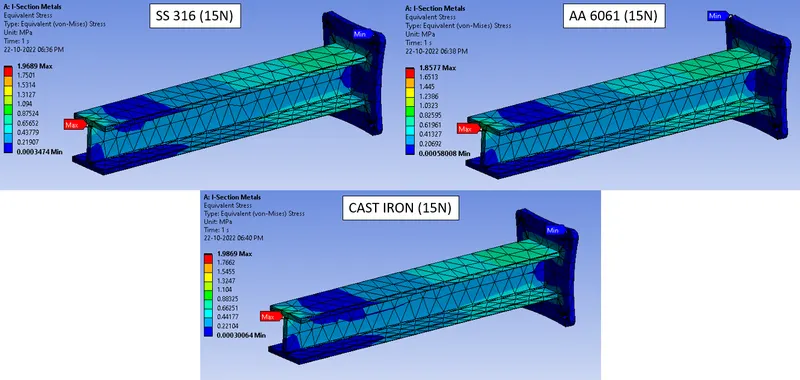
Fig.42 Equivalent Stress Counter Plot
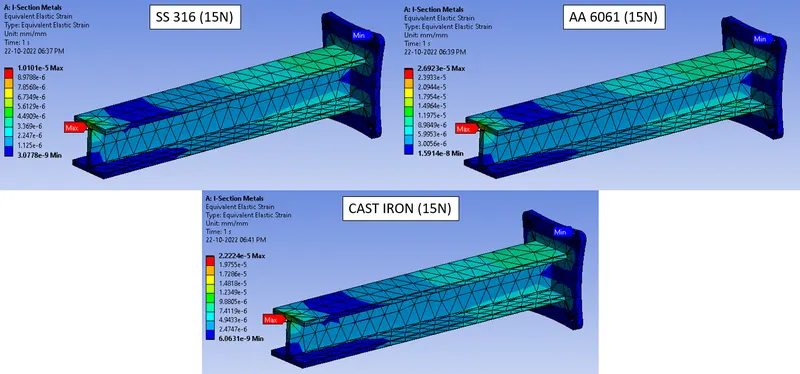
Fig.43 Equivalent Strain Counter Plot
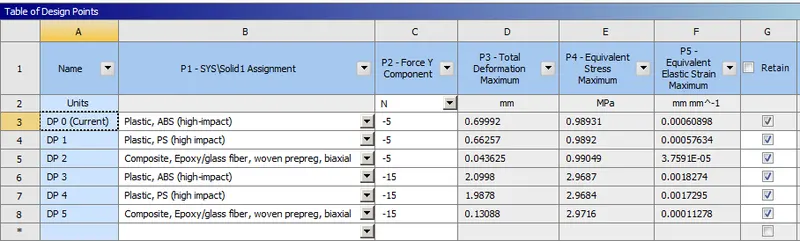
Fig.44 C Section Non-Metals Results (5&15N)
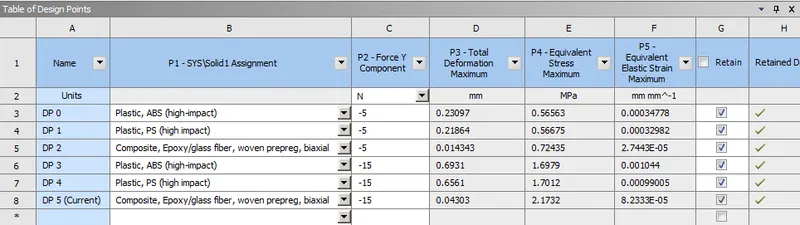
Fig.45 I Section Non-Metals Results (5&15N)
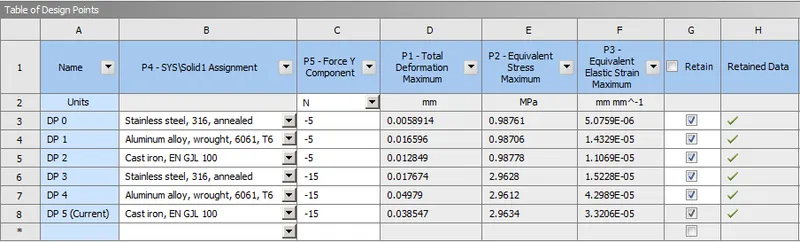
Fig.46 C Section Metals Results (5&15N)
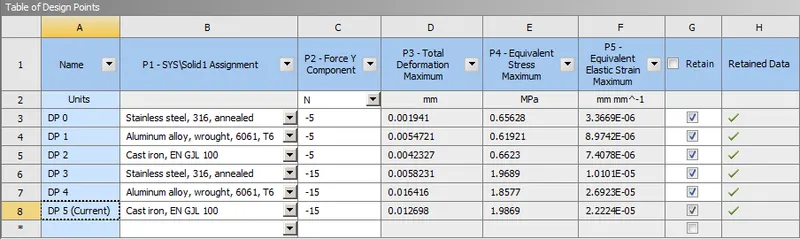
Fig.47 I Section Metals Results (5&15N)
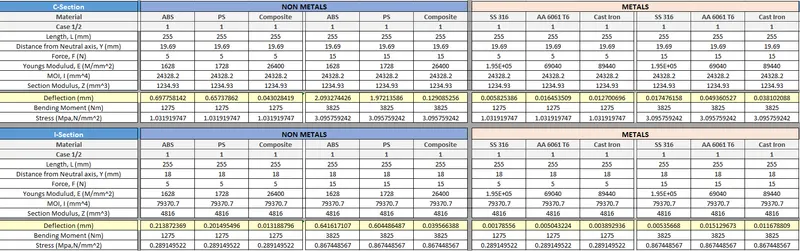
Fig.48 Analytical Calculation Results
|
Section |
Load (N) |
Material |
Plastic ABS |
Plastic PS |
Composite Epoxy/Glass |
|||
|
Output |
Analytical |
Simulation |
Analytical |
Simulation |
Analytical |
Simulation |
||
|
Inverted U |
5 |
Deformation (mm) |
0.697 |
0.699 |
0.657 |
0.662 |
0.043 |
0.043 |
|
Stress (MPa) |
1.03 |
0.989 |
1.03 |
0.9892 |
1.03 |
0.99 |
||
|
I Section |
5 |
Deformation (mm) |
0.213 |
0.23 |
0.201 |
0.21 |
0.013 |
0.0143 |
|
Stress (MPa) |
0.289 |
0.56 |
0.289 |
0.566 |
0.289 |
0.724 |
||
|
Inverted U |
15 |
Deformation (mm) |
2.093 |
2.099 |
1.972 |
1.987 |
0.129 |
0.13 |
|
Stress (MPa) |
3.095 |
2.968 |
3.095 |
2.968 |
3.095 |
2.971 |
||
|
I Section |
15 |
Deformation (mm) |
0.642 |
0.693 |
0.604 |
0.656 |
0.039 |
0.043 |
|
Stress (MPa) |
0.867 |
1.697 |
0.867 |
1.701 |
0.867 |
2.173 |
||
The above table provides the simulation and analysis calculation data results for Non-Metals.
|
Section |
Load (N) |
Material |
SS 316 |
AA 6061 |
Cast Iron |
|||
|
Output |
Analytical |
Simulation |
Analytical |
Simulation |
Analytical |
Simulation |
||
|
Inverted U |
5 |
Deformation (mm) |
0.0058 |
0.0058 |
0.0164 |
0.0165 |
0.0127 |
0.0128 |
|
Stress (MPa) |
1.032 |
0.987 |
1.032 |
0.987 |
1.032 |
0.987 |
||
|
I Section |
5 |
Deformation (mm) |
0.0017 |
0.0019 |
0.005 |
0.0054 |
0.0038 |
0.0042 |
|
Stress (MPa) |
0.289 |
0.656 |
0.289 |
0.619 |
0.289 |
0.662 |
||
|
Inverted U |
15 |
Deformation (mm) |
0.0174 |
0.0176 |
0.0493 |
0.0497 |
0.0381 |
0.0385 |
|
Stress (MPa) |
3.095 |
2.962 |
3.095 |
2.961 |
3.095 |
2.963 |
||
|
I Section |
15 |
Deformation (mm) |
0.0053 |
0.0058 |
0.0151 |
0.0164 |
0.0116 |
0.0126 |
|
Stress (MPa) |
0.867 |
1.986 |
3.095 |
1.857 |
3.095 |
1.986 |
||
The above table provides the simulation and analytical calculation data results for Metals.
CONCLUSION:
The analysis was run successfully and results were obtained and tabulated. A Grid Dependency test has been performed and it was observed that desired output values are dependent on mesh size. The Default Mesh Element Size has results close to Analytical Solution. The higher the mesh elements, the higher the accuracy but the time to compute will also become high. So, there should be a balance between mesh elements' size and time for computation.
The use of metals in the CCTV Camera Mount Stand has lesser deformation when compared to Non-Metals as Plastics are cost-effective for such purposes. So, the use of plastic (Non-Metals) also does the intended work perfectly. Even though there is larger deformation for higher loads for plastics, in such cases composites have advantages over plastic. It is good to use plastic for such applications rather than using traditional materials as inferred from this analysis work and I Section Beams are better when compared to C Section beams for such load cases.
Thus, the analysis was run and compared against the analytical calculation and justified.