Gate Valve Parametric Study using Ansys fluent
Abstract:
Gate valves are used for directing the fluid flow in one direction with minimum restriction. Gate valves are widely used in industries like petrochemicals, refineries, steel plant, process industries and power generation plant. The main objective of this project is to conduct a parametric study of gate disc at various position of openings and observe the rate of flow and outlet pressure. Ansys fluent is used for modeling the fluid flow and computation of different flow coefficient and flow factor for each opening is studied.
Introduction:
A gate valve also known as a sluice valve is a valve which opens by lifting a round or rectangular gate/wedge out of the path of the fluid. The distinct feature of a gate valve is the sealing surfaces between the gate and seats are planar, so gate valves are often used when a straight-line flow of fluid and minimum restriction is desired. The gate faces can be parallel, but are most commonly wedge-shaped. Gate valves are primarily used to permit or prevent the flow of liquids, but typical gate valves shouldn't be used for regulating flow, unless they are specifically designed for that purpose. Because of their ability to cut through liquids, gate valves are often used in the petroleum industry. For extremely thick fluids, a specialty valve often known as a knife gate valve is used to cut through the liquid. On opening the gate valve, the flow path is enlarged in a highly nonlinear manner with respect to percent of opening. This means that flow rate does not change evenly with stem travel. Also a partially open gate tends to vibrate from the fluid flow. Most of the flow change occurs near shutoff with a relatively high fluid velocity causing gate and seat wear and eventual leakage if used to regulate flow. Typical gate valves are designed to be fully opened or closed. When fully open, the typical gate valve has no obstruction in the flow path, resulting in very low friction loss.
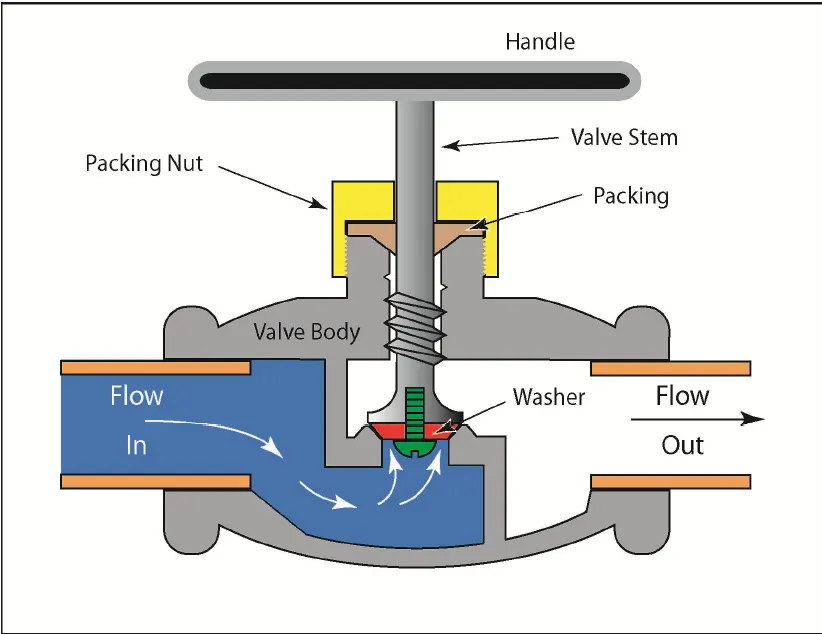
Gate valves are actuated by a threaded stem which connects the actuator (e.g. hand wheel or motor) to the gate. They are characterized as having either a rising or a non rising stem, depending on which end of the stem is threaded. Rising stems are fixed to the gate and rise and lower together as the valve is operated, providing a visual indication of valve position.
The actuator takes the form of a nut which is rotated around the threaded stem to move it. Non rising stem valves are fixed to, and rotate with, the actuator, and are threaded into the gate. They may have a pointer threaded onto the upper end of the stem to indicate valve position, since the gate's motion is concealed inside the valve. Non rising stems are used underground
or where vertical space is limited. Gate valves are primarily designed to serve as isolation valves. In service, these valves generally are either fully open or fully closed. When fully open, the fluid or gas flows through the valve in a straight line with very little resistance. It should not be used in the regulation or throttling of flow because accurate control is notpossible. Furthermore, high-flow velocity in partially opened valves may cause erosion of the discs and seating surfaces. Vibration may also result in chattering of the partially opened valve disc. An exception to the above are specially designed gate valves that are used for lowvelocity
throttling; for example, guillotine gate valves for pulp stock.
Flow coefficient
The flow coefficient of a device is a relative measure of its efficiency at allowing flui flow. It describes the relationship between the pressure drop across an orificevalve or other assembly and the corresponding flow rate.
Mathematically the flow coefficient Cv (or flow-capacity rating of valve) can be expressed as :

where:
- Q is the rate of flow (expressed in US gallons per minute),
- SG is the specific gravityof the fluid (for water = 1),
- ΔP is the pressure drop across the valve (expressed in psi).
In more practical terms, the flow coefficient Cv is the volume (in US gallons) of water at 60 °F that will flow per minute through a valve with a pressure drop of 1 psi across the valve.
The use of the flow coefficient offers a standard method of comparing valve capacities and sizing valves for specific applications that is widely accepted by industry. The general definition of the flow coefficient can be expanded into equations modeling the flow of liquids, gases and steam using the discharge coefficient.
Flow factor
The metric equivalent flow factor (Kv; commonly used everywhere else in the world with the exception of the United States) is calculated using metric units :

where
Kv is the flow factor (expressed in {displaystyle [m^{3}.h^{-1}.bar^{-0.5}]} ).
).
Q is the flowrate (expressed in cubic metres per hour [{displaystyle m^{3}/h} ]),
]),
SG is the specific gravityof the fluid (for water = 1),
ΔP is the pressure drop across the valve (expressed in psi).
Kv can be calculated from Cv using the equation:

Objective:
For this challenge, you will have to perform a parametric study on the gate valve simulation by setting the opening from 10 % to 80%.
- Obtain the mass flow rates at the outlet for each design point.
- Calculate the flow coefficient and flow factor for each opening and plot the graph.
- Discuss the results of the mass flow rate and flow coefficient.
Modelling approach:
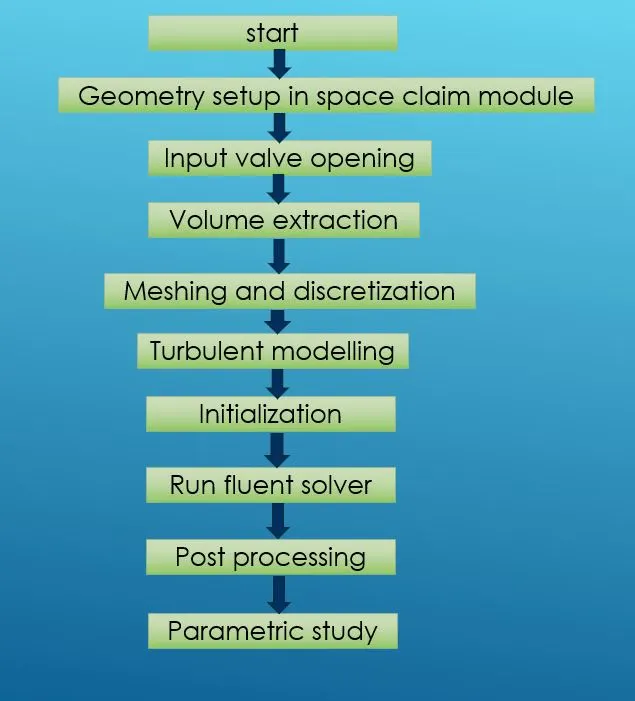
Geometry preparation:
- Import the model as step file format in the space claim design domain.
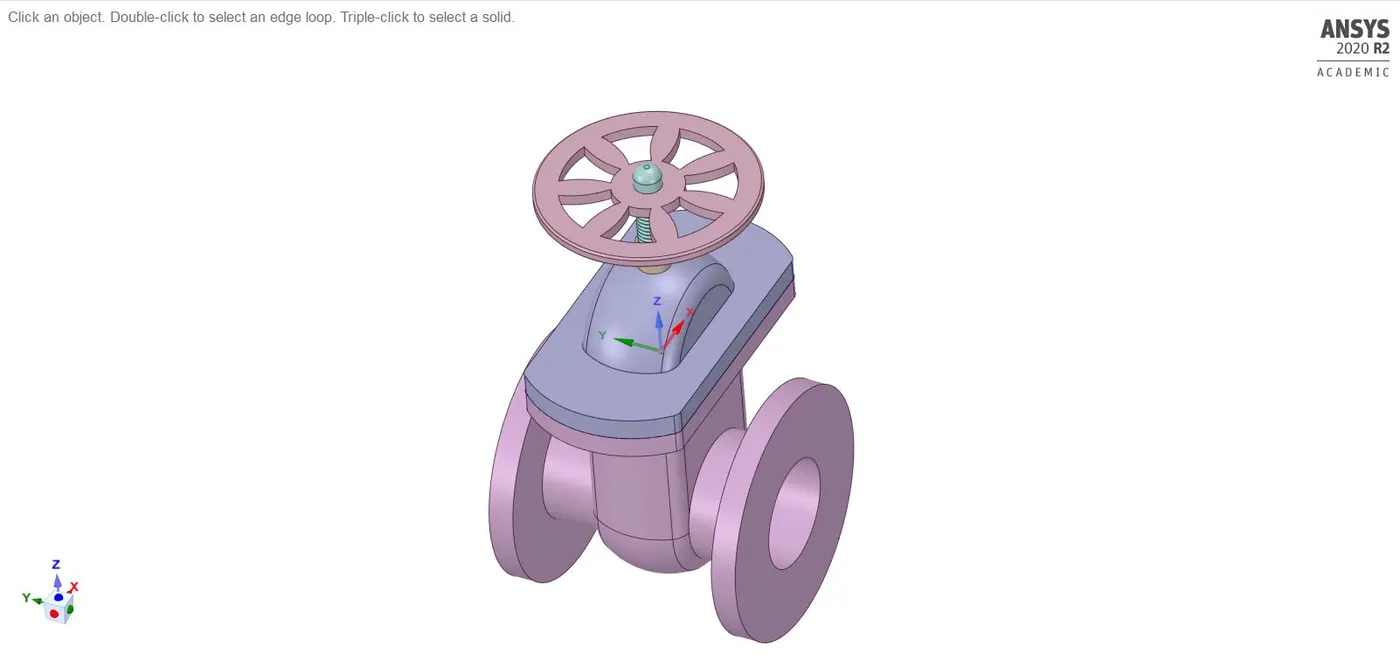
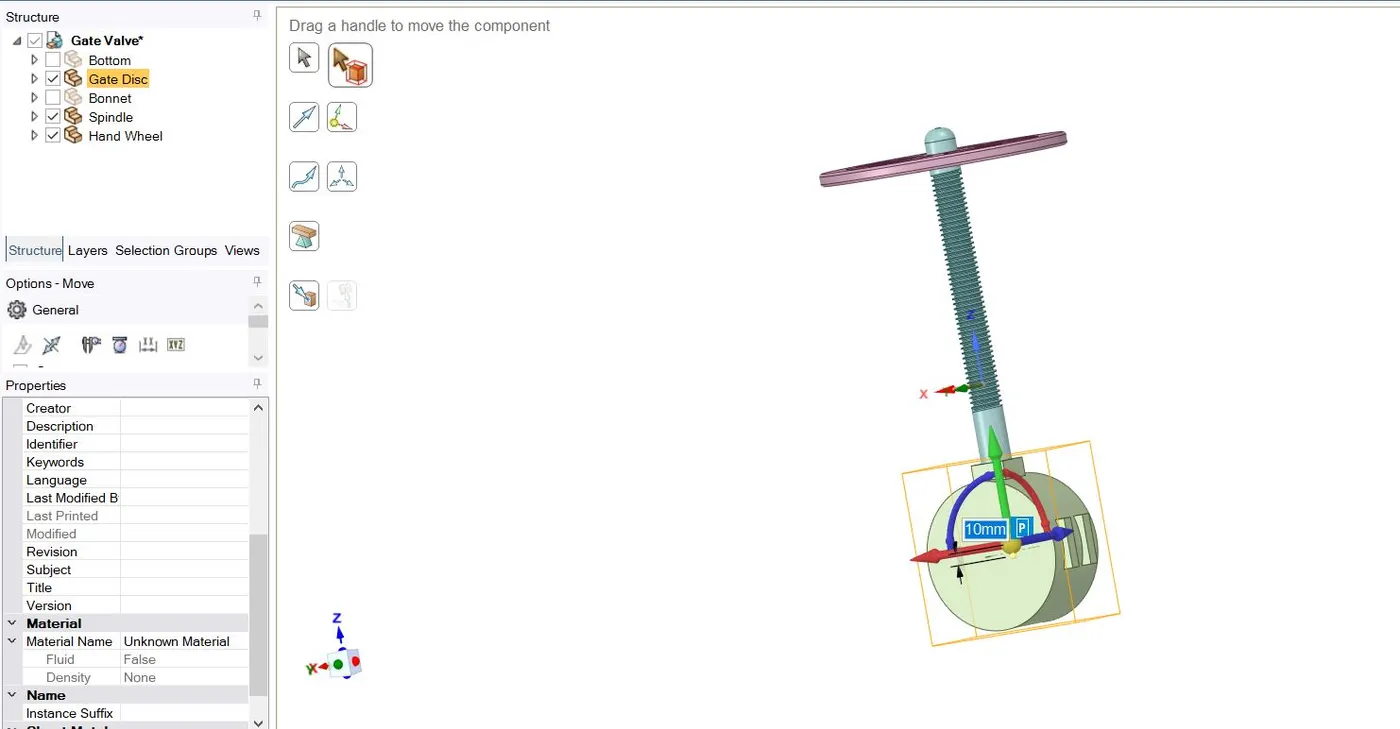
- First of all, we set the opening of the valve by selecting the move option from the design tab>> select component wise selection>>set the value and click on the p icon for parametrizing.
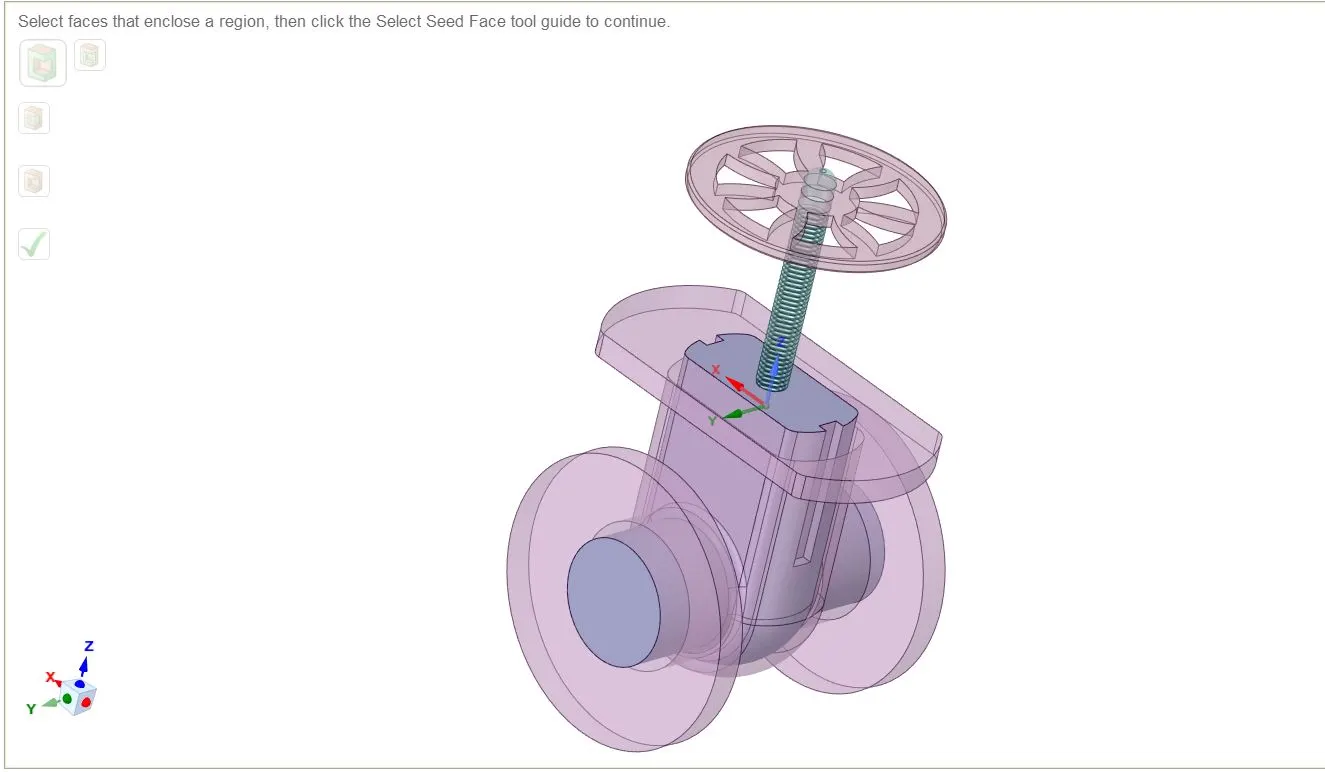
- Noe for volume extraction of the domain>> select the volume extract from the prepare tab>> select the two-valve opening and outlet section and also select the inner structure of the bonnet covering.
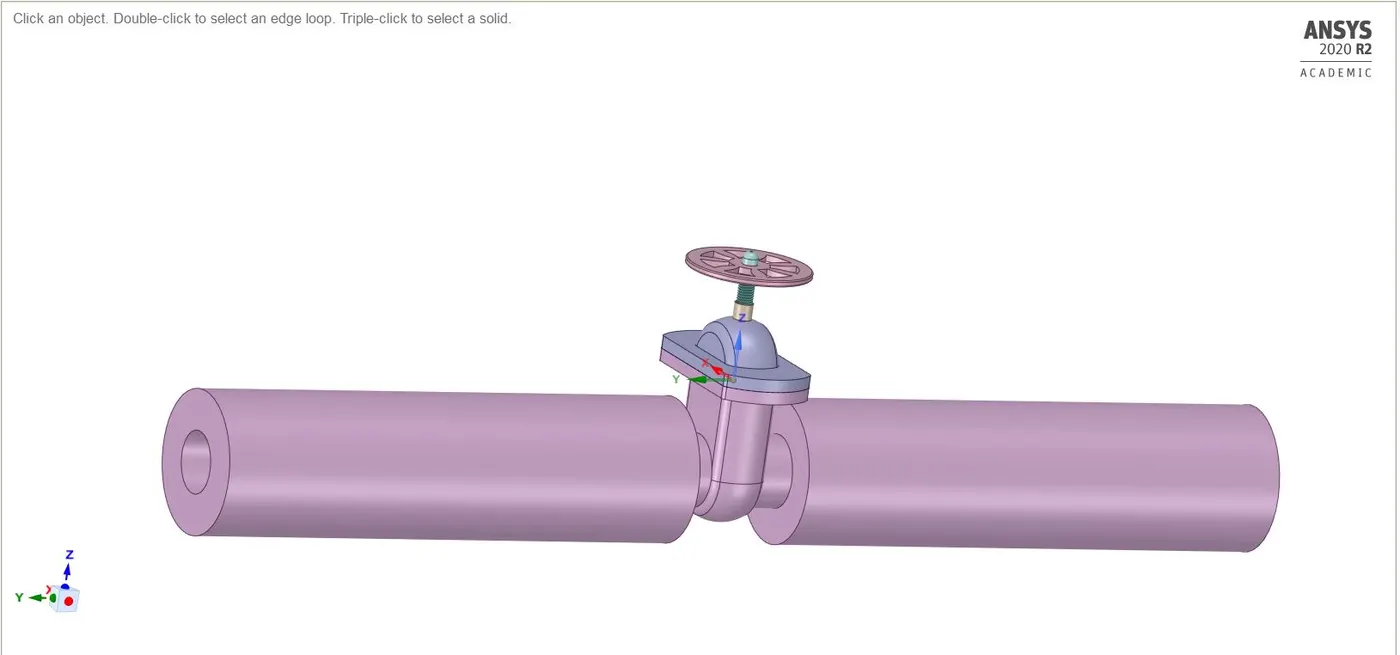
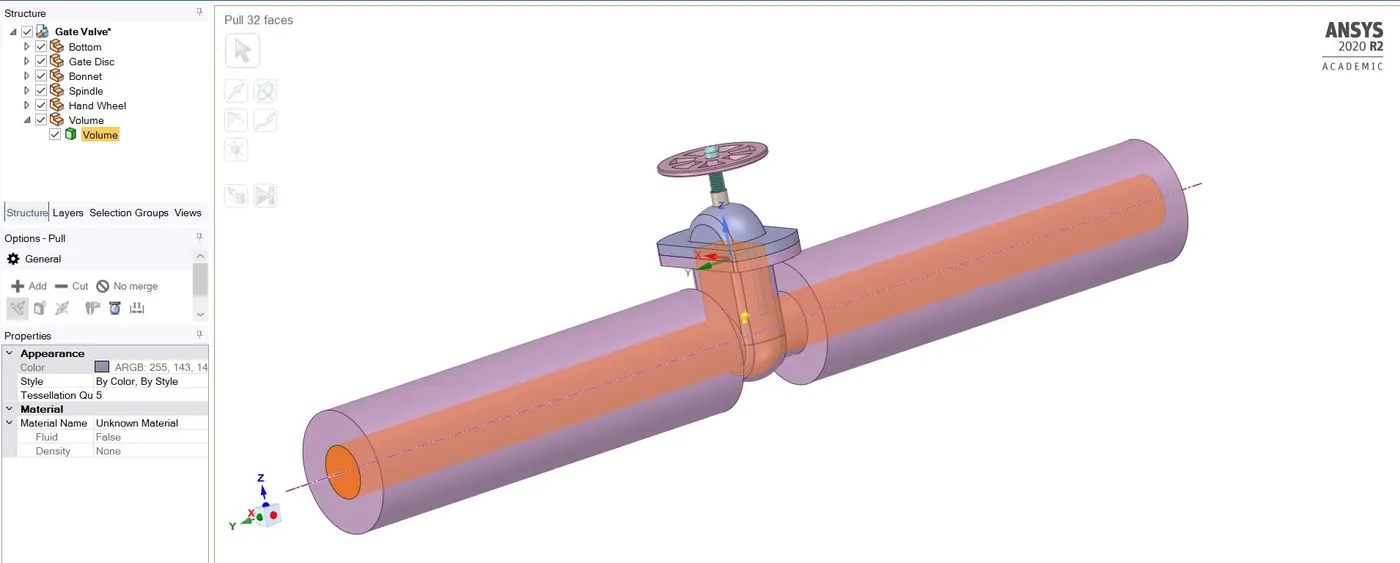
- To expand the region of fluid volume domain>> select pull tool>> choose the opening and outlet face, extend it by 800mm.
- Now click on the volume icon from the design tree>> right click and update the volume with current body selection.
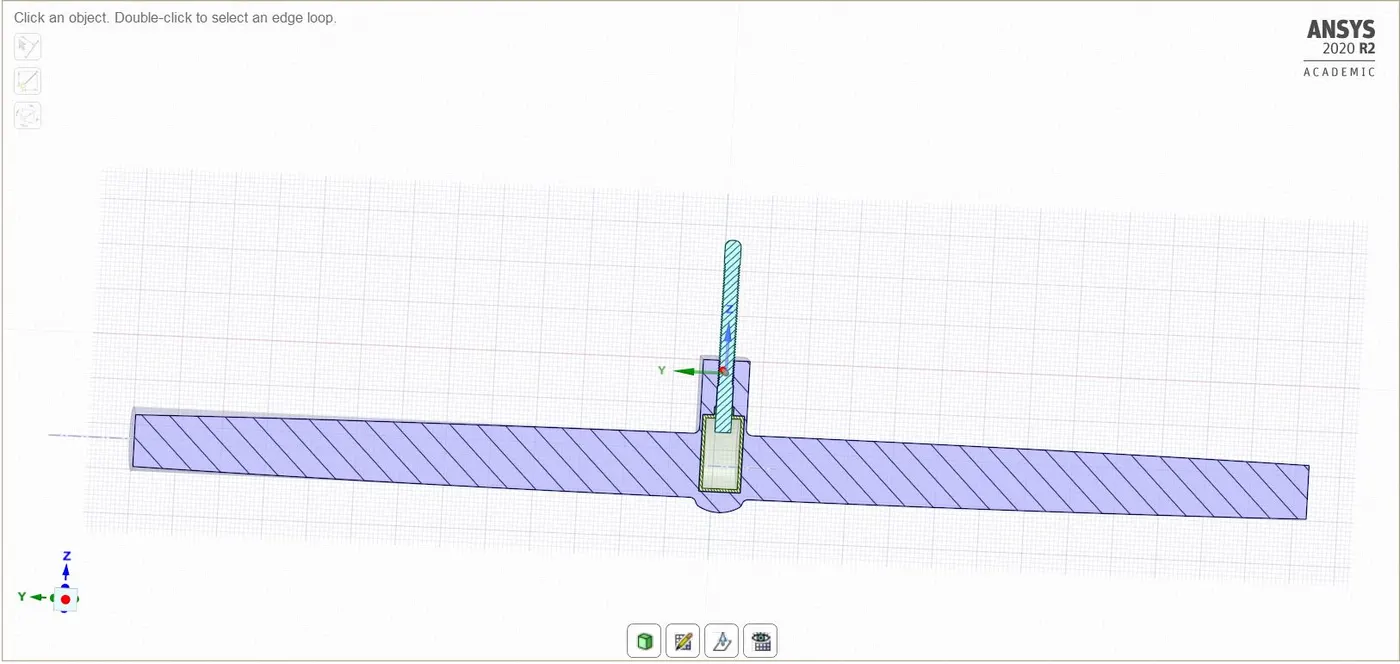
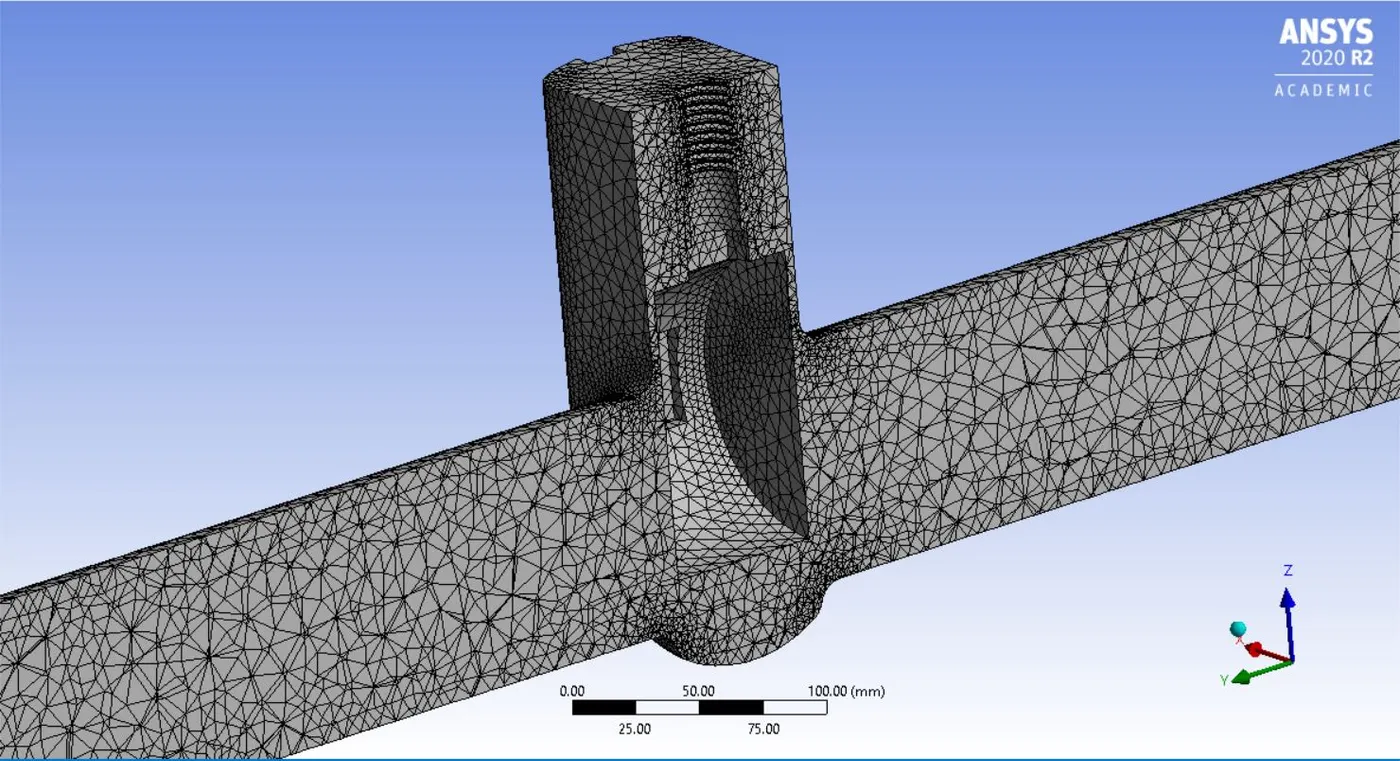
- A cross-section view is also observed to check the zone of fluid interacting with the gate disc and spindle cross section.
Meshing:
- Open the mesh console.
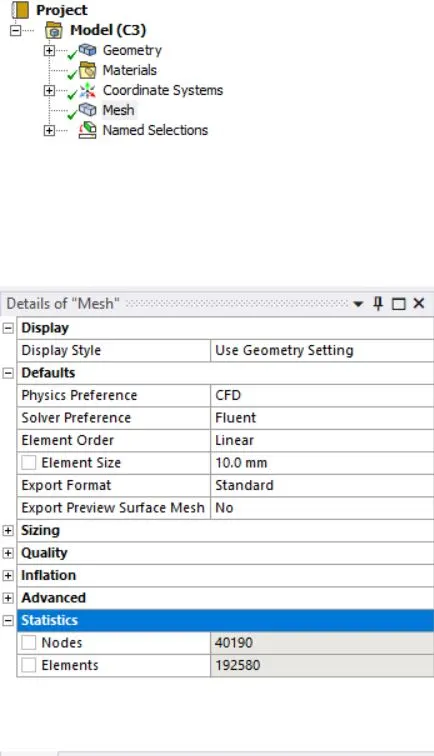
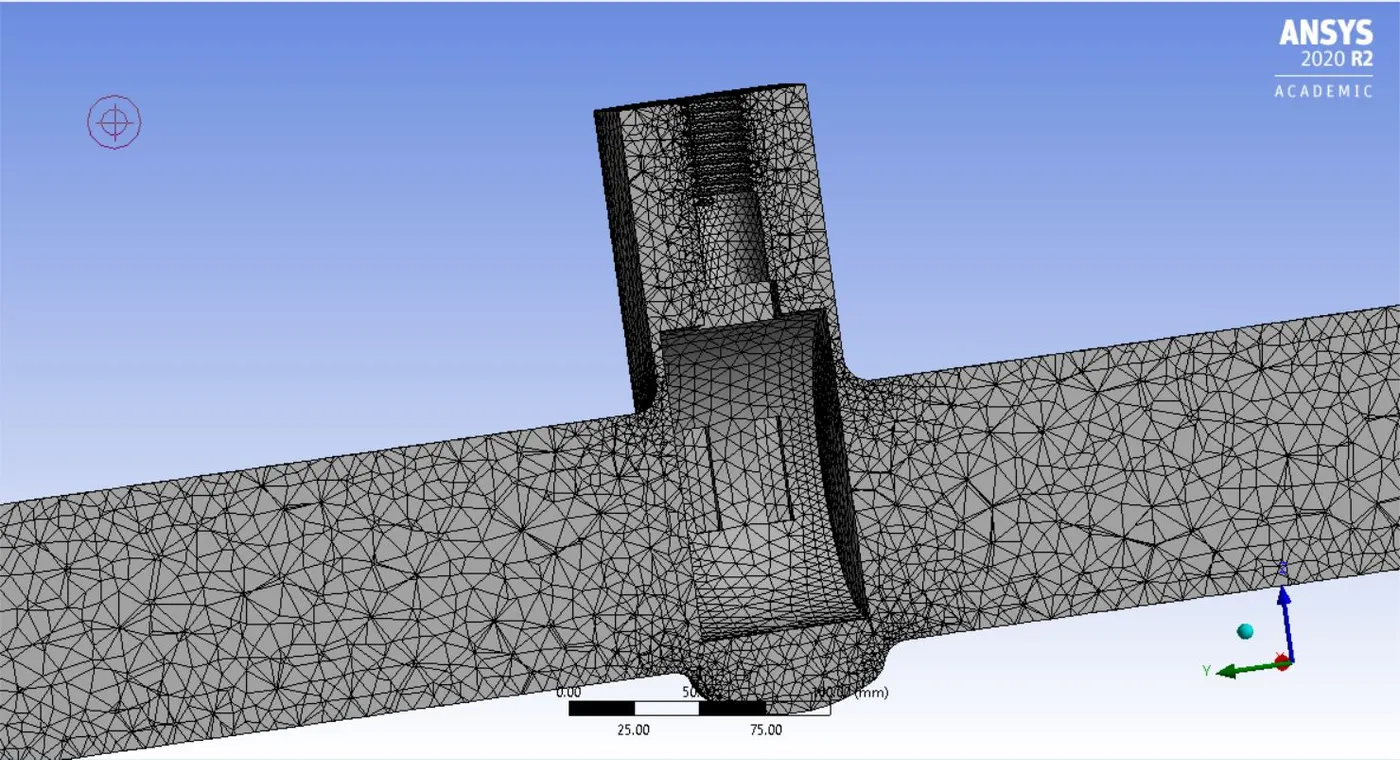
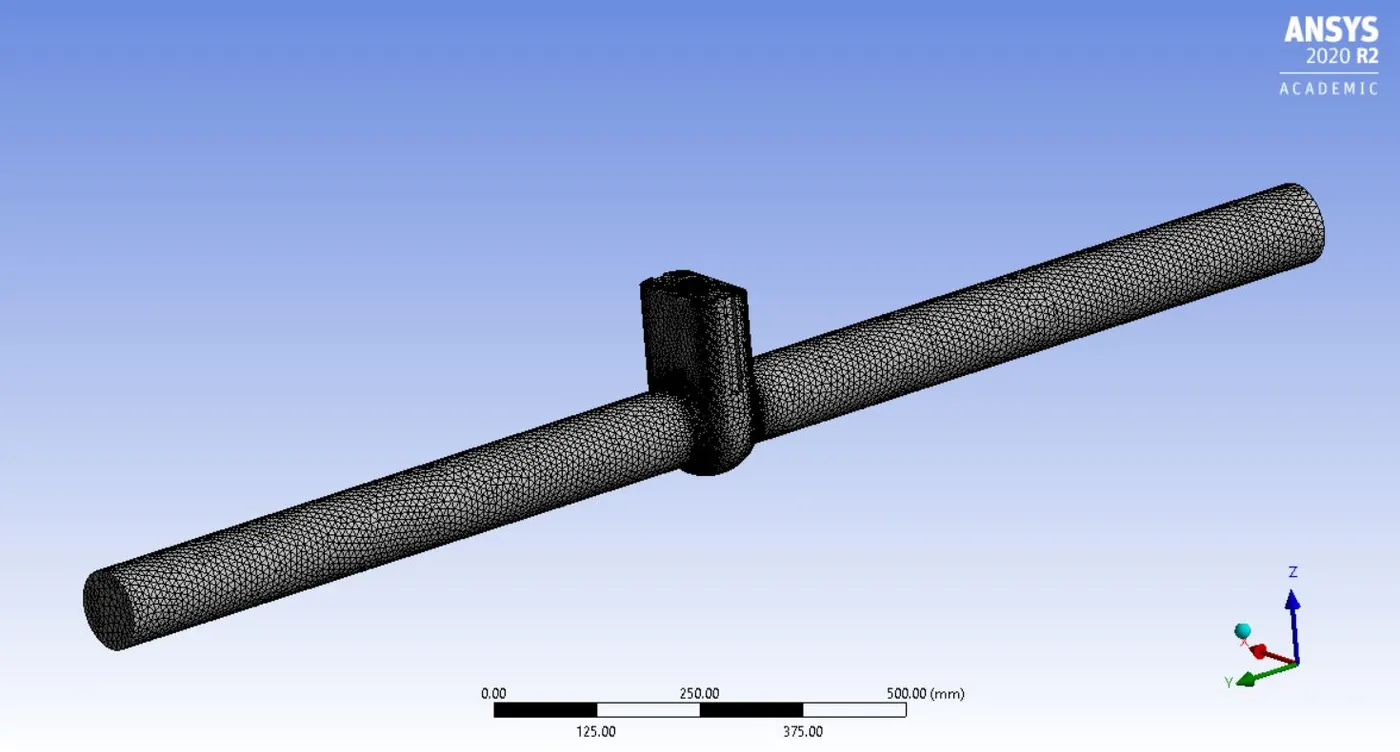
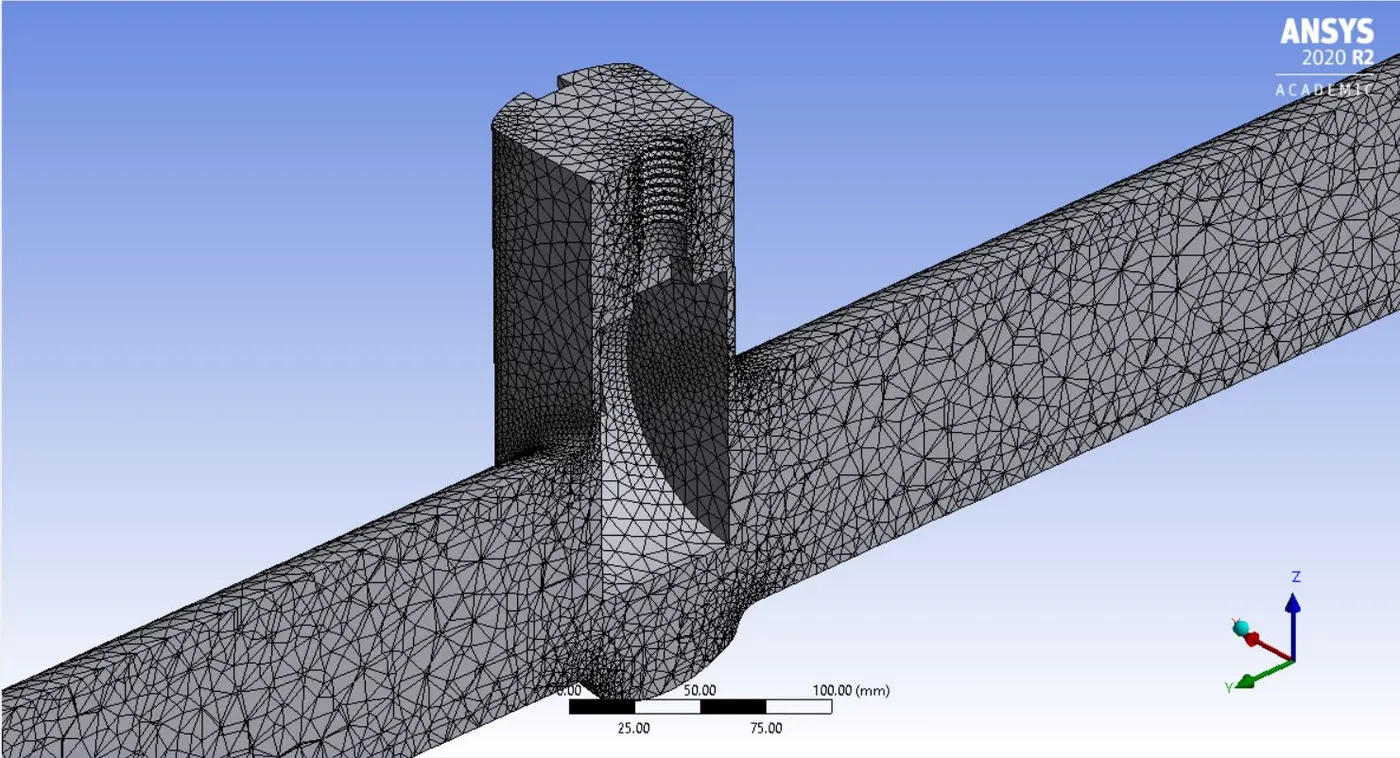
- For the mesh size choose 10mm>> click on generate mesh.
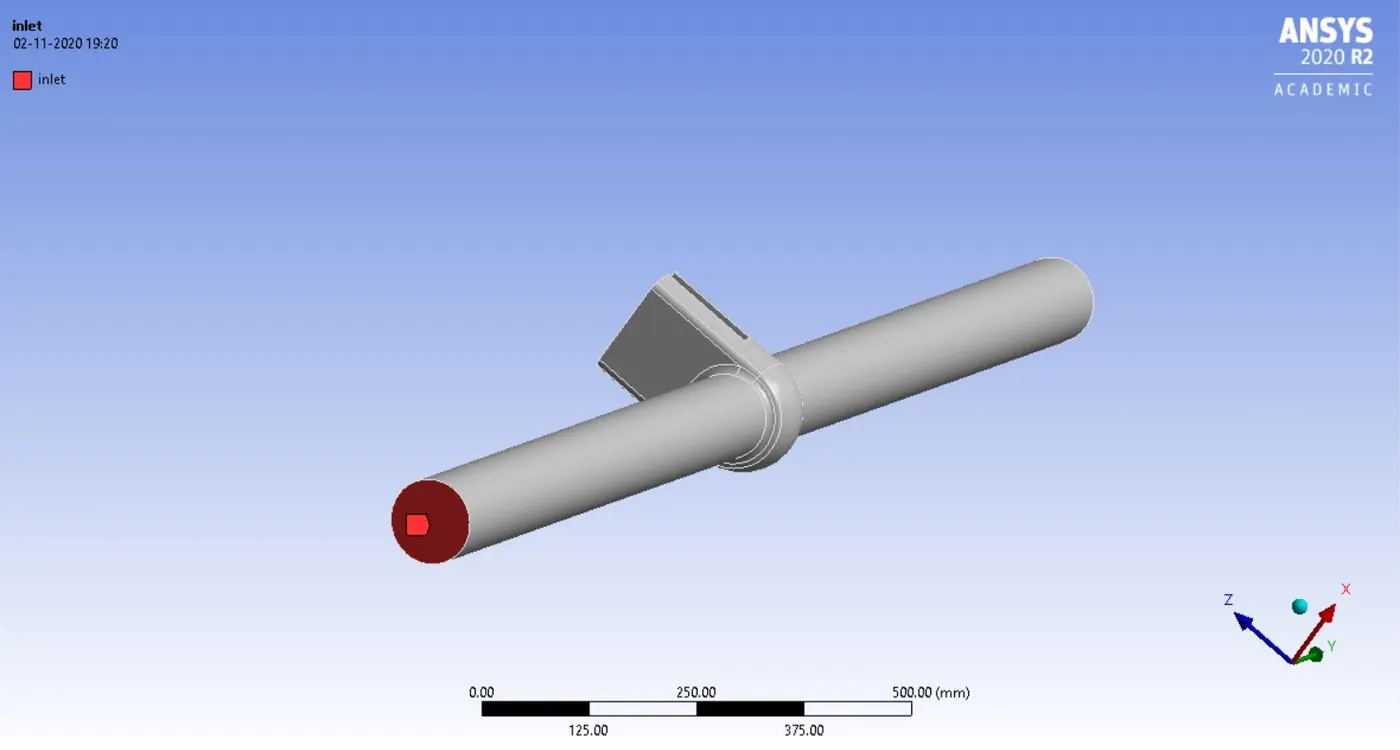
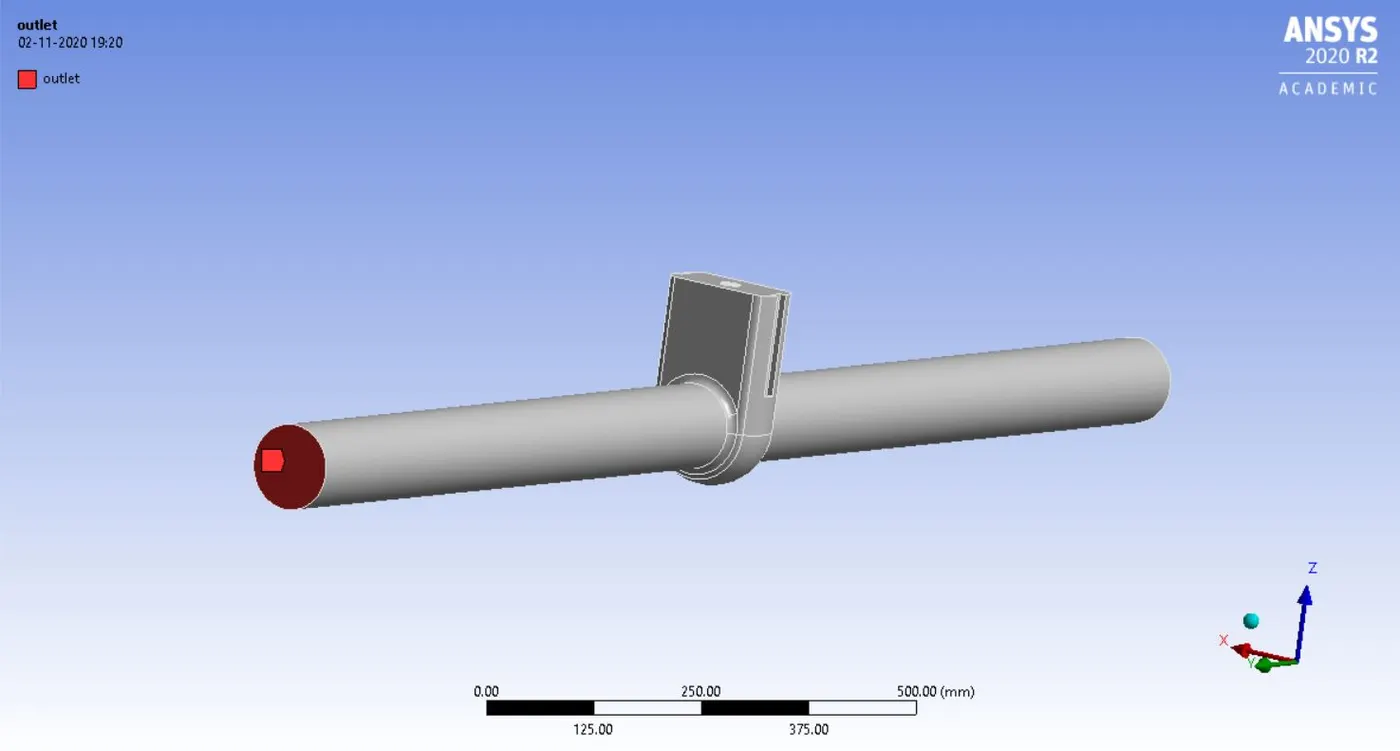
- Create named selection for the inlet and outlet section.
- Update the mesh console.
Pre-processing physics settings:
- Open the fluent console.
- Choose pressure base solver>> enable gravity>> turn on steady state simulation.
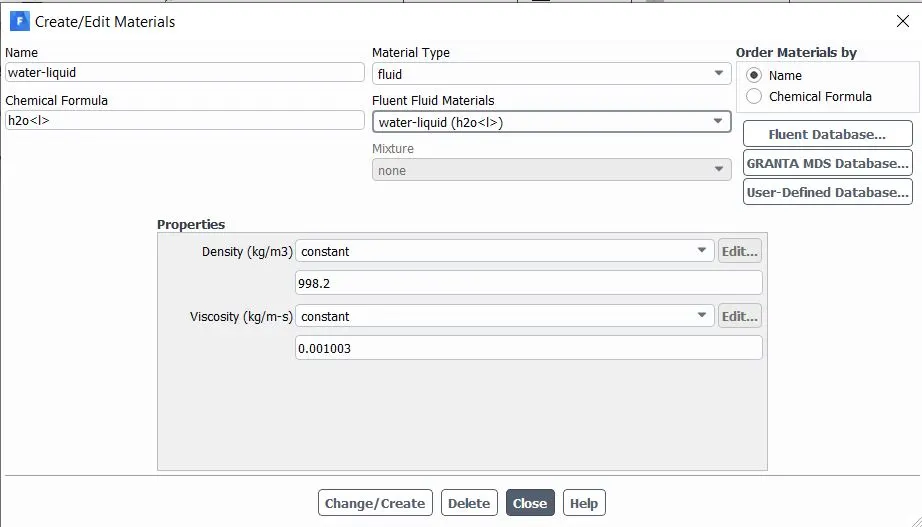
- Select material as water from the material selection tab
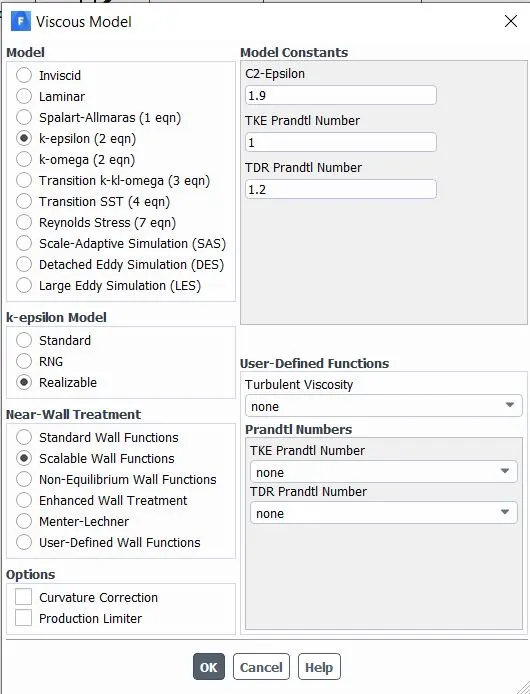
- For turbulent model>> choose k-epsilon with realizable standard and scalable wall function.
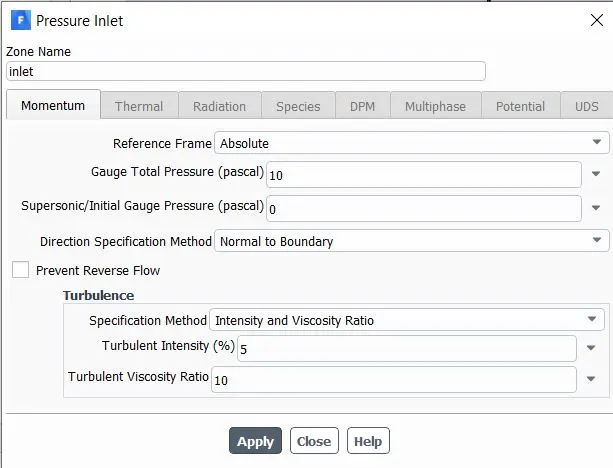
- apply boundary conditions
- For report definition>> choose mass flow rate and total pressure at the outlet section and also select the output parameter to parametrize it.
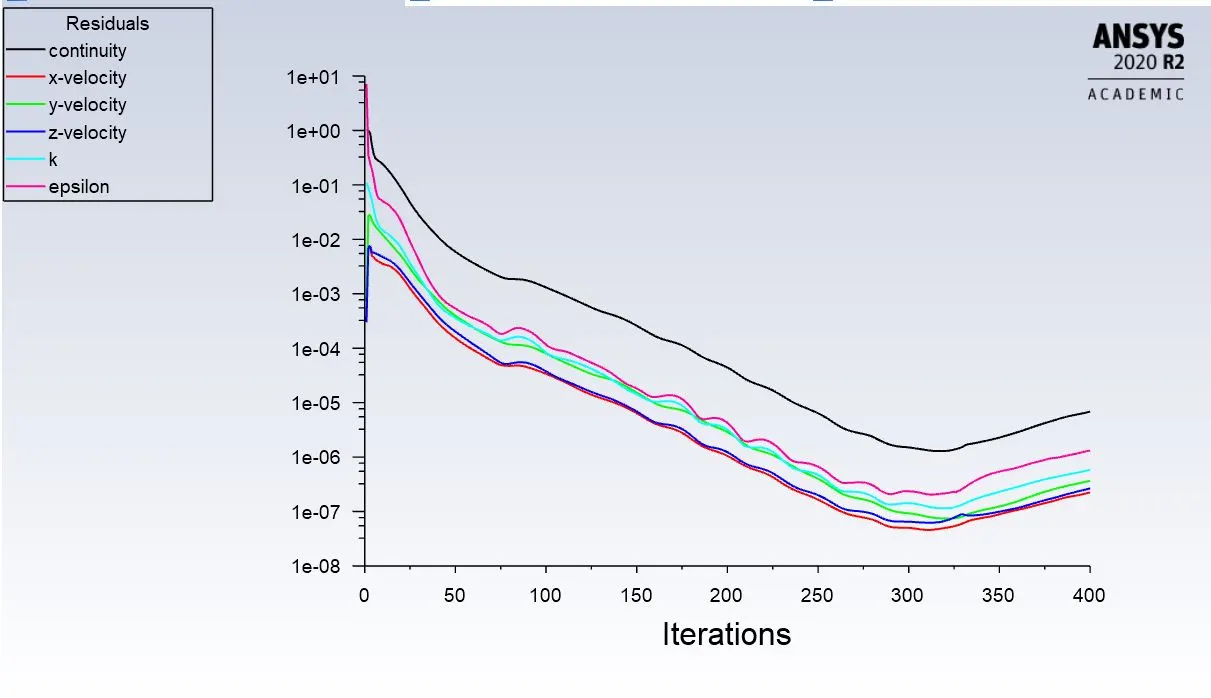
- For convergence, uncheck the convergence criteria.
- For initialization choose standard mode and initialize from the inlet.
- Create a plane at a cross section of the gate valve.
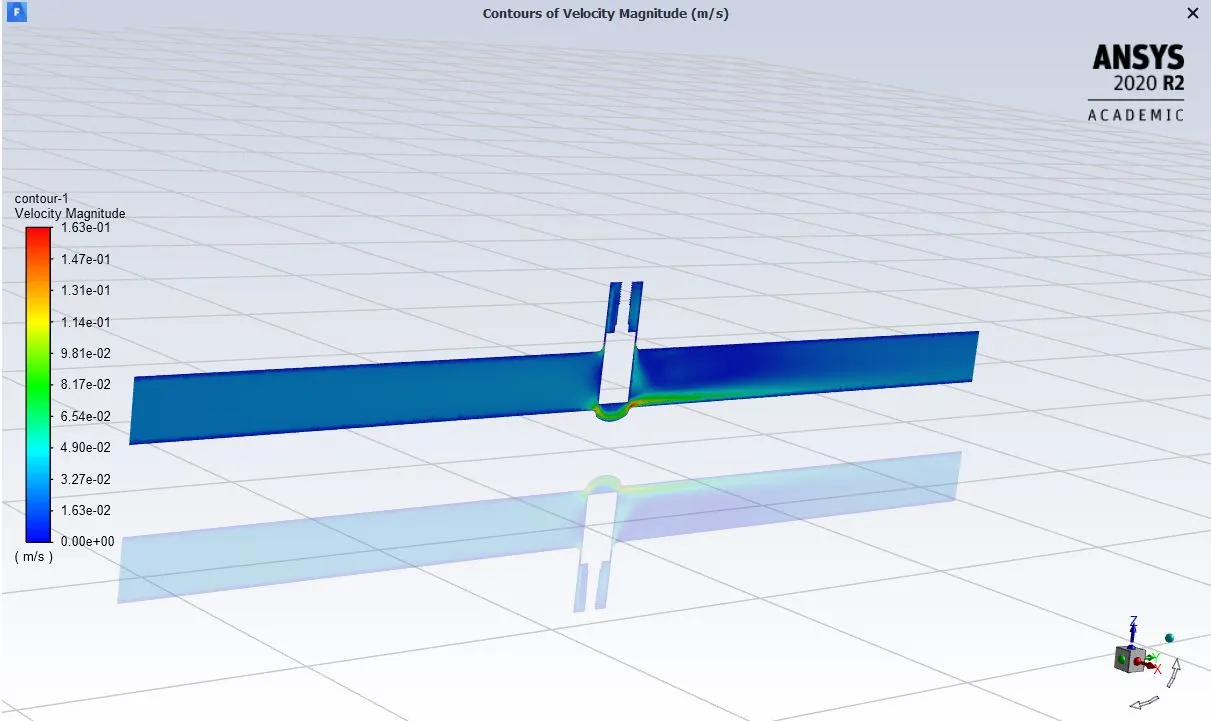
- Create contours of velocity to observe the flow of water.
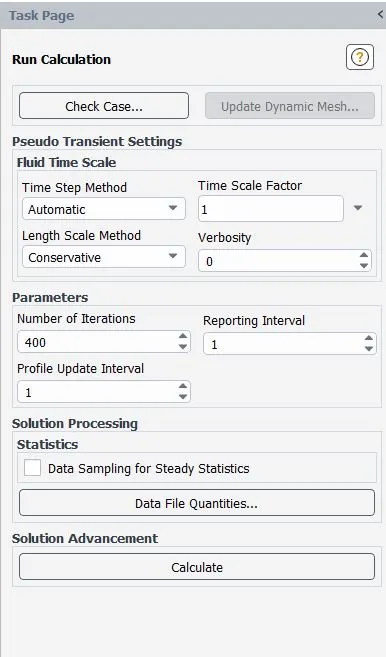
- Specify the iteration numbers and hit calculate tab.
Detail settings and post processing images at different design points:
- Design point 1:
Opening of gate disc: 10mm
Meshing
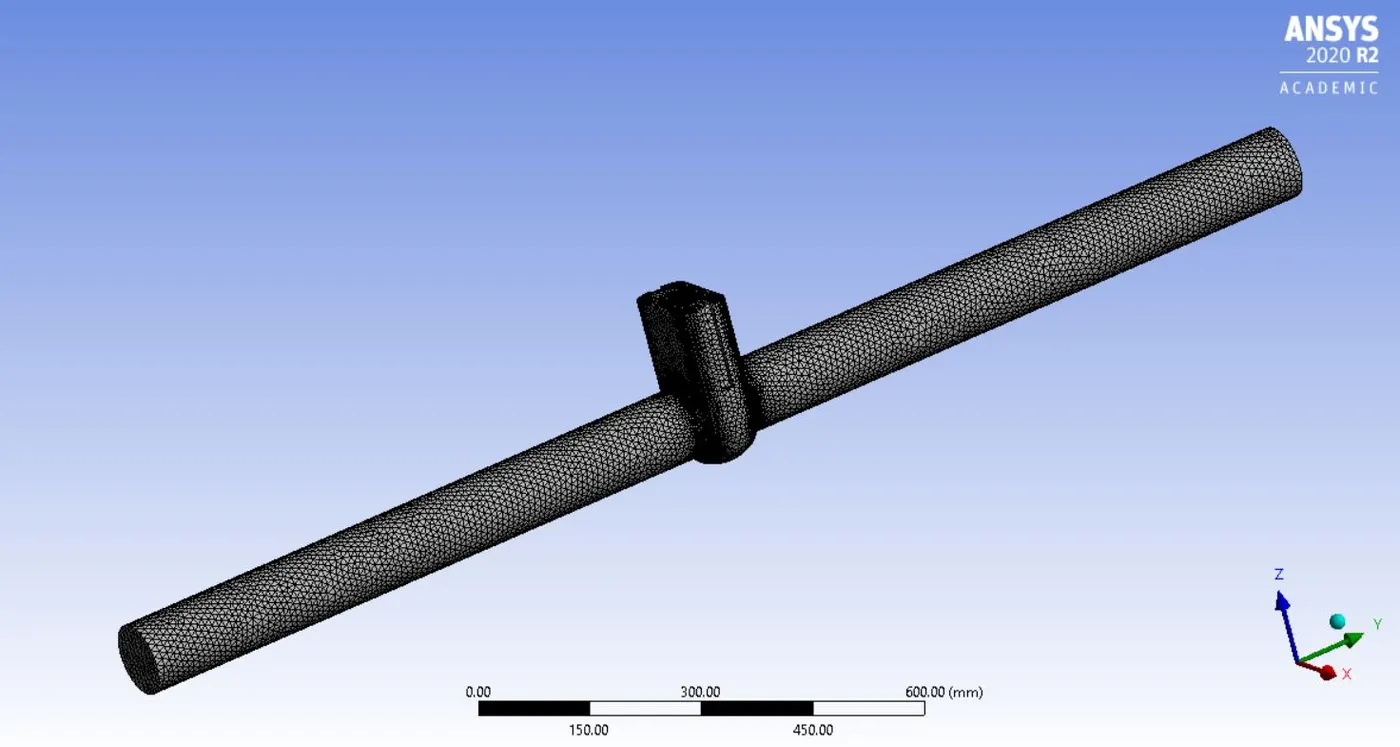
Mesh section view
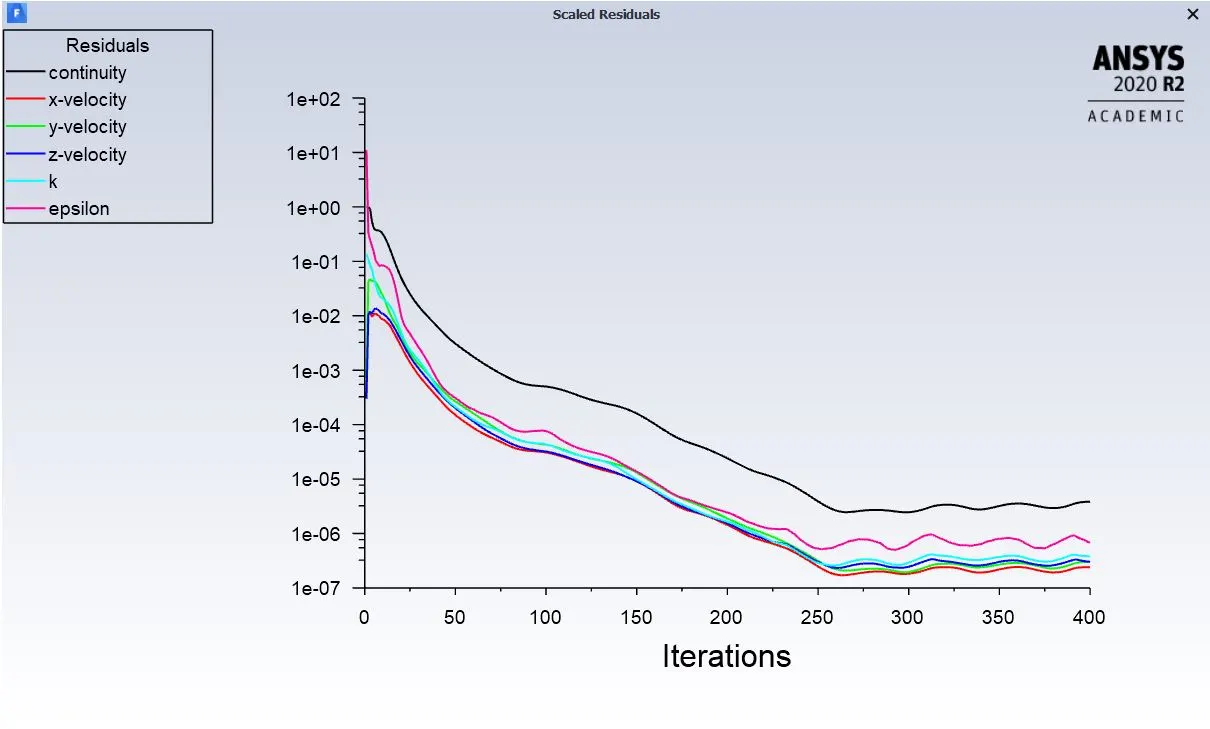
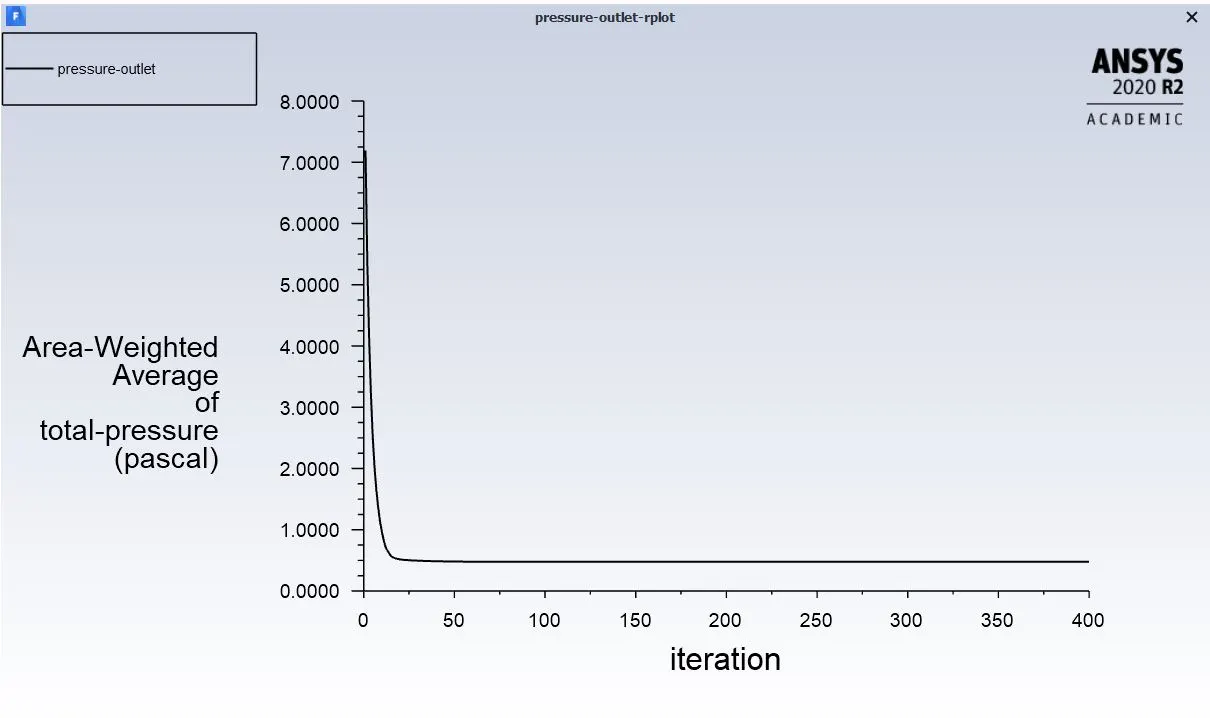
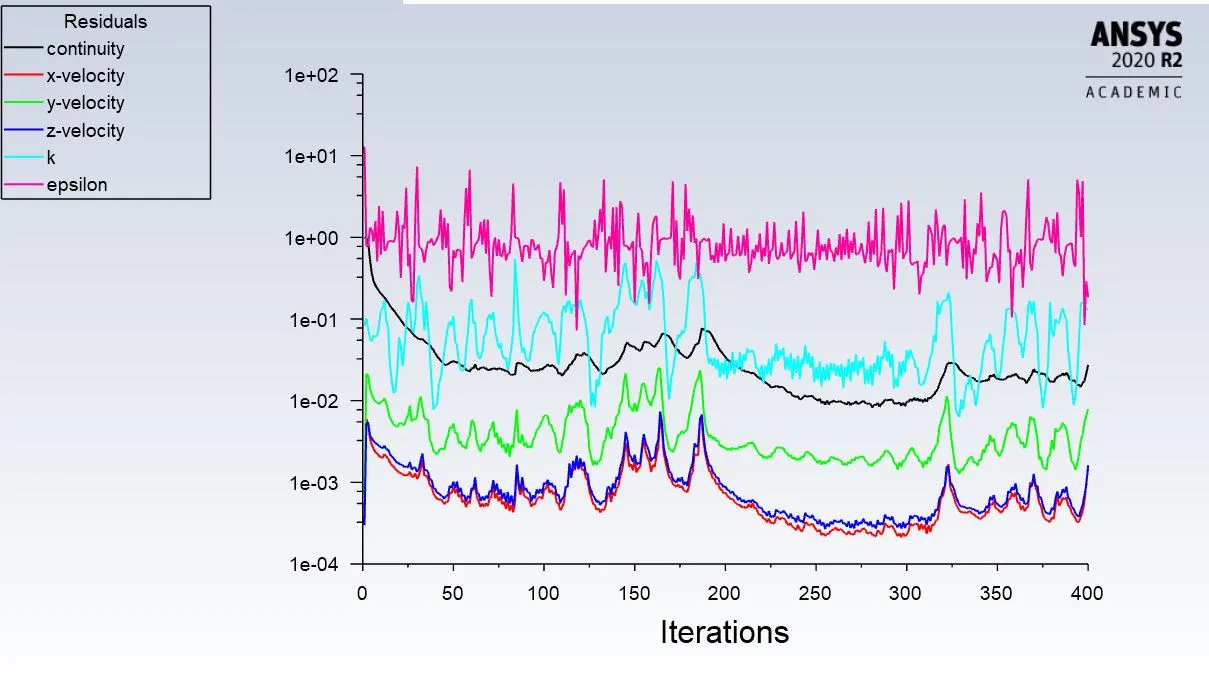
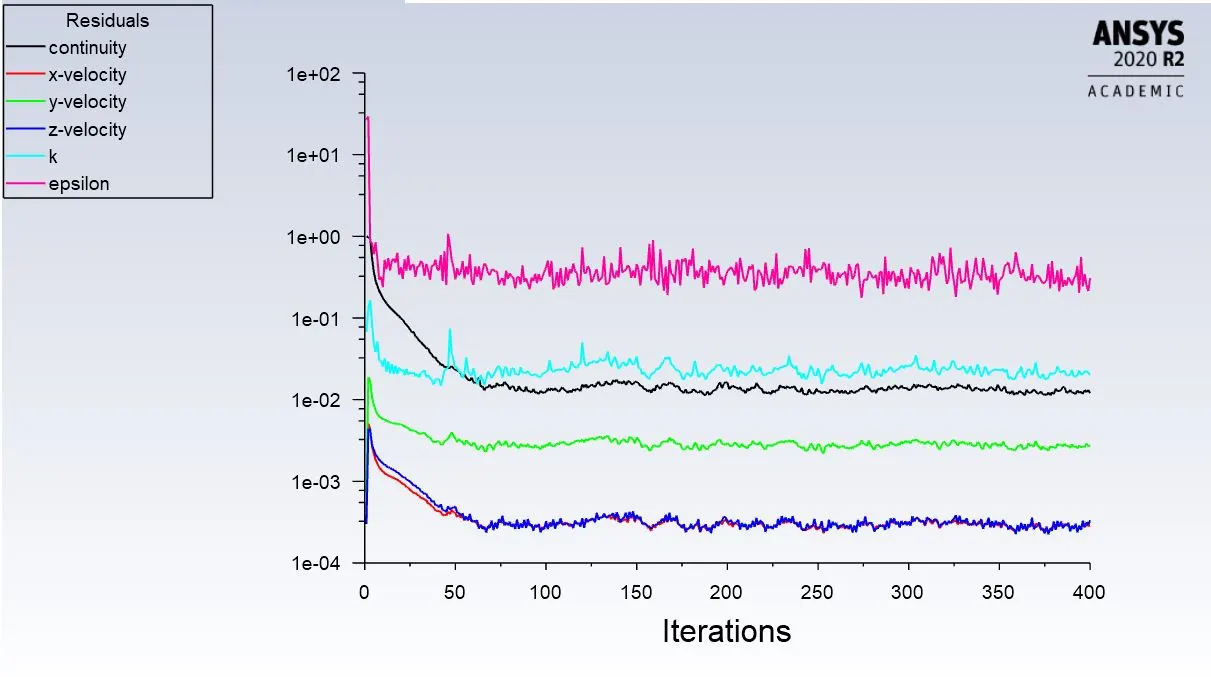
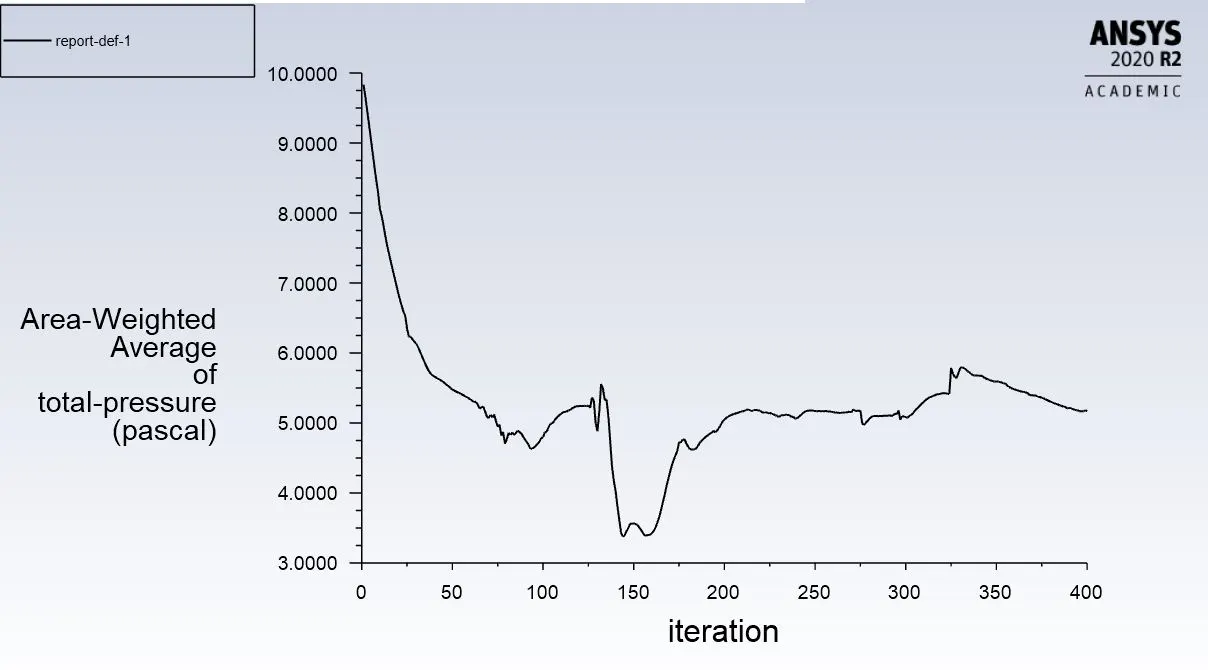
Iteration to converge
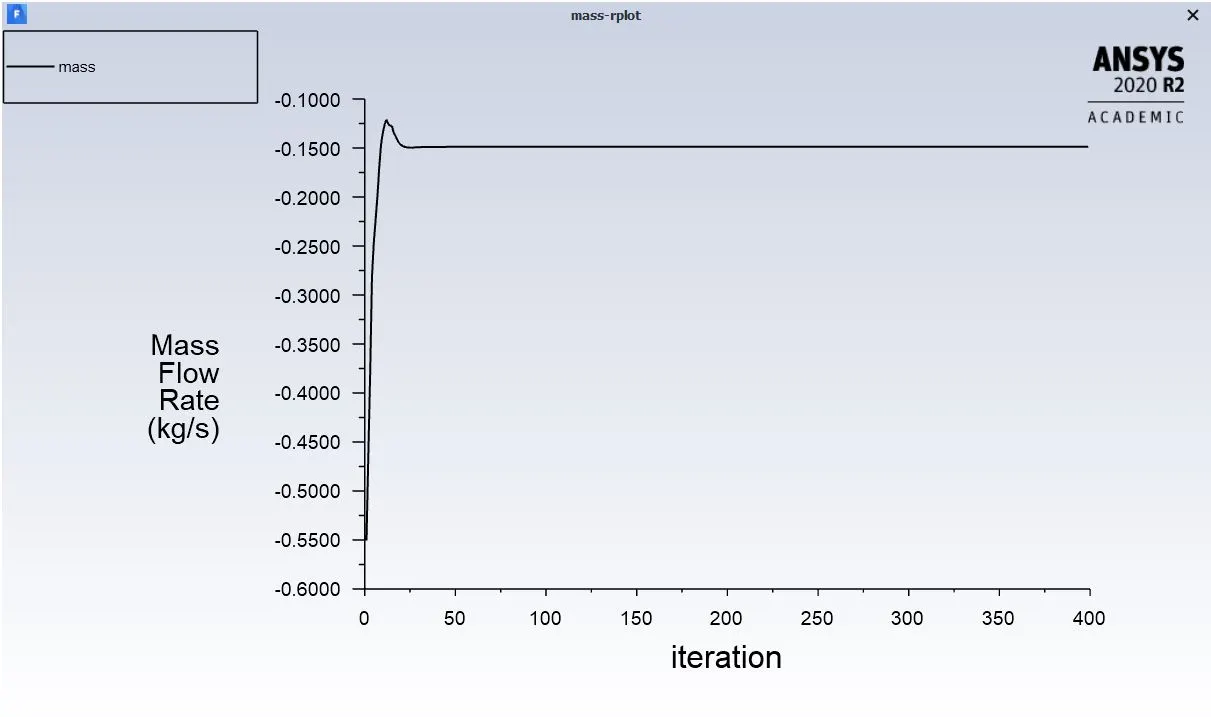
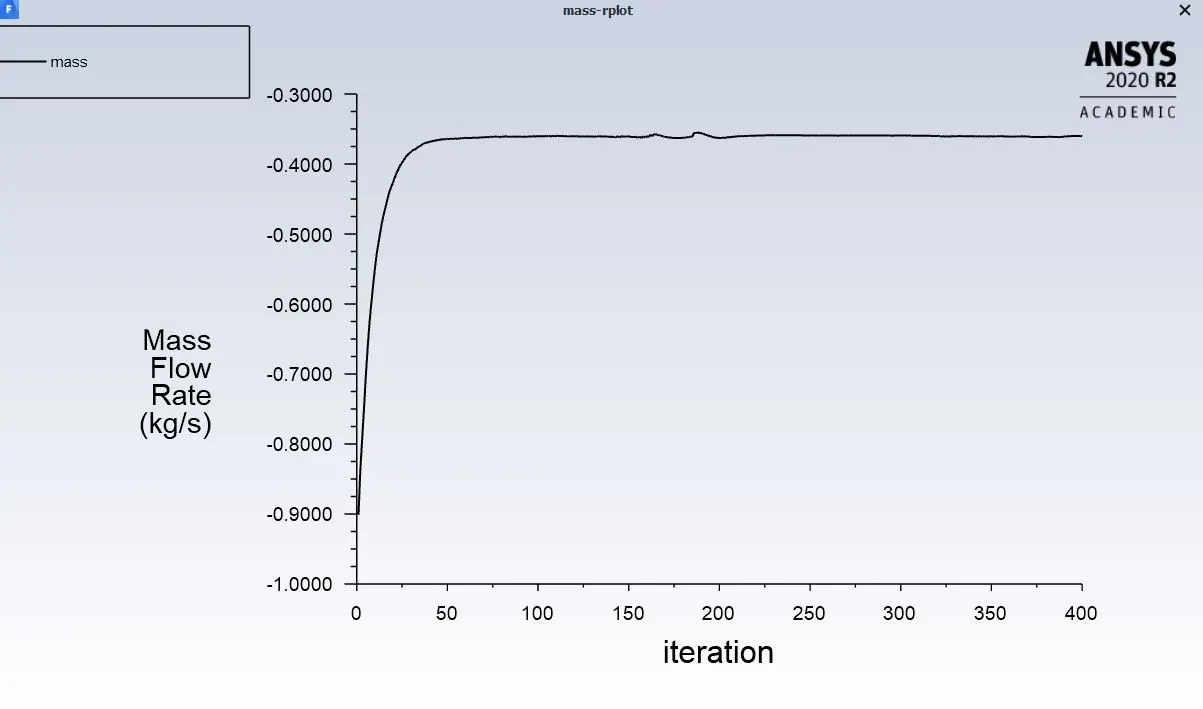
Mass flow rate
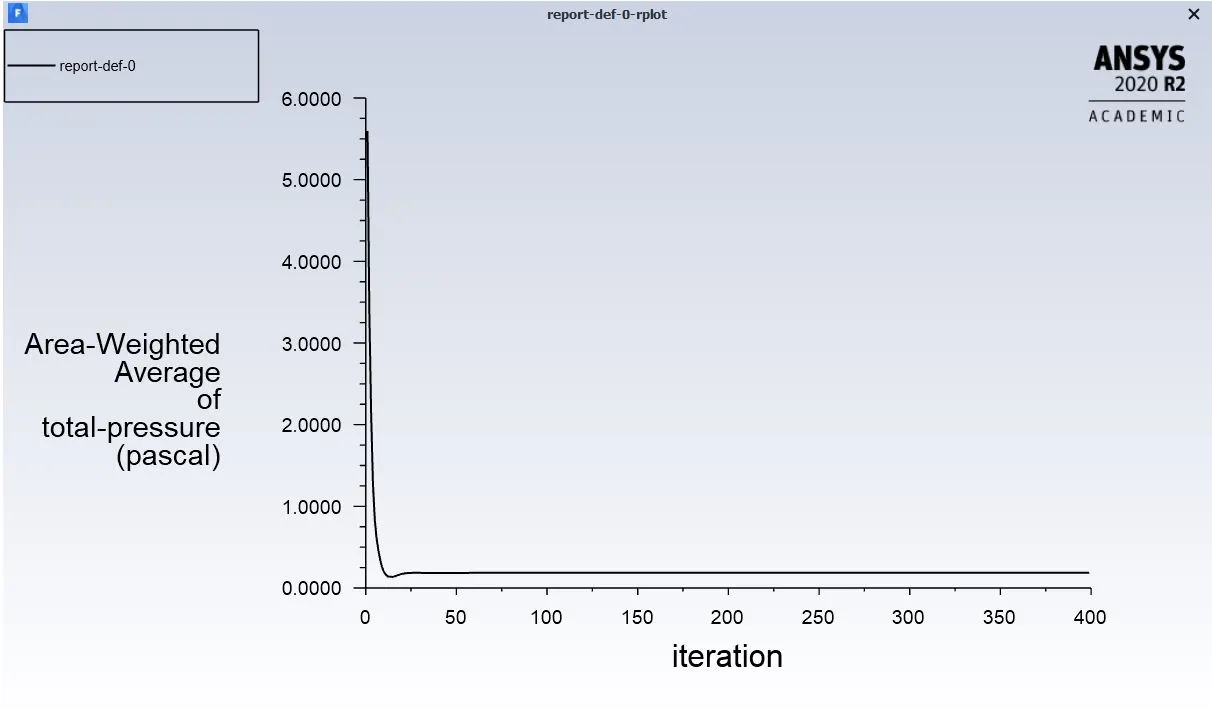
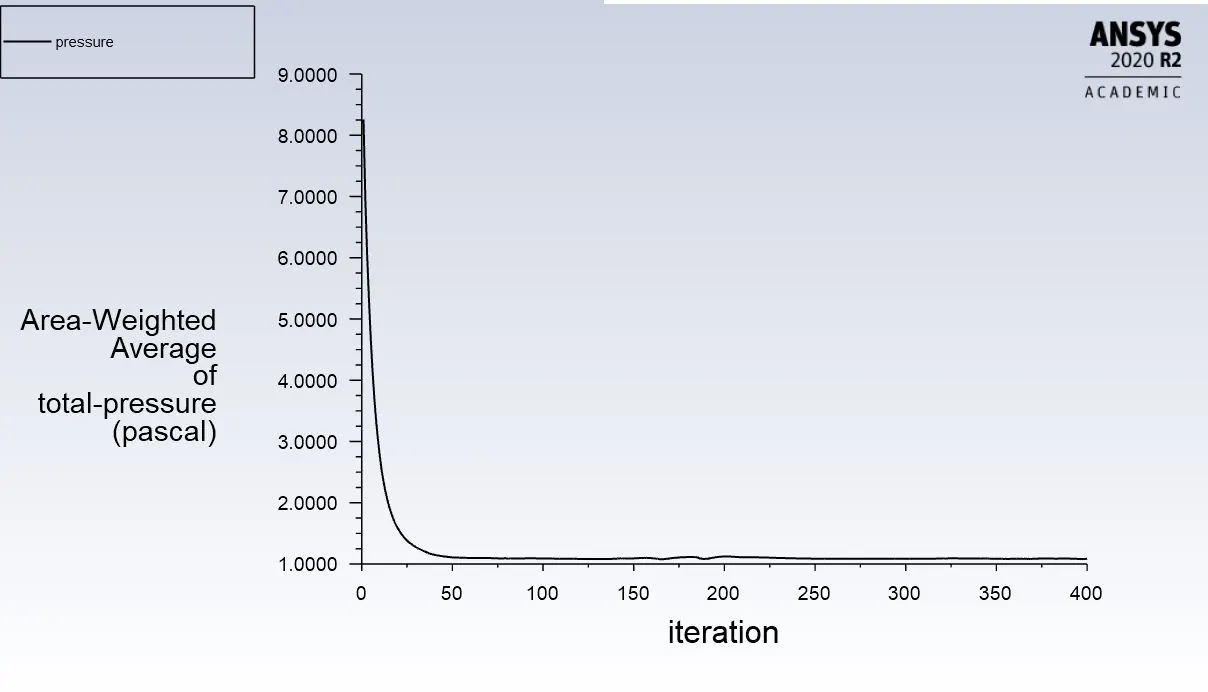
Pressure outlet
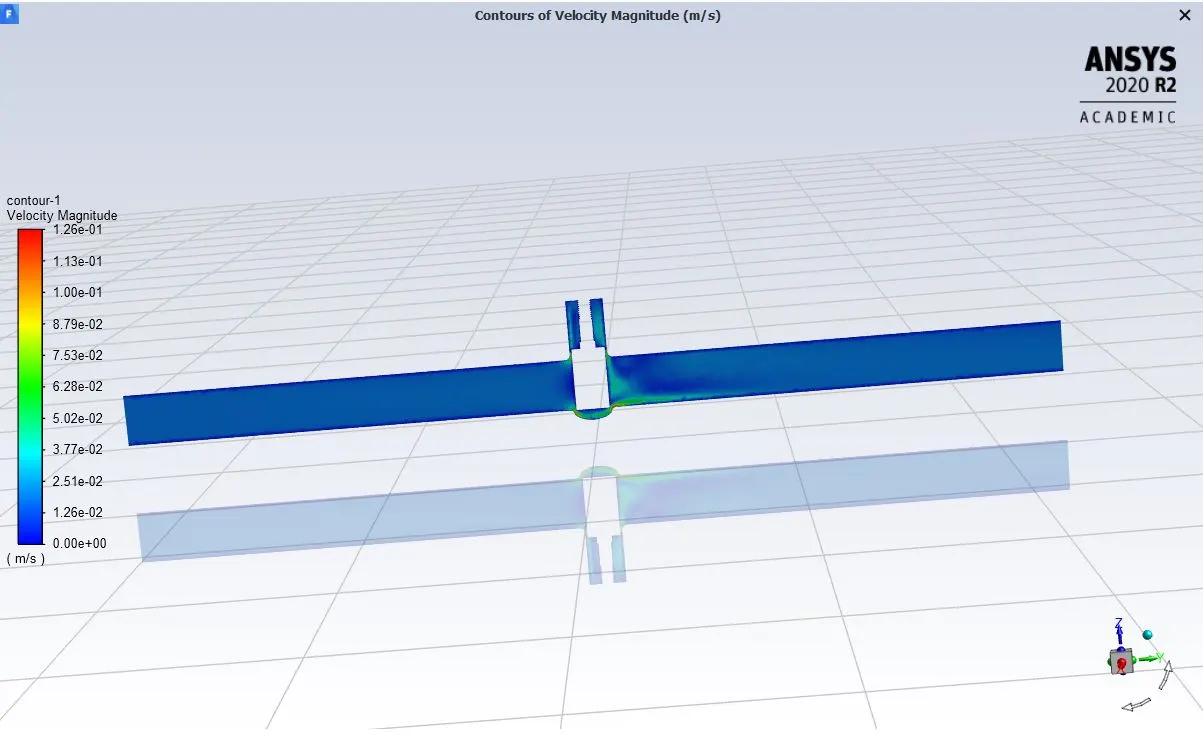
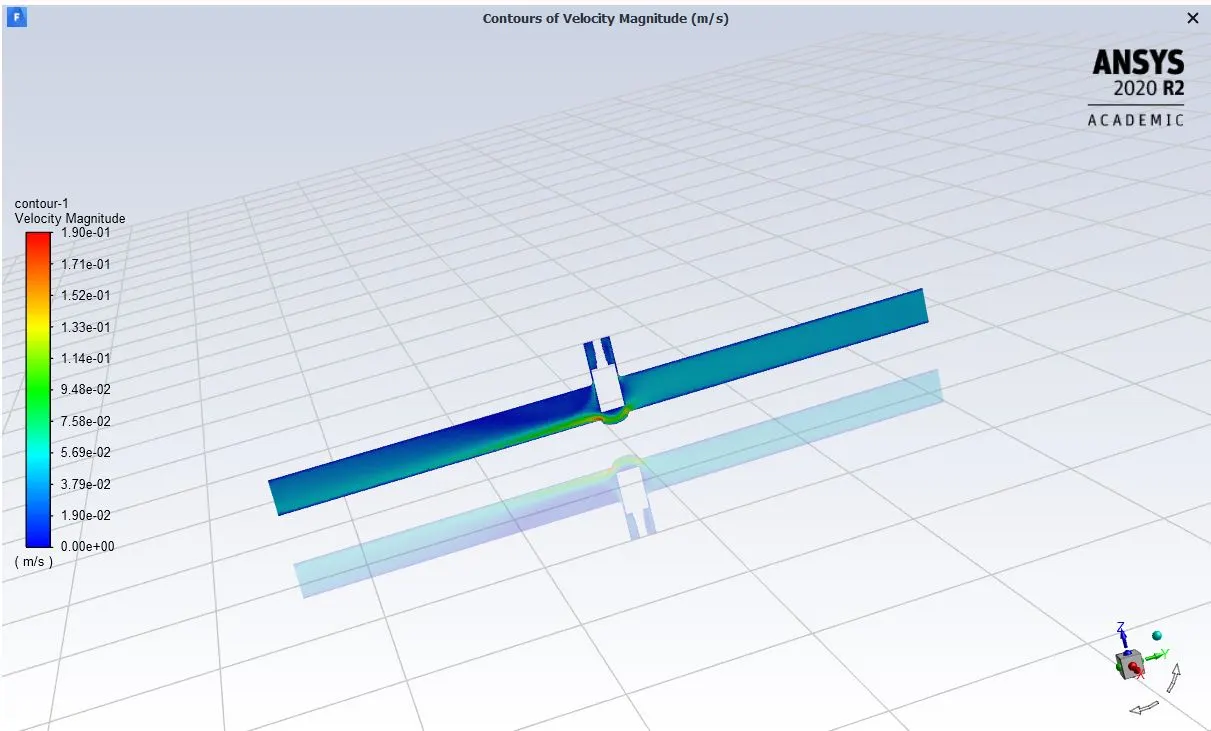
Post processing velocity contour images
- Design point 2:
Opening of gate disc: 20mm
Meshing
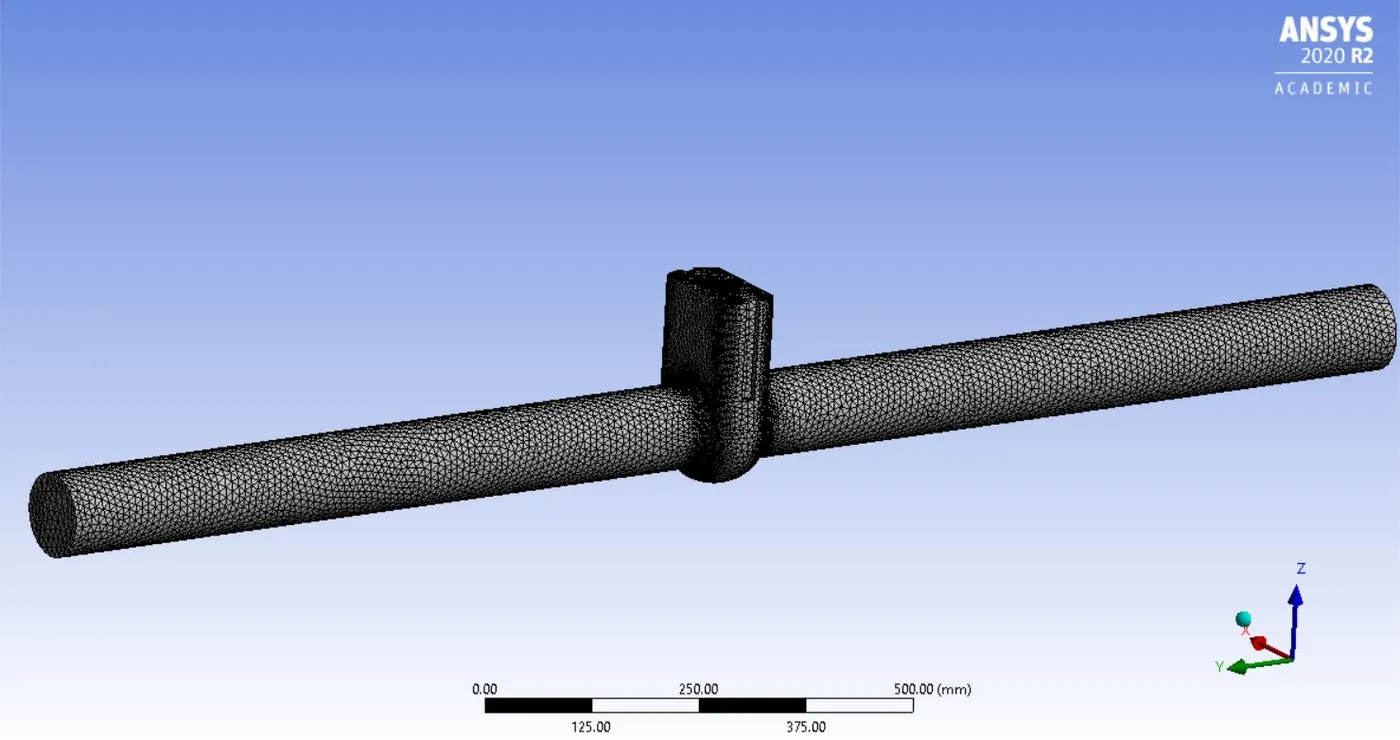
Mesh section view
Iteration to converge
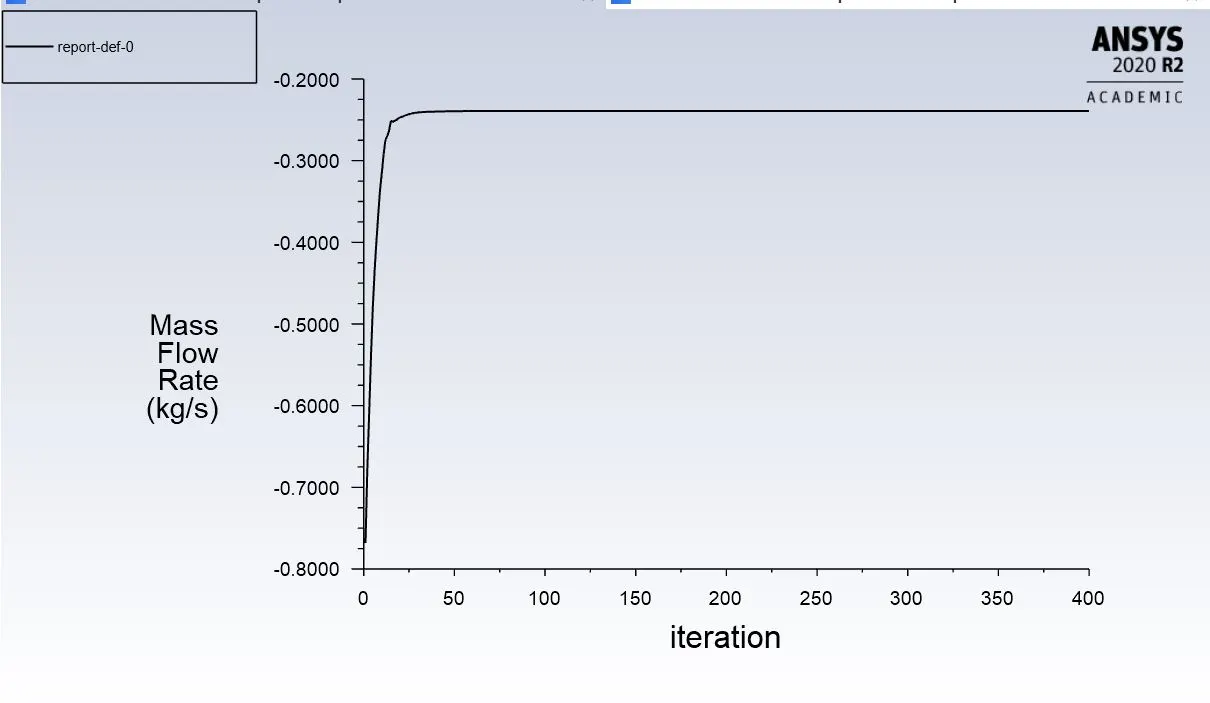
Mass flow rate
Pressure outlet
Post processing velocity contour images
- Design point 3:
Opening of gate disc: 30mm
Meshing
Mesh section view
Iteration to converge
Mass flow rate
Pressure outlet
Post processing velocity contour images
- Design point 4:
Opening of gate disc: 40mm
Meshing
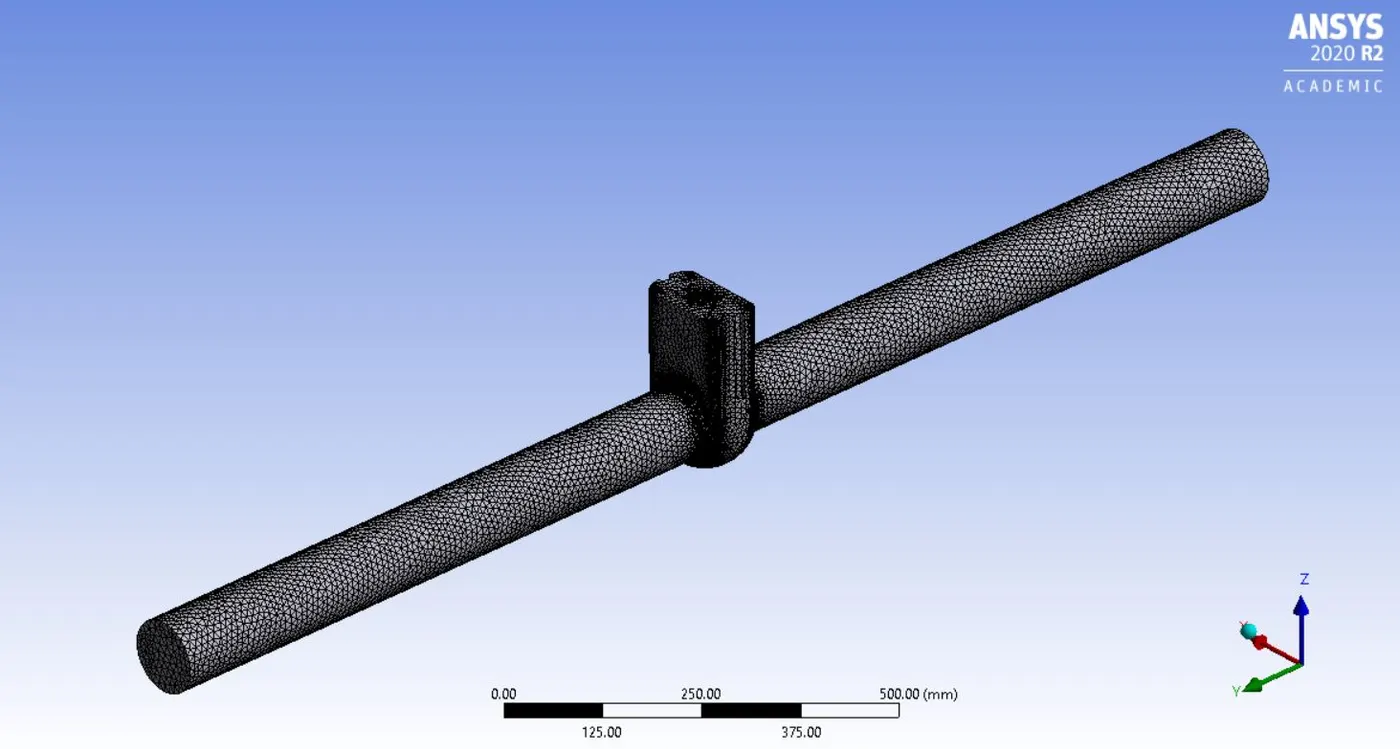
Mesh section view
Iteration to converge
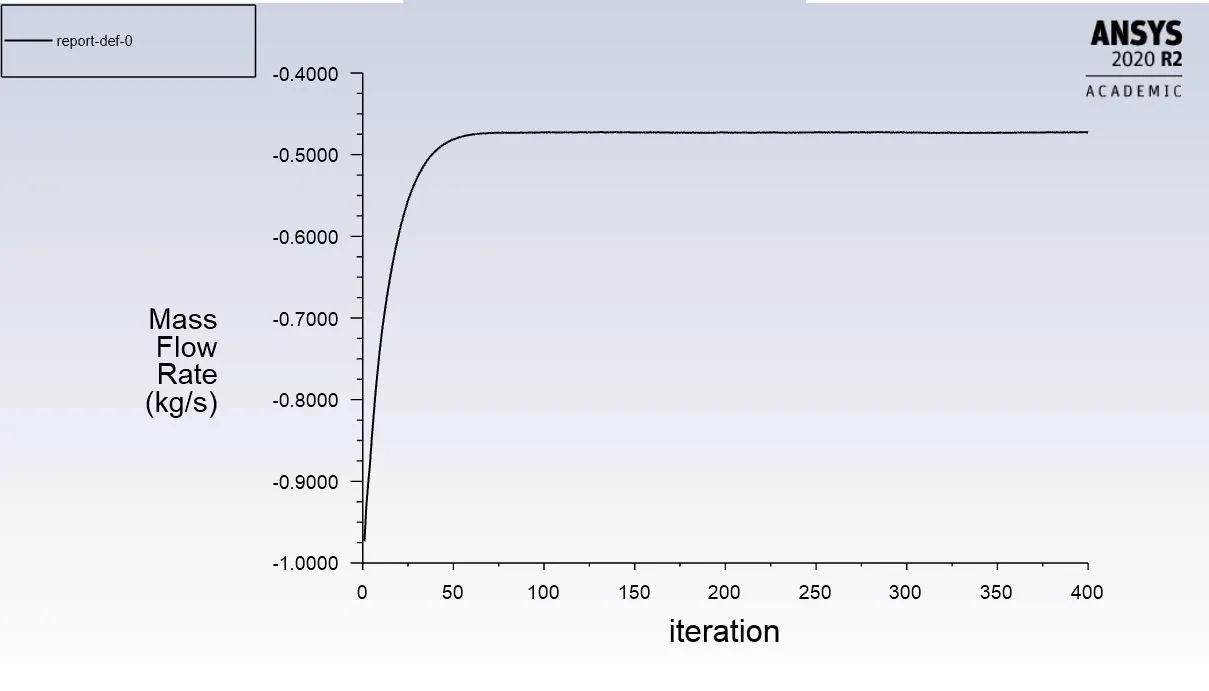
Mass flow rate
Pressure outlet
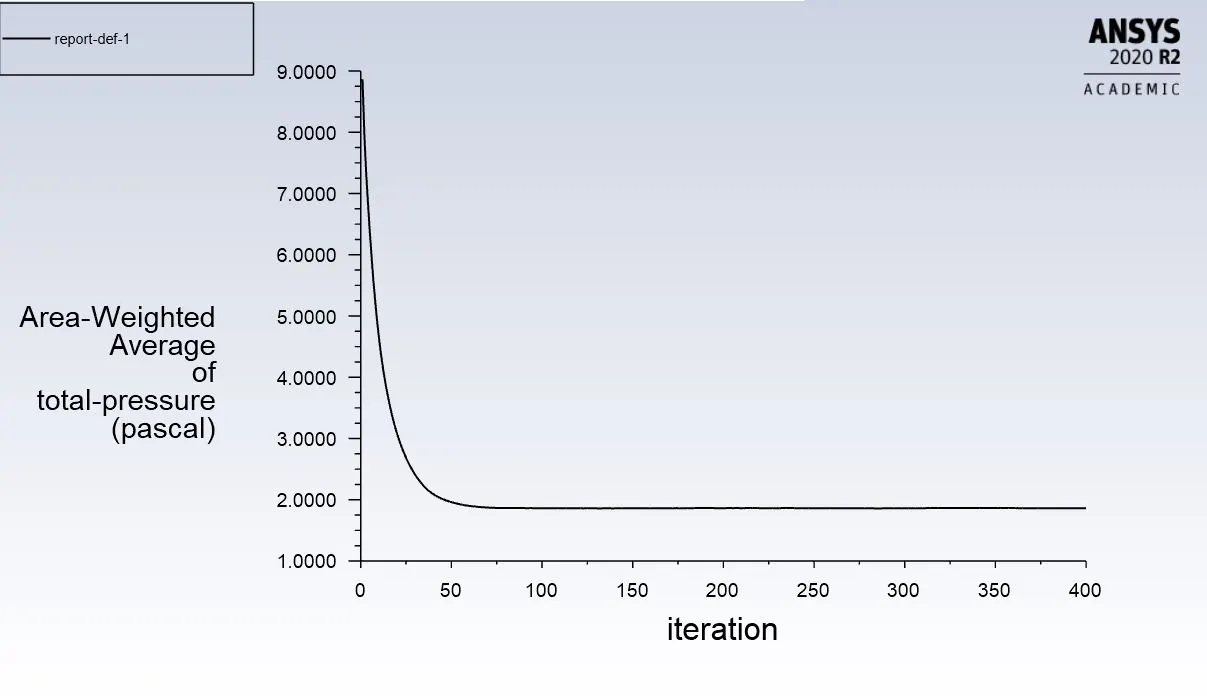
Post processing velocity contour images
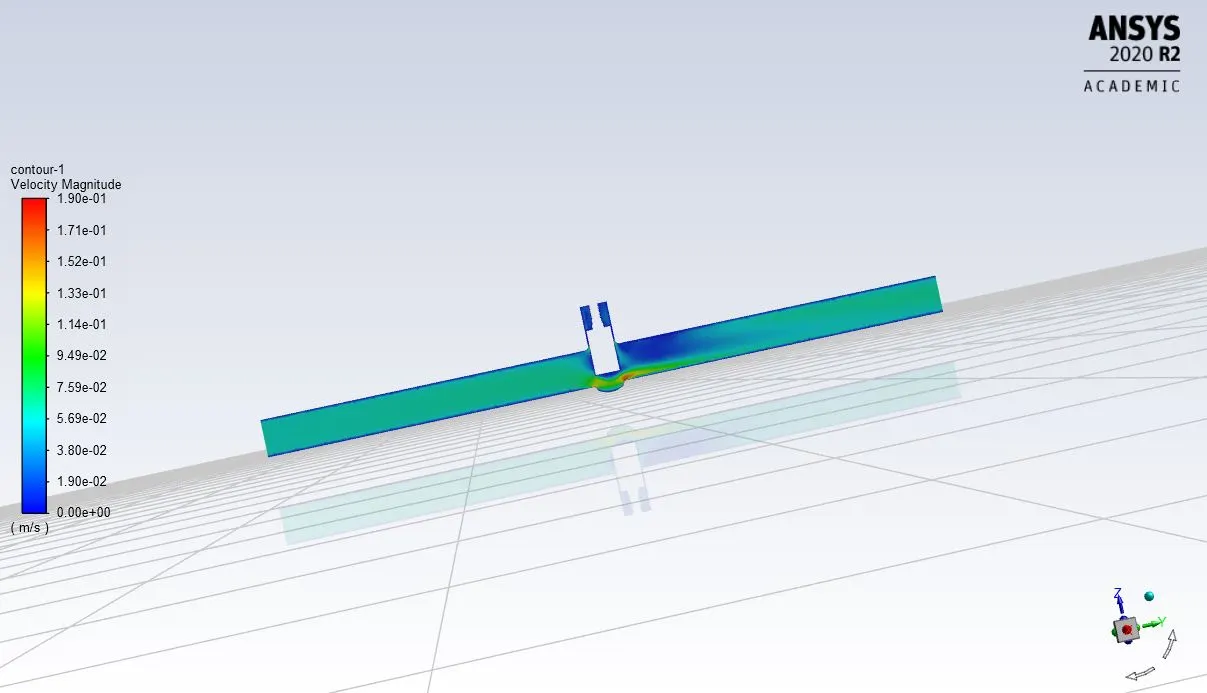
- Design point 5:
Opening of gate disc: 50mm
Meshing
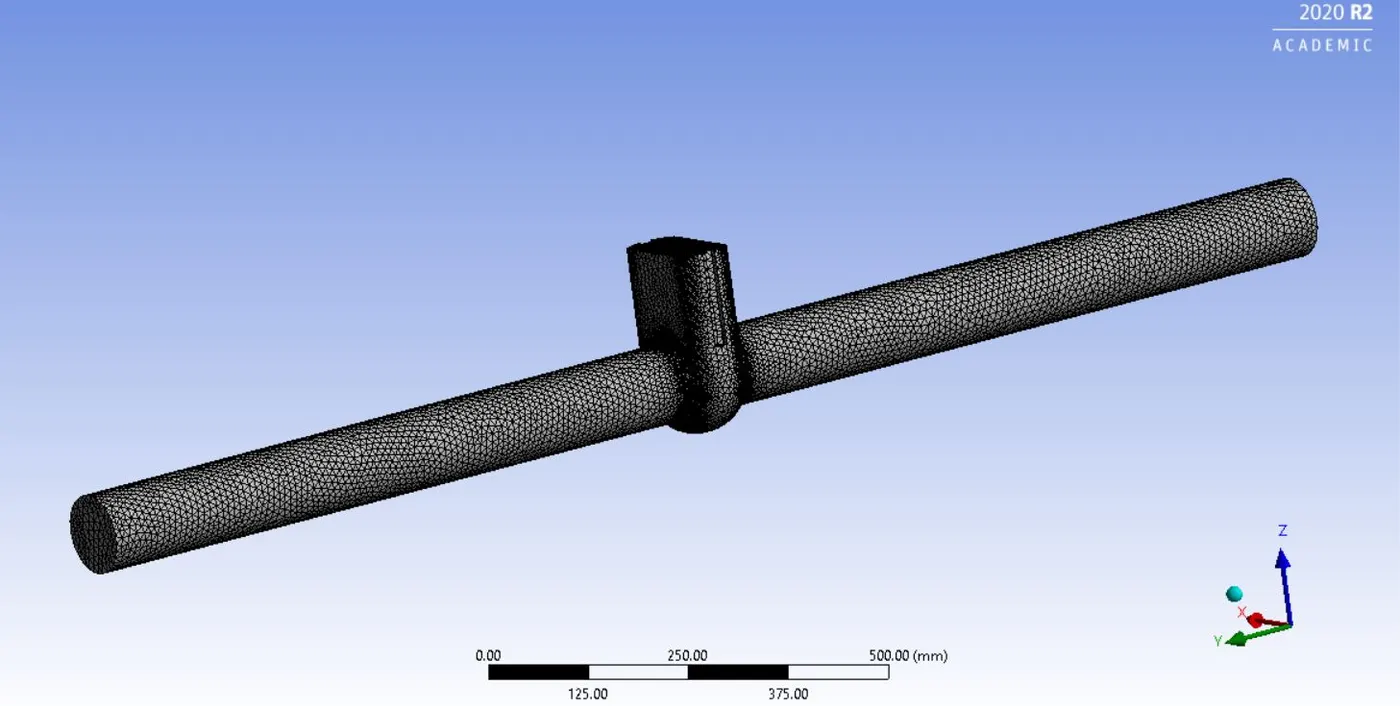
Mesh section view
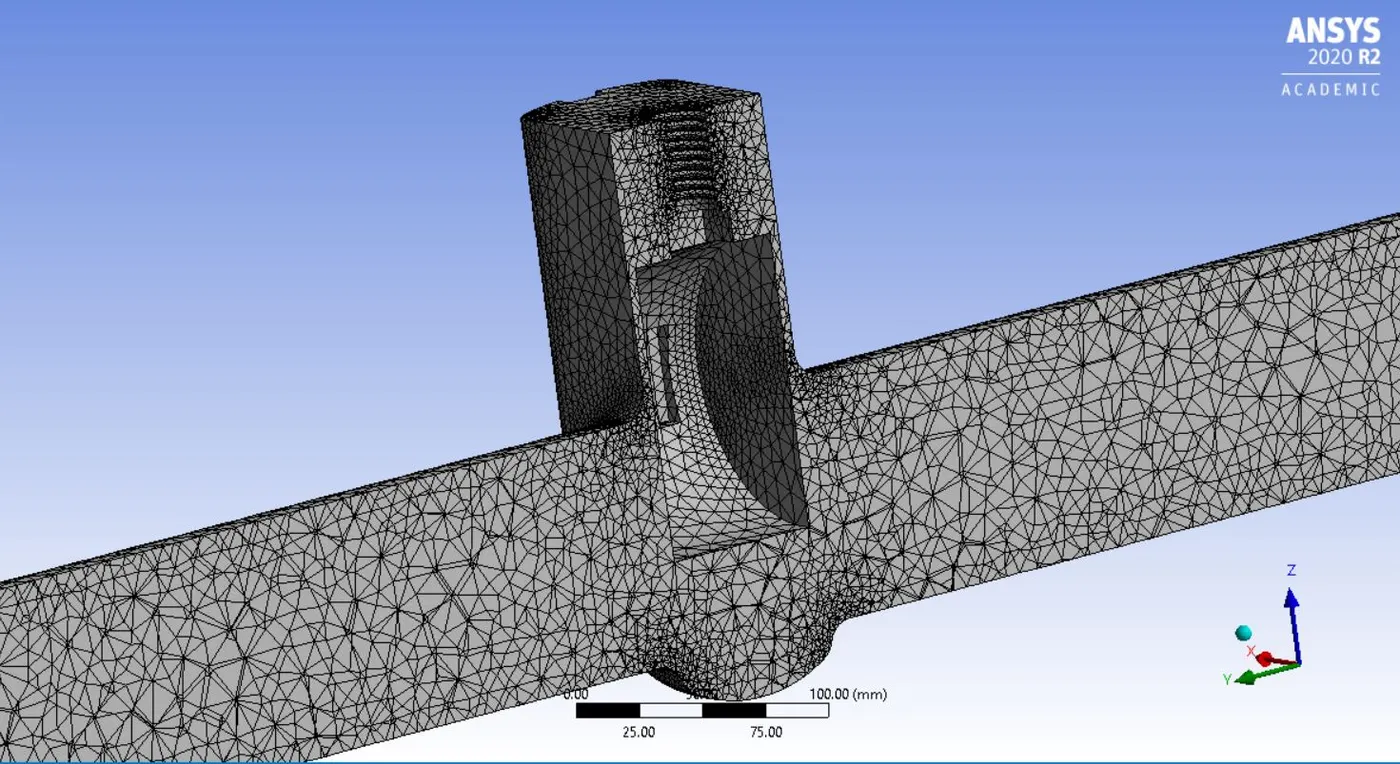
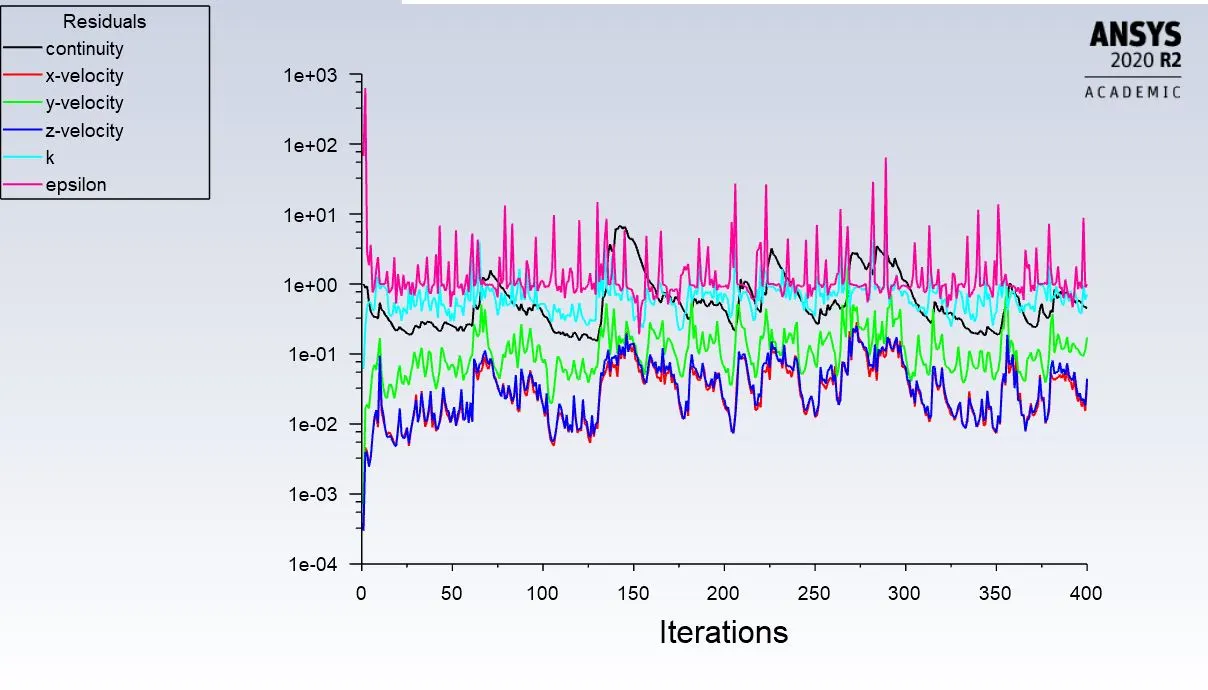
Iteration to converge
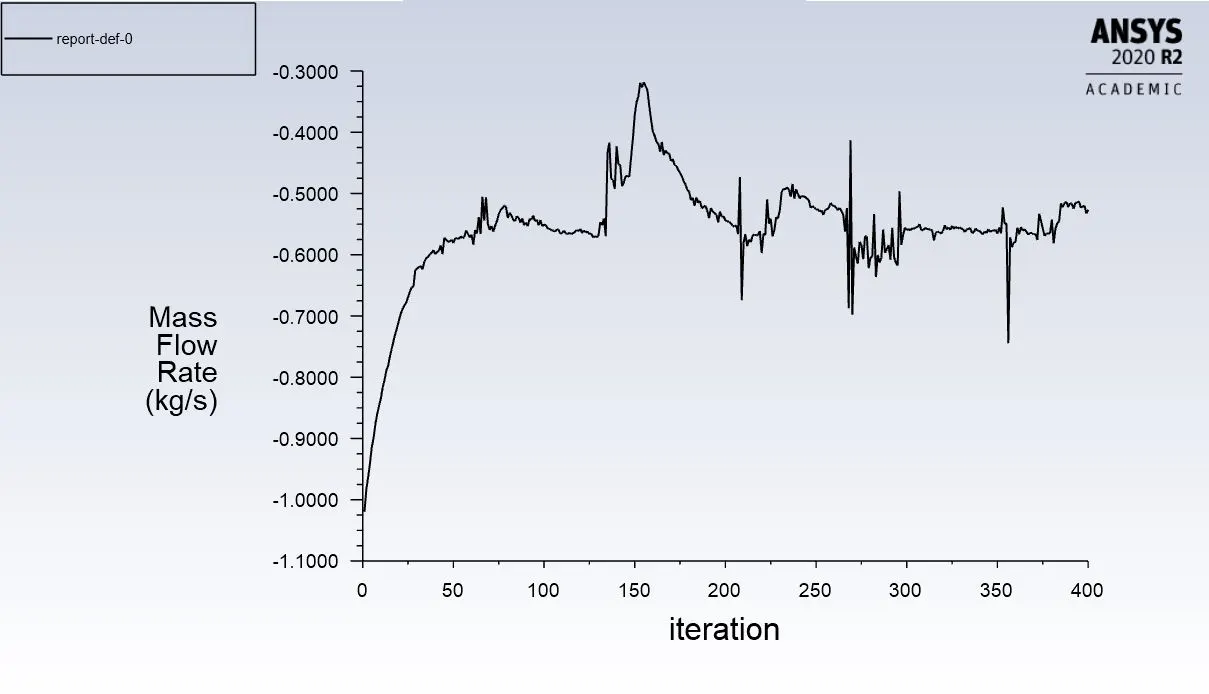
Mass flow rate
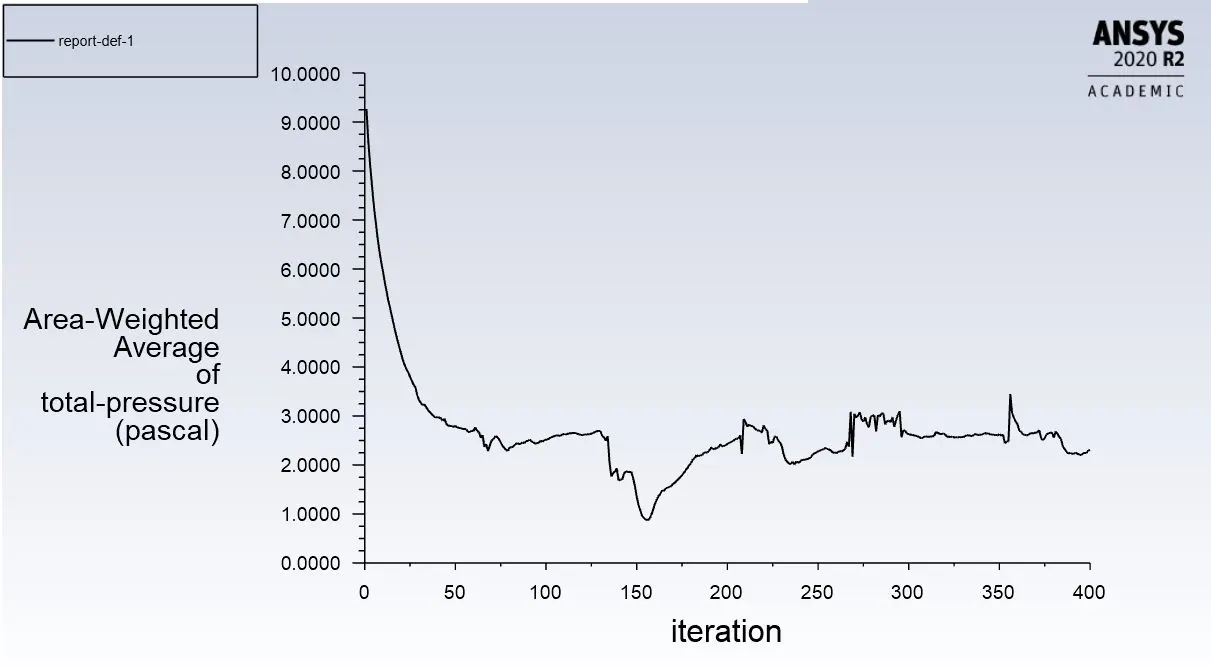
Pressure outlet
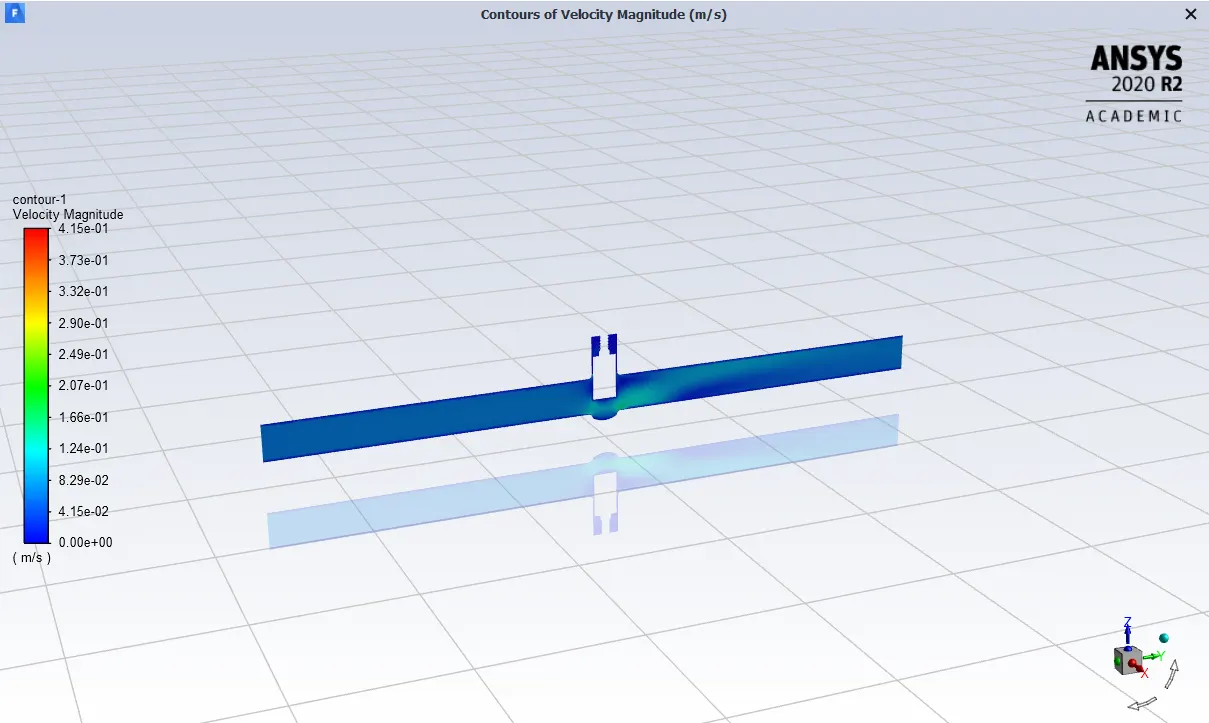
Post processing velocity contour images
- Design point 6:
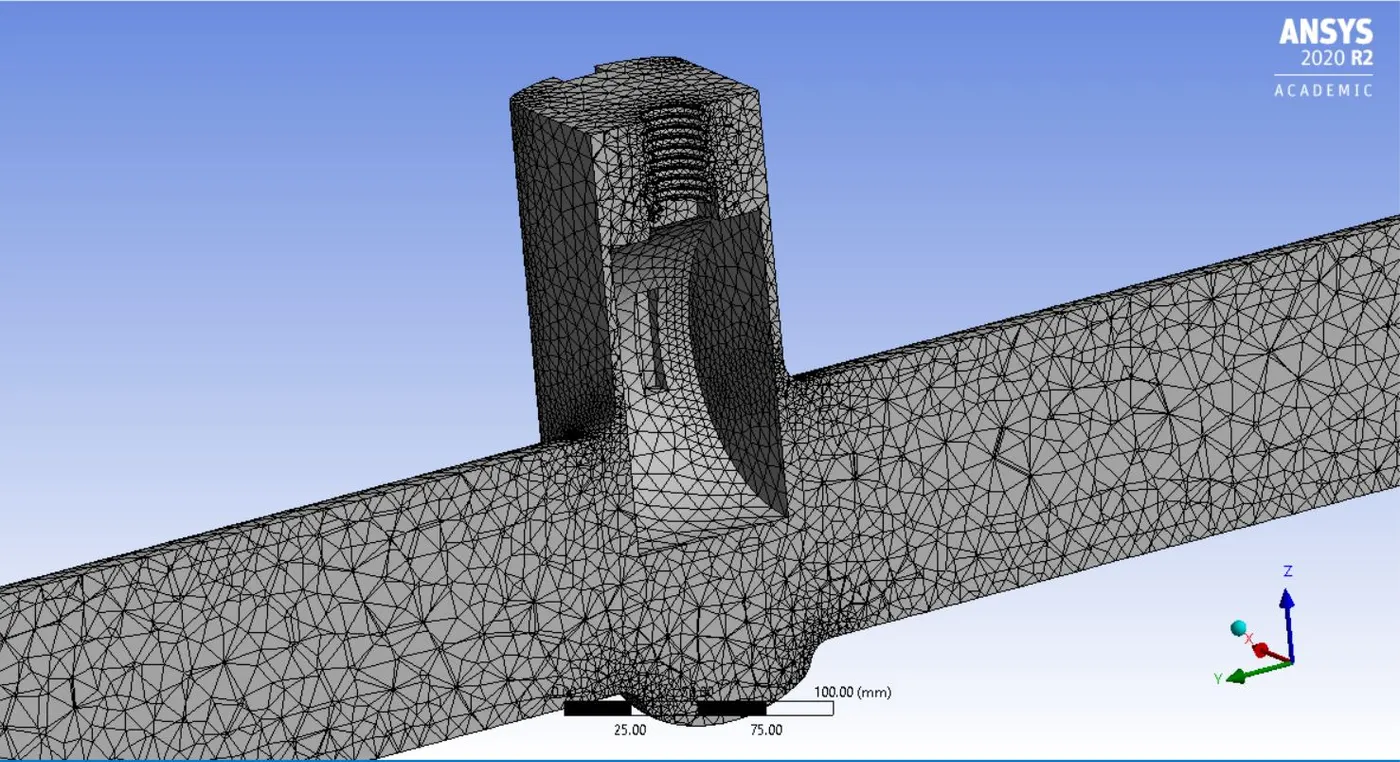
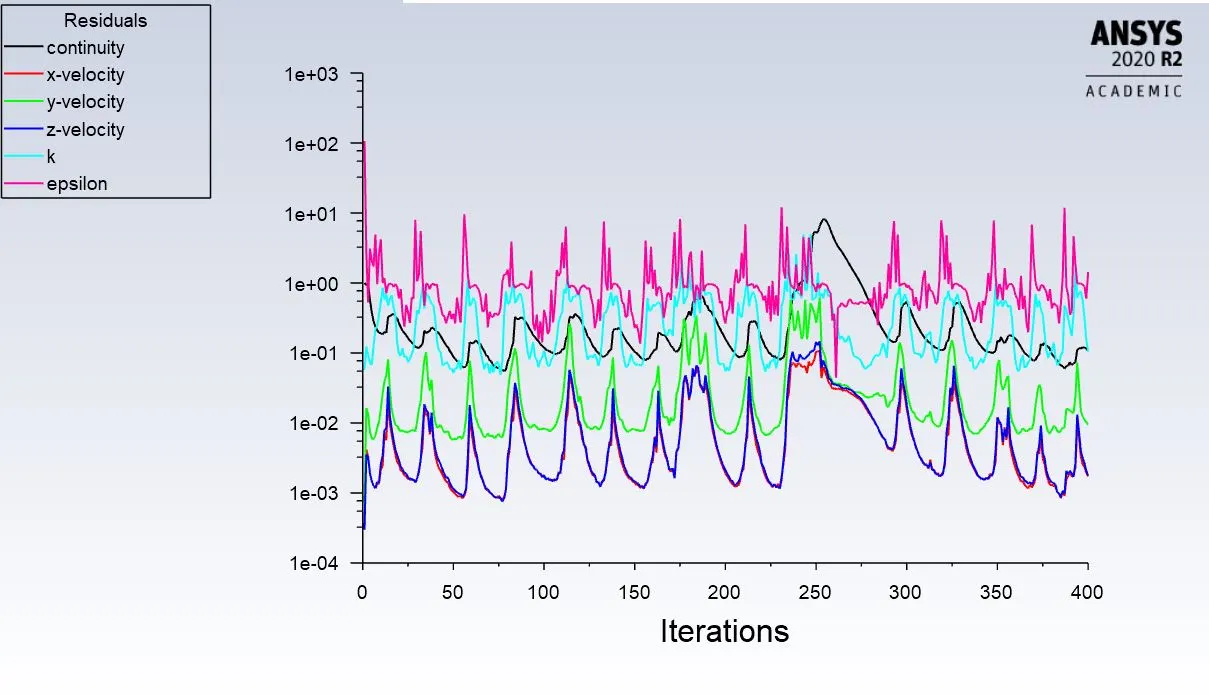
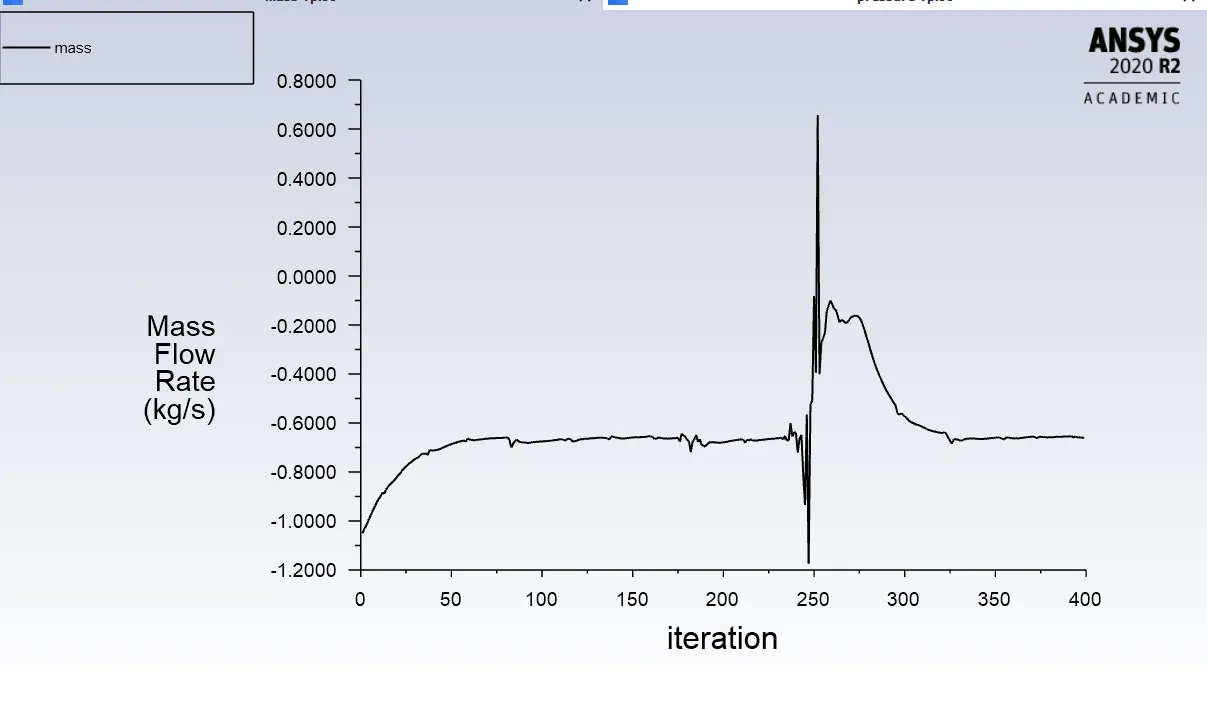
Opening of gate disc: 60mm
Meshing
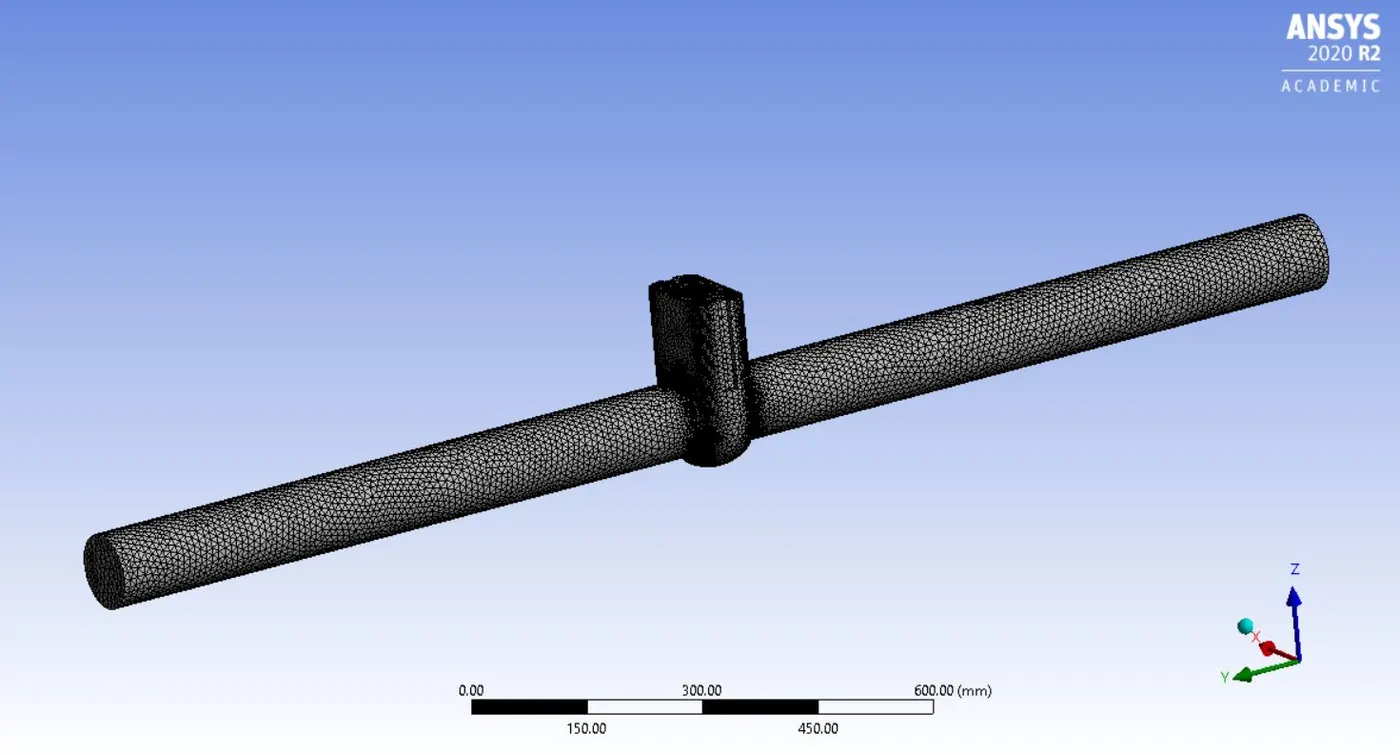
Mesh section view
Iteration to converge
Mass flow rate
Pressure outlet
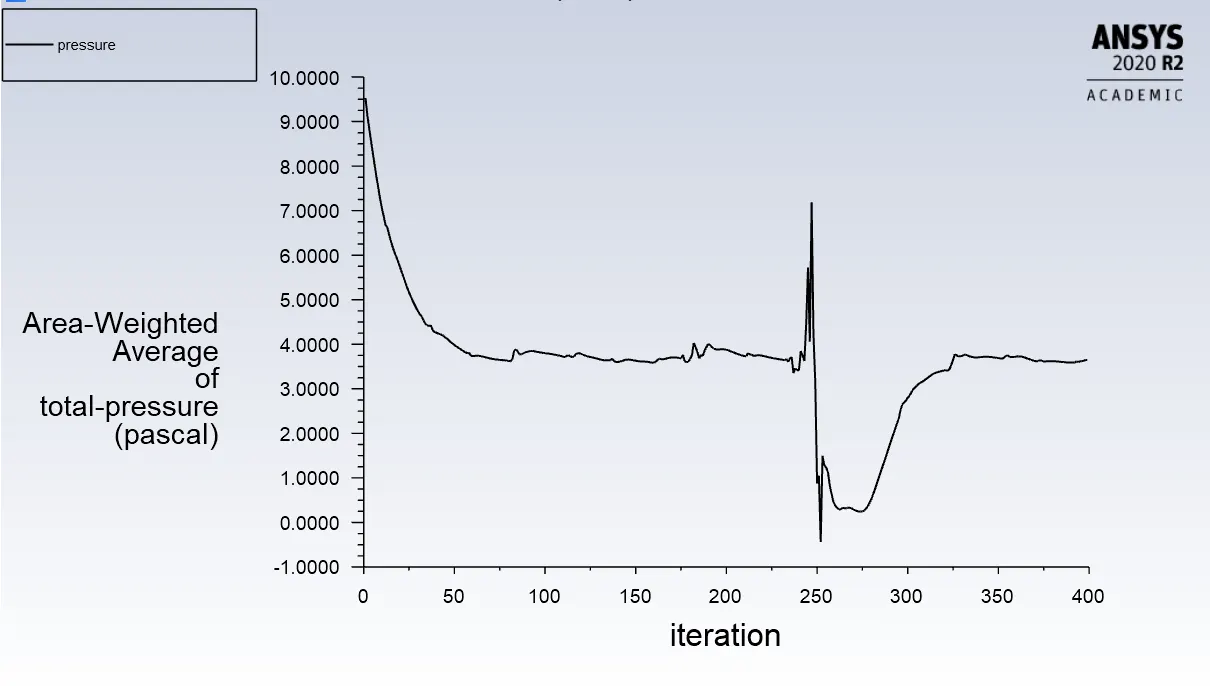
Post processing velocity contour images
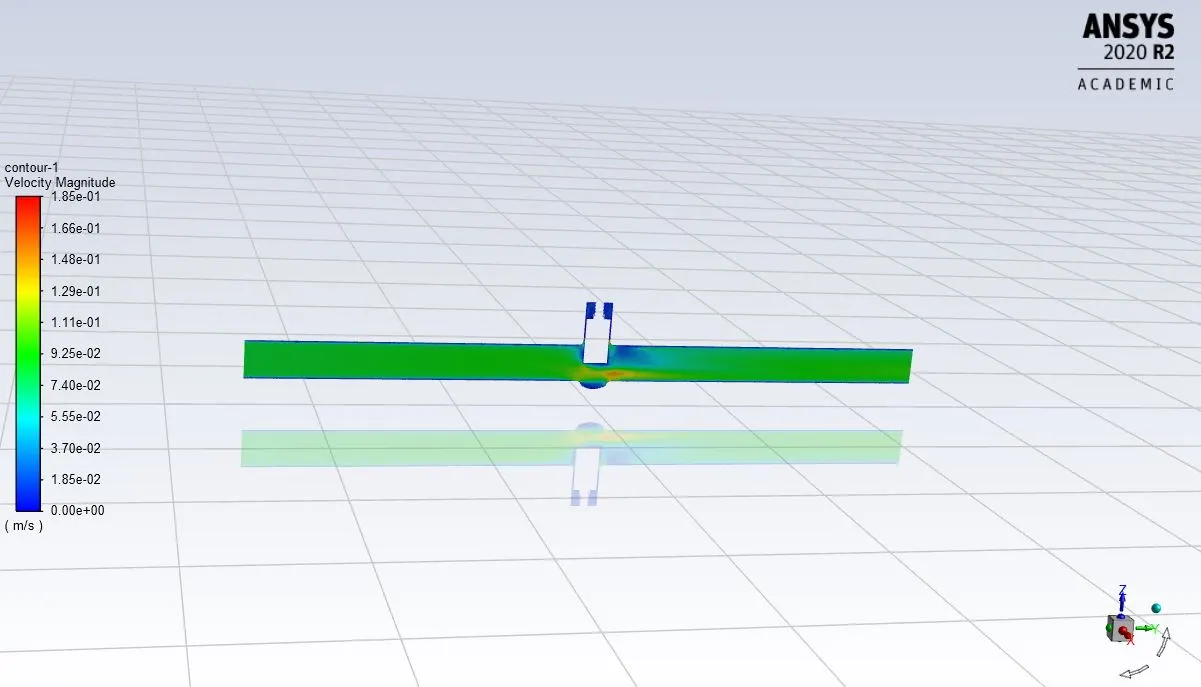
- Design point 7:
Opening of gate disc: 70mm
Meshing
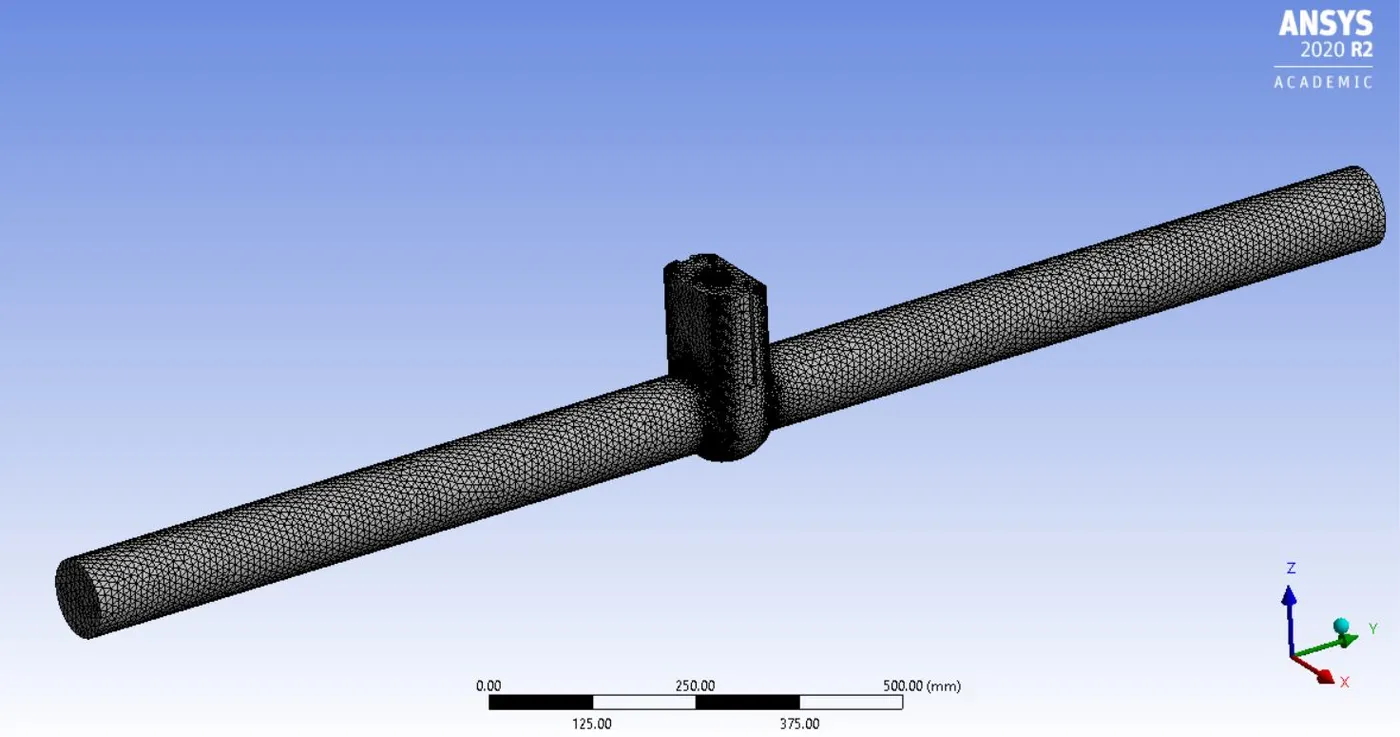
Mesh section view
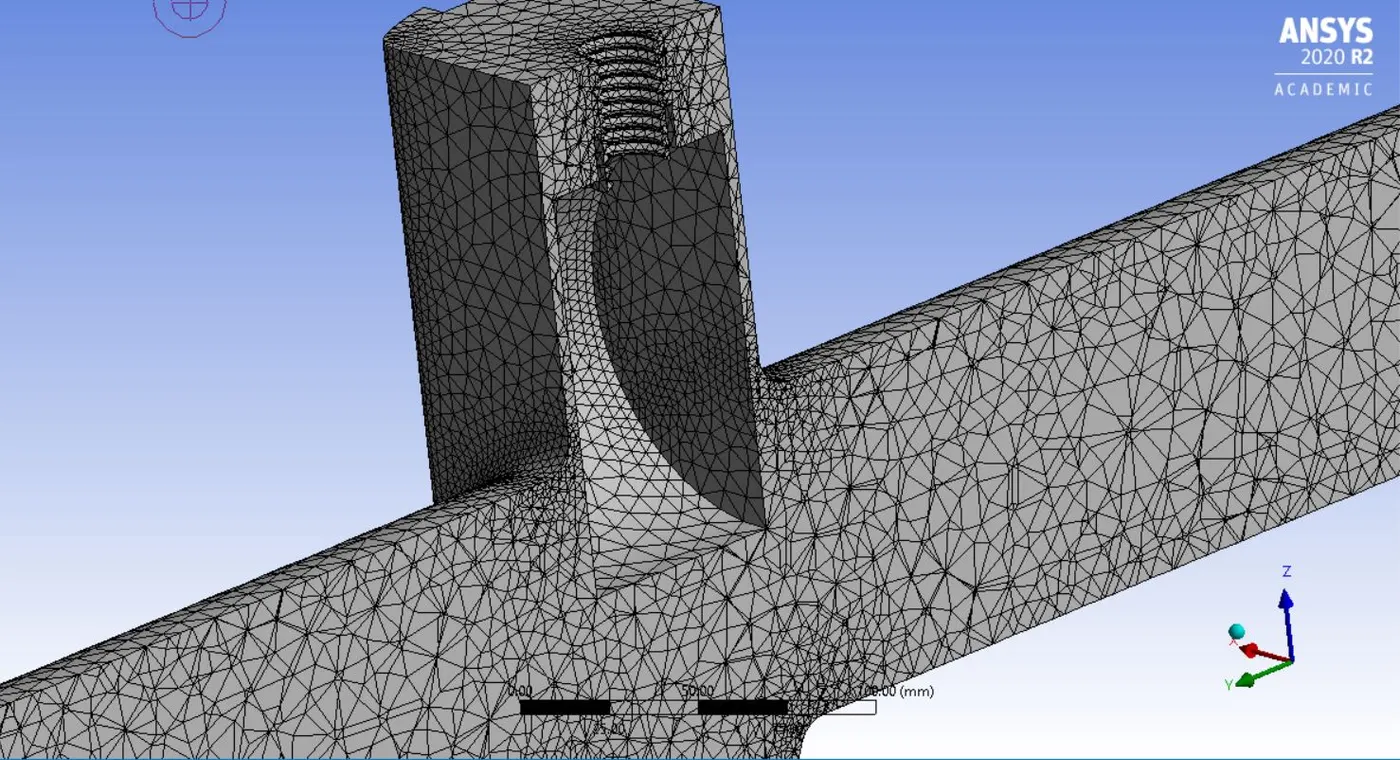
Iteration to converge
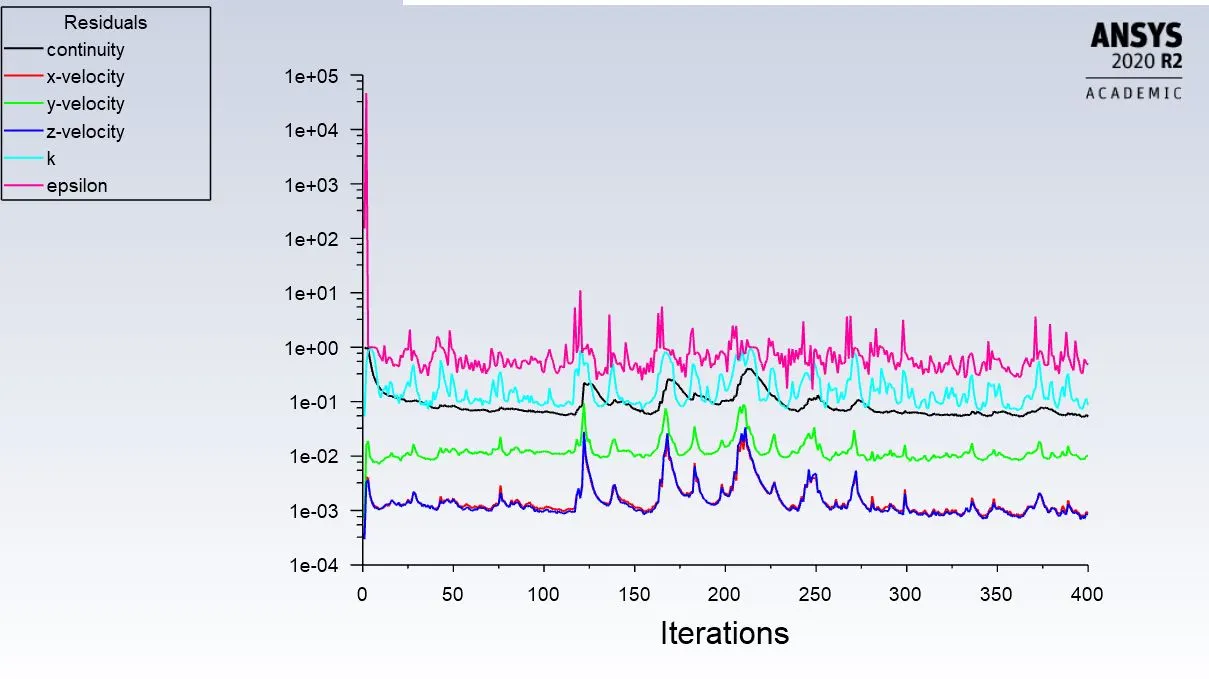
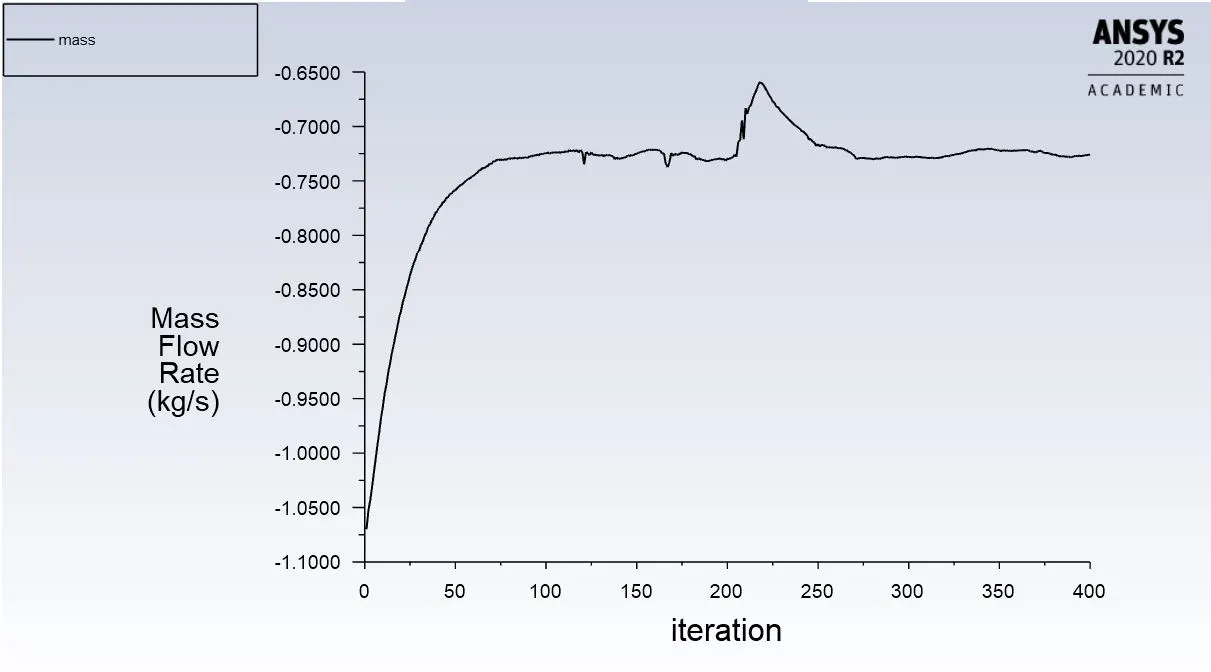
Mass flow rate
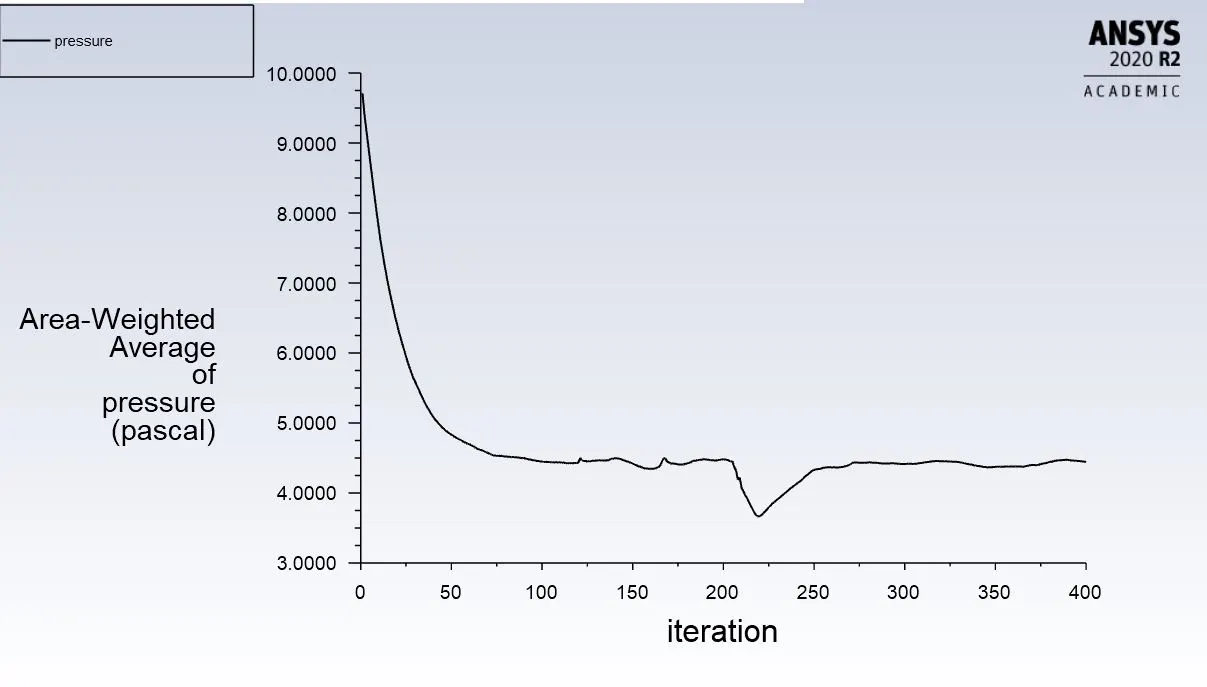
Pressure outlet
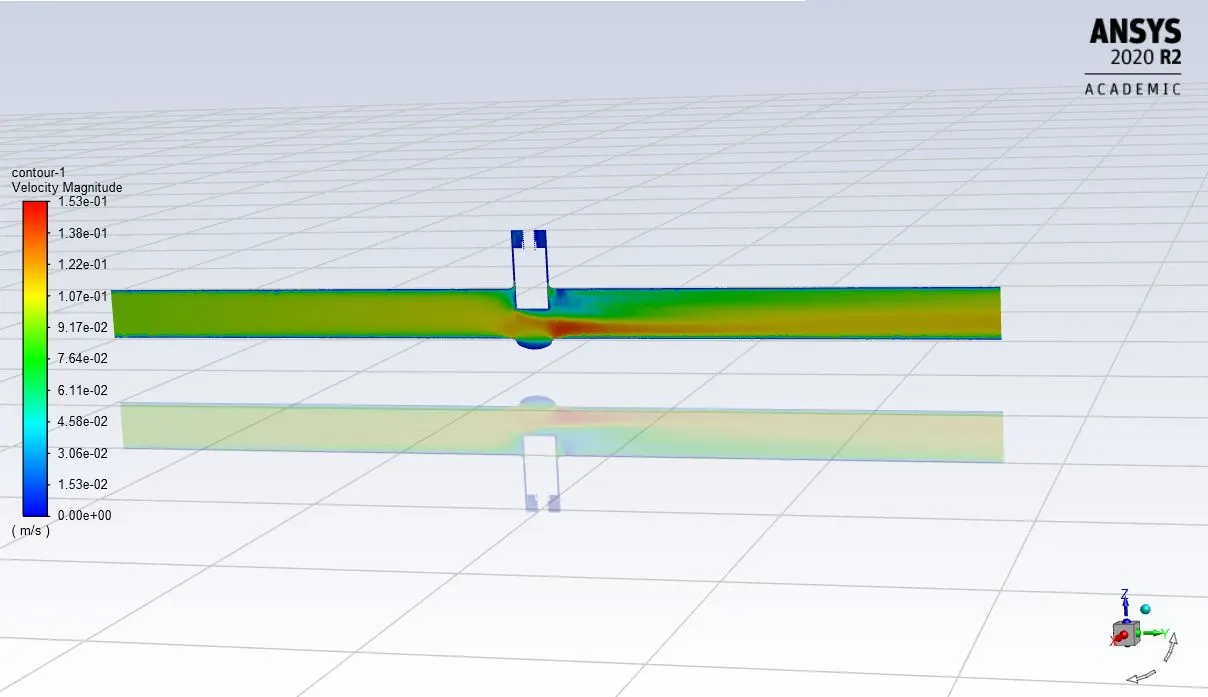
Post processing velocity contour images
- Design point 8:
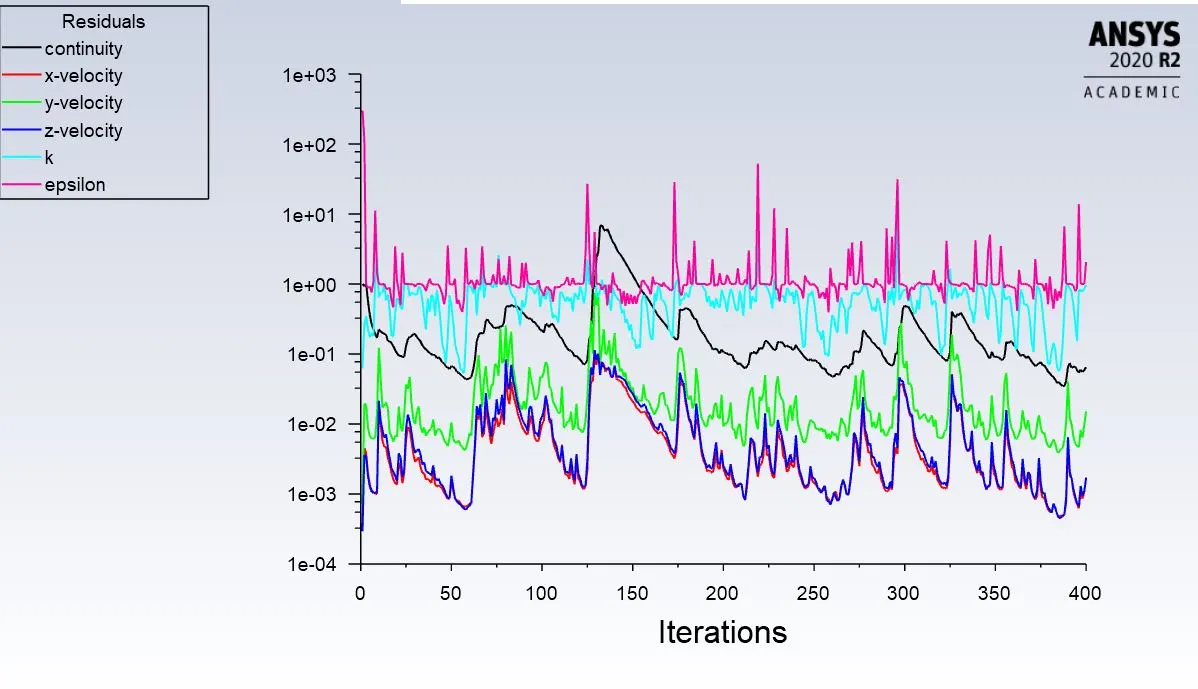
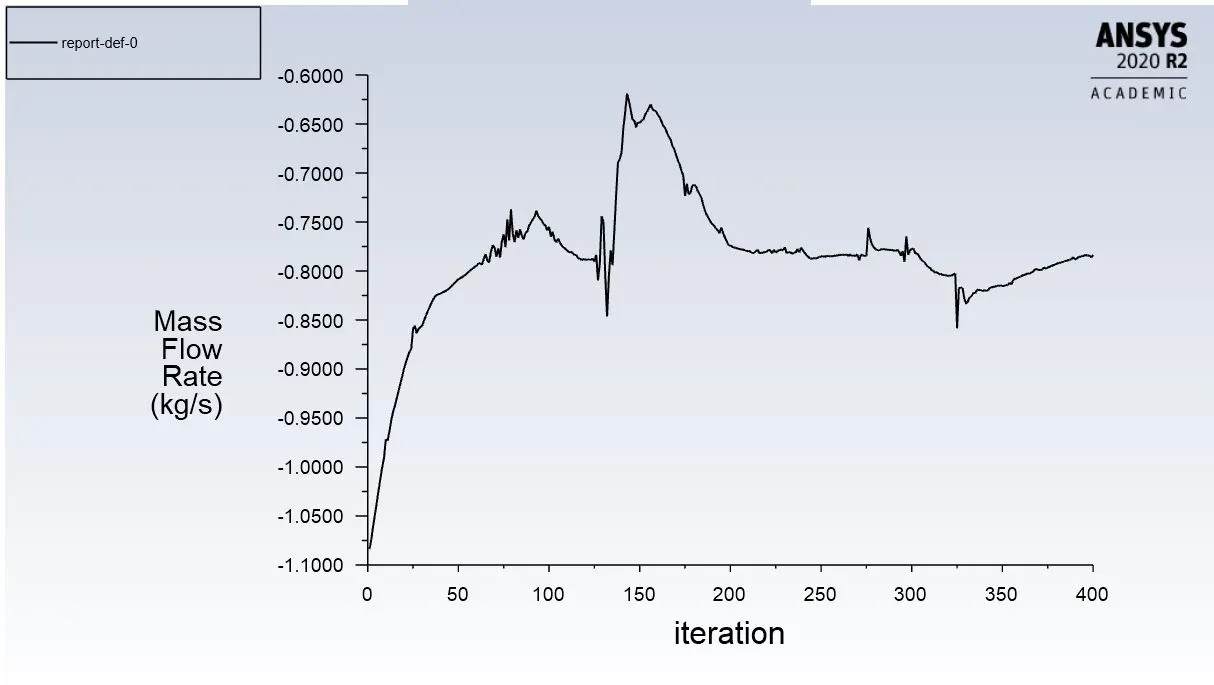
Opening of gate disc: 80mm
Meshing
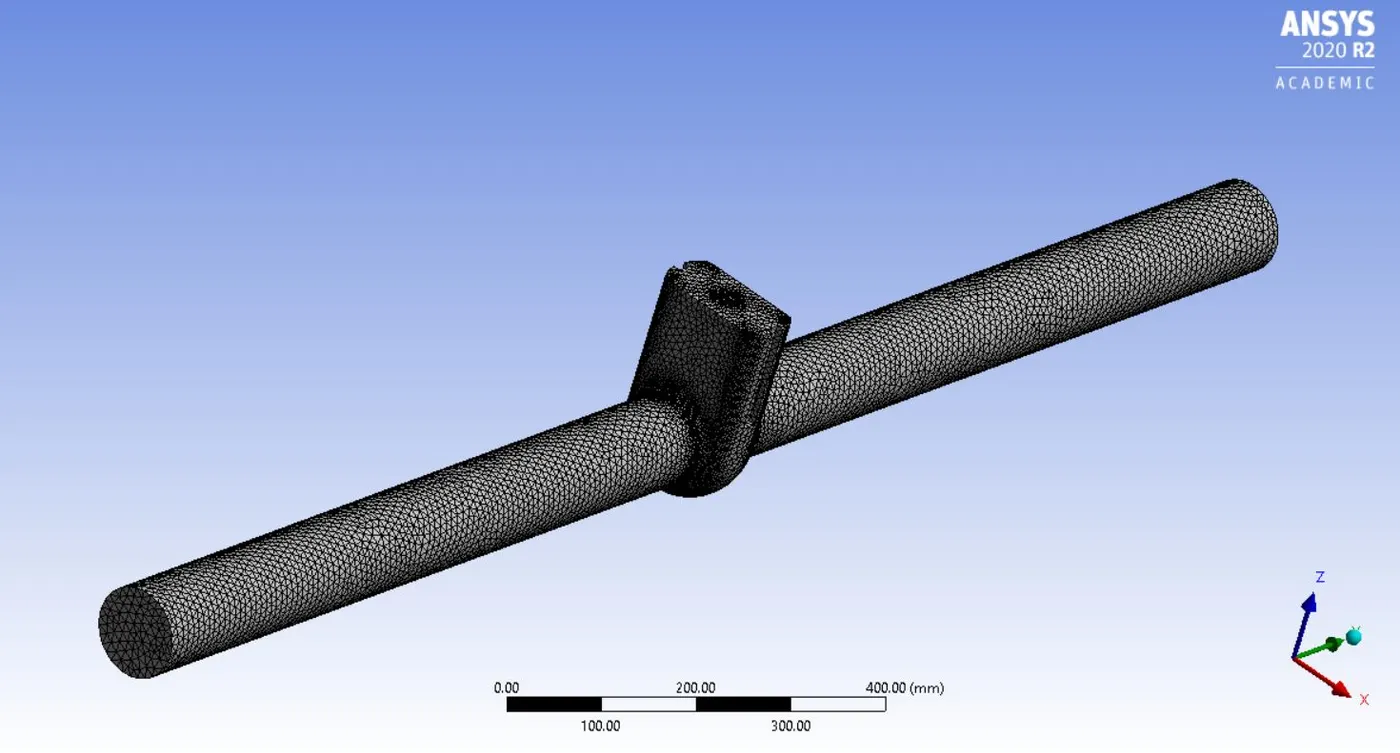
Mesh section view
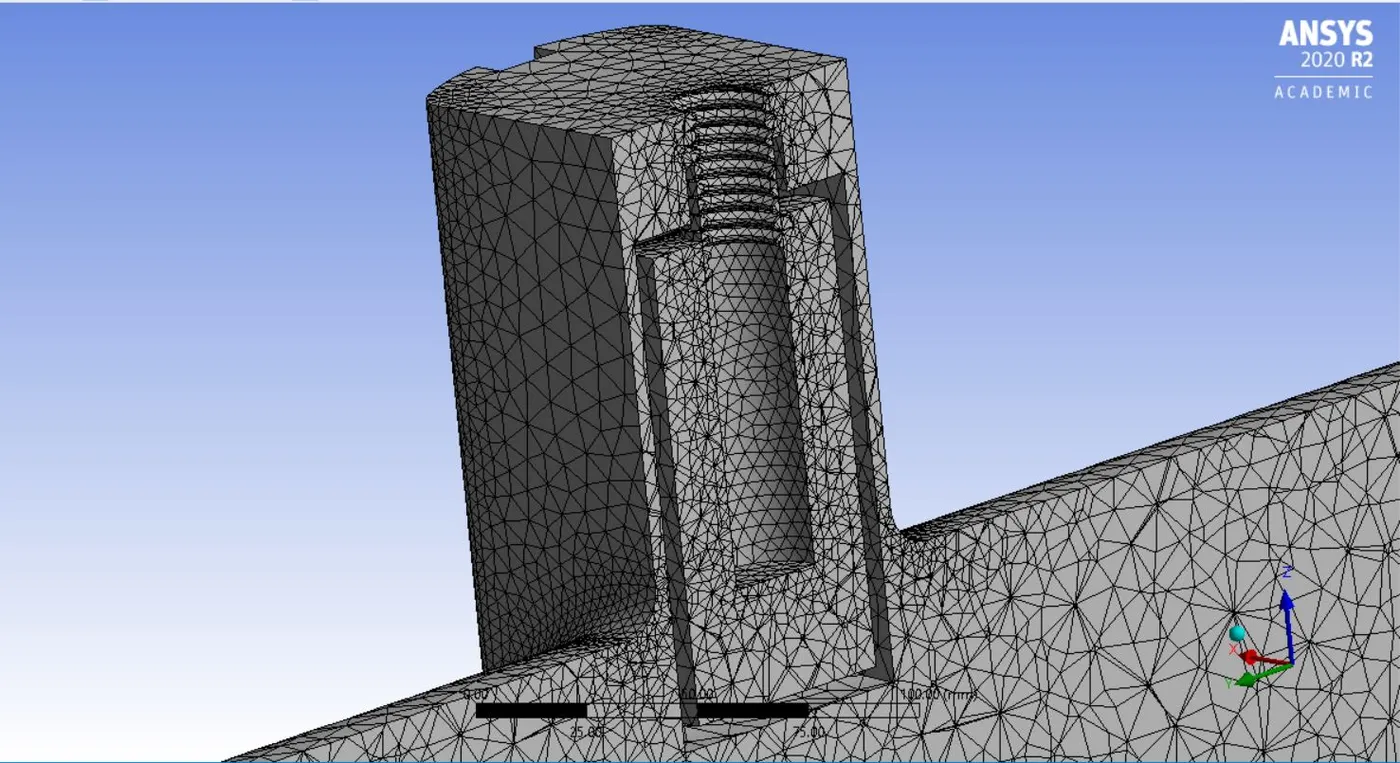
Iteration to converge
Mass flow rate
Pressure outlet
Post processing velocity contour images
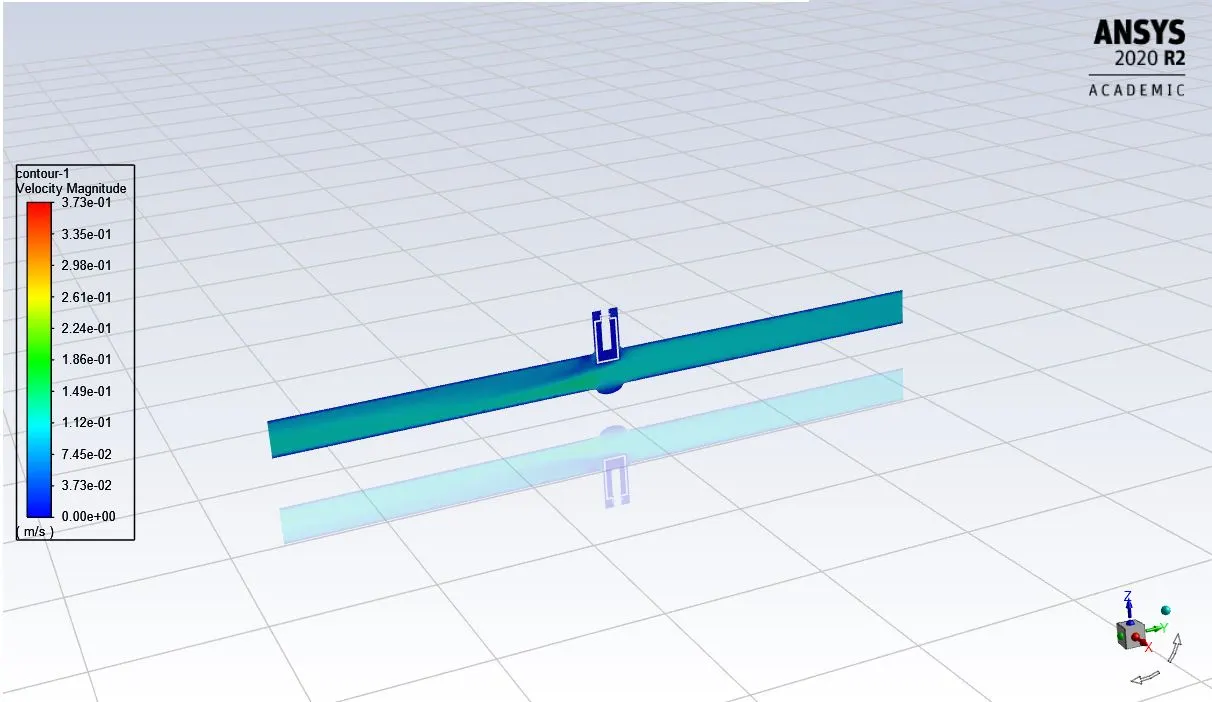
Table for different nodes and element at different opening of the valve:
|
Design points |
Elements |
Nodes |
|
10mm |
192990 |
40397 |
|
20mm |
192688 |
40155 |
|
30mm |
191317 |
39900 |
|
40mm |
190306 |
39706 |
|
50mm |
188542 |
39326 |
|
60mm |
187428 |
39182 |
|
70mm |
185720 |
39005 |
|
80mm |
205764 |
43208 |
Parametric study of gate valve:
The parametric study is done by clicking the parameter option. The design points are given as input with respect to different opening. We then choose the update all design point tab to get the parametric results. The fig below shows the parametric results obtained at various design points:
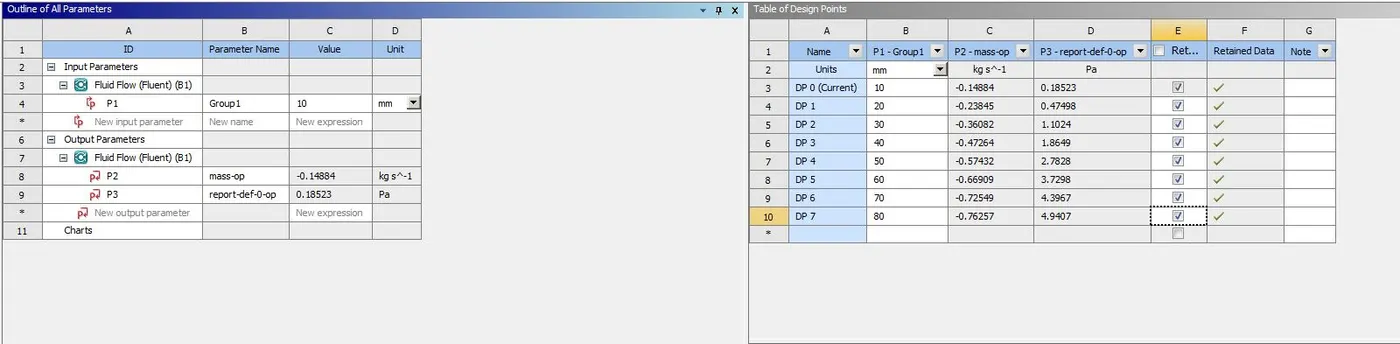
Table for different nodes and element at different opening of the valve:
|
Design points |
Elements |
Nodes |
|
10mm |
192990 |
40397 |
|
20mm |
192688 |
40155 |
|
30mm |
191317 |
39900 |
|
40mm |
190306 |
39706 |
|
50mm |
188542 |
39326 |
|
60mm |
187428 |
39182 |
|
70mm |
185720 |
39005 |
|
80mm |
205764 |
43208 |
Computation of flow coefficient and flow factor:
The table shows the different output parameters obtained from the parametric gate valve study.
|
Design points |
Mass flow |
Outlet pressure |
Pressure difference |
Flow coefficient |
Flow factor |
|
10mm |
0.14884 |
0.18523 |
9.81477 |
17.10339 |
14.79443 |
|
20mm |
0.23845 |
0.47498 |
9.52502 |
27.81422 |
24.0593 |
|
30mm |
0.36085 |
1.0124 |
8.9876 |
43.32826 |
37.47894 |
|
40mm |
0.47264 |
1.8649 |
8.1351 |
59.65564 |
51.60213 |
|
50mm |
0.57432 |
2.7828 |
7.2172 |
76.96124 |
66.57147 |
|
60mm |
0.66909 |
3.7298 |
6.2702 |
96.19364 |
83.2075 |
|
70mm |
0.72549 |
4.3967 |
5.6033 |
114.8074 |
99.30843 |
|
80mm |
0.76257 |
4.9407 |
5.0593 |
122.0498 |
105.5731 |
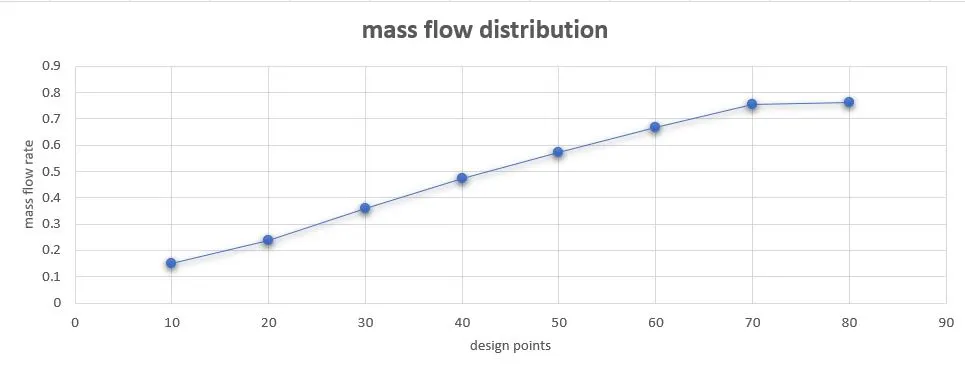
From the mass flow rate plot it is observed that the outlet flow rate increases with increase in lift of the opening. This also ensures that the pressure also increases with the at the outlet section. Generally the mass flow distribution is smooth and stable, but with increase in lift, the velocity increases and becomes more turbulent which causes fluctuation at the outlet section.
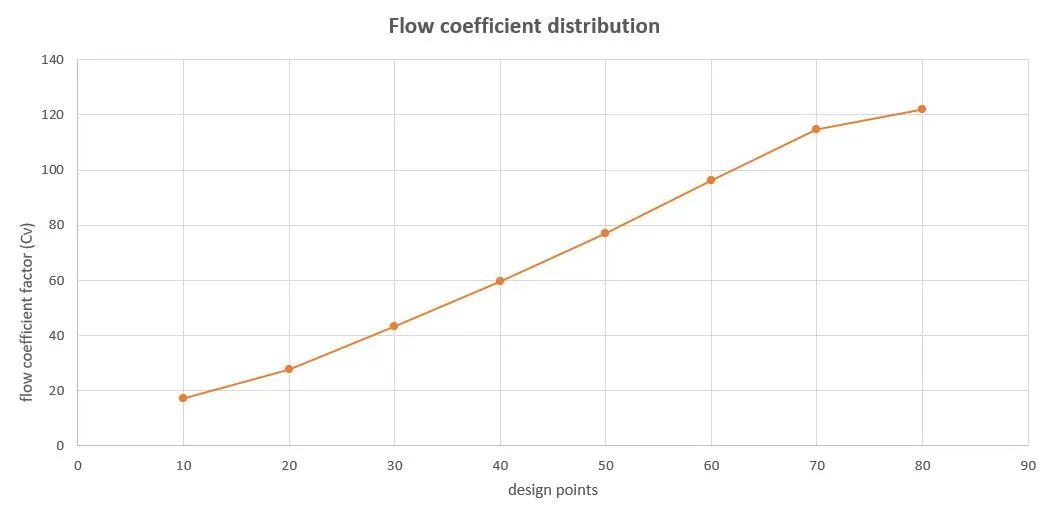
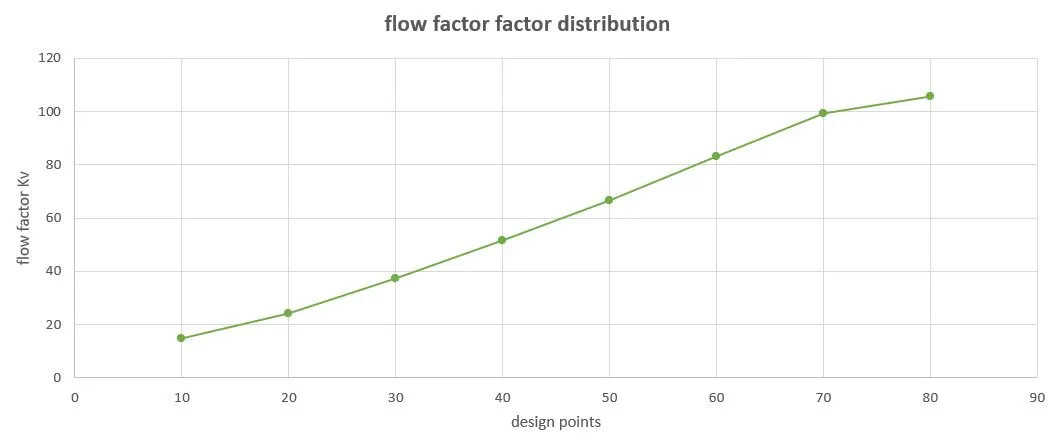
The flow coefficient and the flow factor also increase in the same trend as observed for mass flow. The nature of curve for three parameters are approximately equal. As the change in pressure level increases, the outlet flow rate also increases. This causes the flow to be turbulent and also value greater than 1 is also seen.
Conclusions:
1.The parametric study of gate valve indicated the increase in mass flow rate at the outlet section.
2.The graphical plot for mass flow rate and flow coefficient also support the simulation results.
3.The flow coefficient plays an important role in selection of valve and sizing of valve, it also determines the efficiency of the system and the pressure effect on the system.