Gate Valve Parametric Study
Parametric analysis of Gate Valve:
Aim: To perform the parametric study on the gate valve simulation by setting the valve opening from 10 % to 80%.
Objective:
Obtain the mass flow rates at the outlet for each design point.
Calculate the flow coefficient and flow factor for each opening and plot the graph.
Discuss the results of the mass flow rate and flow coefficient.
Introduction:
A gate valve, also known as a sluice valve, is a valve that opens by lifting a barrier (gate) out of the path of the fluid. Gate valves require very little space along the pipe axis and hardly restrict the flow of fluid when the gate is fully opened. Gate valves are used to shut off the flow of liquids rather than for flow regulation. When fully open, the typical gate valve has no obstruction in the flow path, resulting in very low flow resistance.
Flow Coefficient:
Flow coefficient of any device is the indicator of its efficiency in allowing the fluid flow. It describes the relationship between the pressure drop across the valve orifice and the corresponding flow rate.
The flow coefficient is expressed as:
`C_v=Q√(SG⁄∇P)`
Where,
C_v – Flow coefficient
Q – Discharge
SG- Specific gravity
∇P – Pressure Drop
Flow Factor: the metric equivalent flow factor is calculated in metric units.
`K_v=Q√(SG⁄∇P)`
Where,
Kv is the flow factor
Q is the flow rate (m3/hr)
SG is the specific gravity of the fluid
∇P is the pressure drop across the valve (bar)
Geometry:
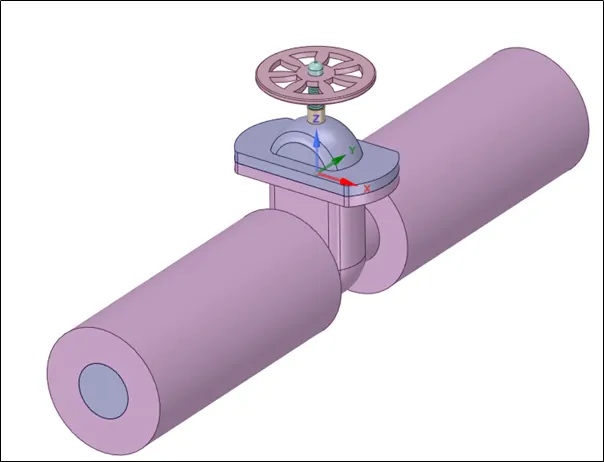
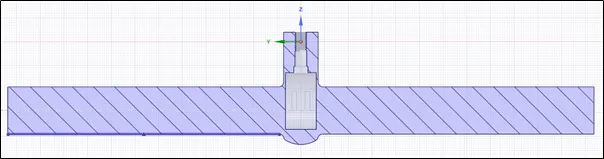
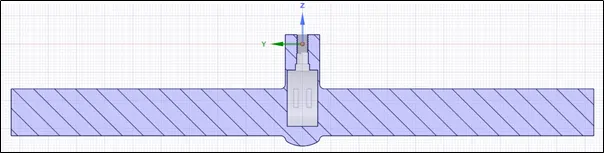
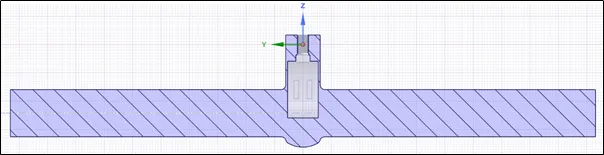
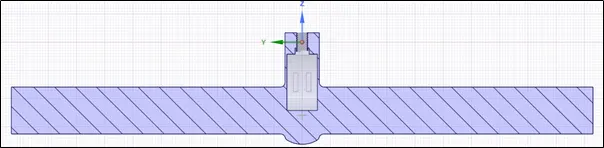
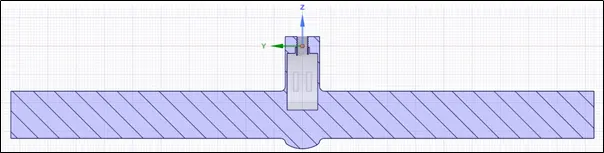
The Gate Valve geometry is as shown in figure is used for parametric study.
Meshing:
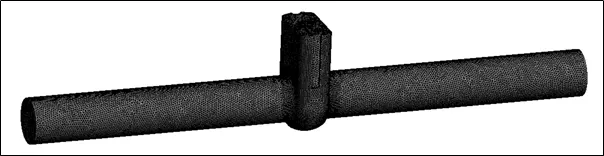
The model is meshed using ANSYS Mesher. The mesh is generated with the element size of 5e-03 m.
Number of elements: 418464
Number of nodes: 84484
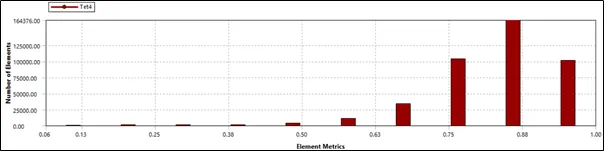
Element Quality:
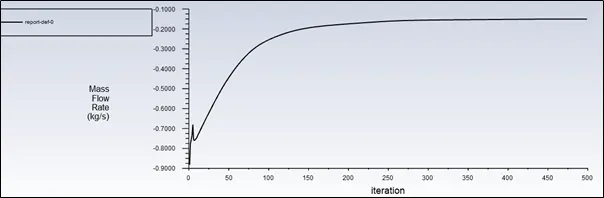
Case1: 10 mm lift
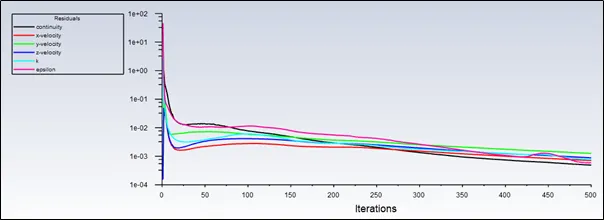
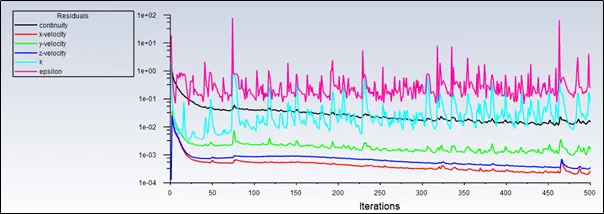
Residual:
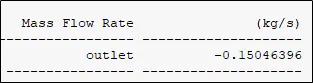
Mass Flow rate at outlet:
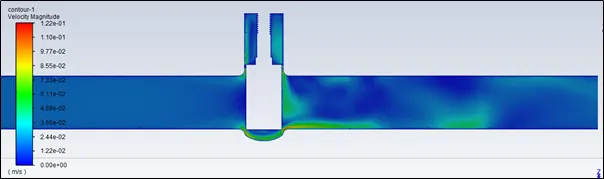
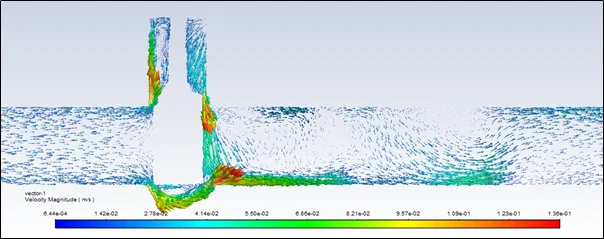
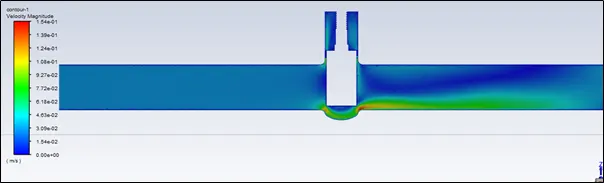
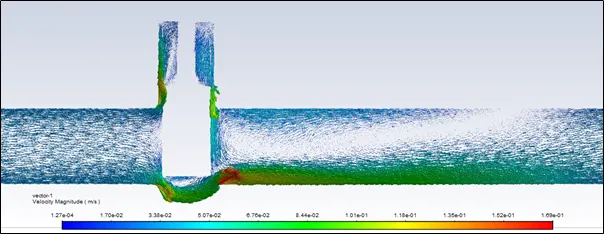
Velocity Contour and vectors:
Case2: 20 mm lift
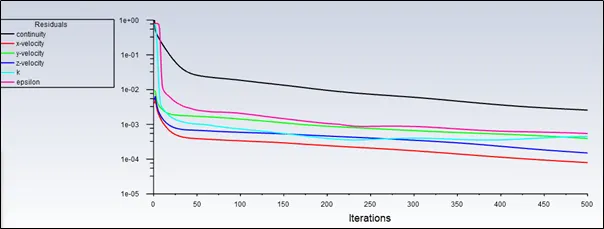
Residuals:
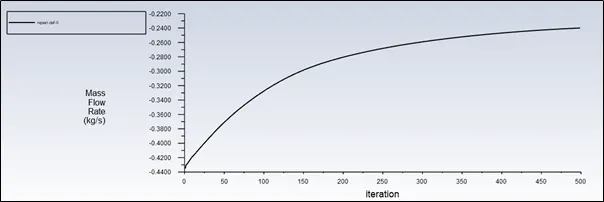
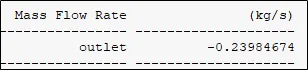
Mass Flow rate at outlet:
Velocity Contour and vector
Case3: 30 mm lift
Residual:
Mass flow rate at outlet:
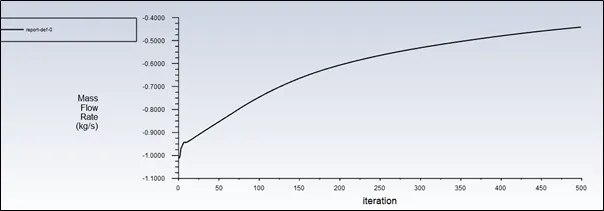
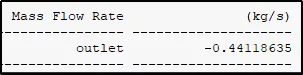
Velocity contour and vectors:
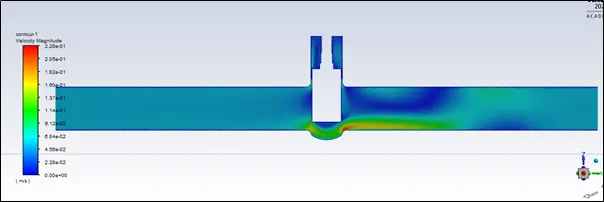
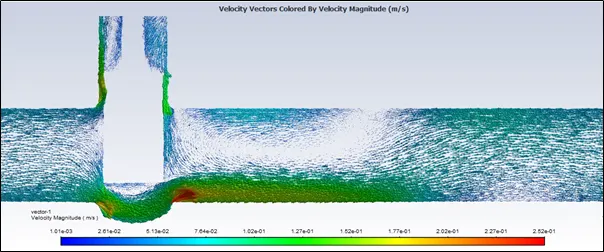
Case4: 40 mm lift
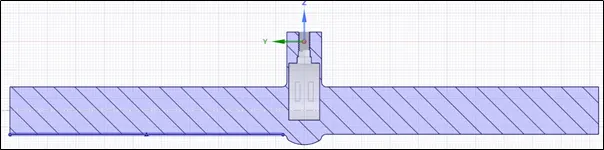
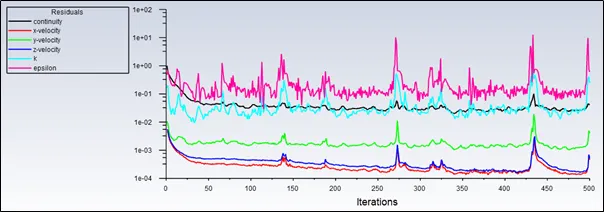
Residual:
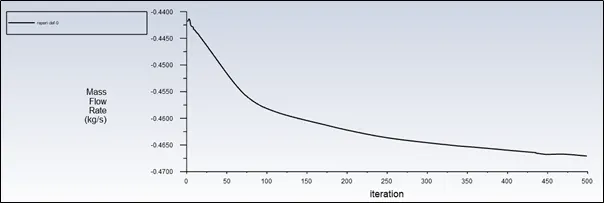
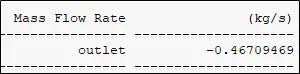
Mass flow rate at outlet:
Velocity Contour and vector:
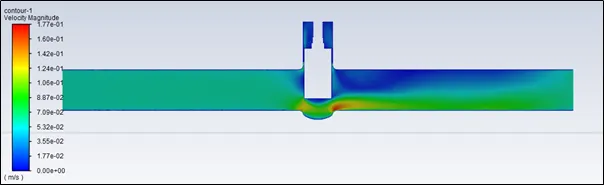
Case5: 50 mm lift
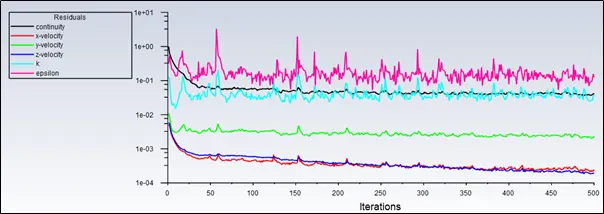
Residual:
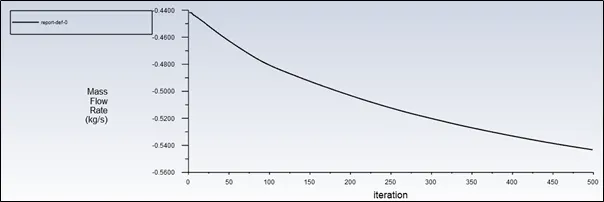
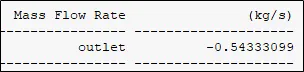
Mass flow rate at outlet:
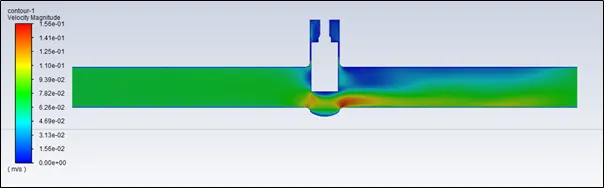
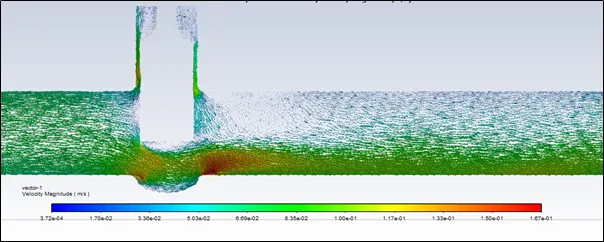
Velocity contour and Vector:
Case6: 60 mm lift
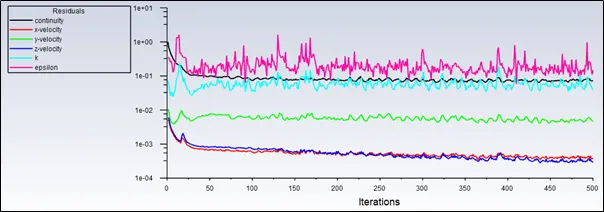
Residual:
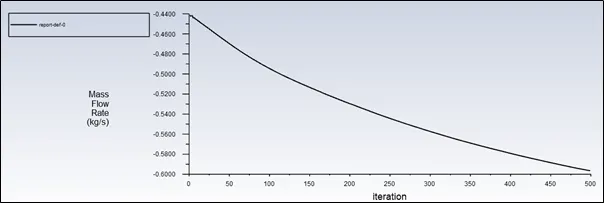
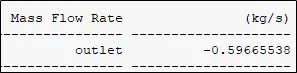
Mass flow rate at outlet:
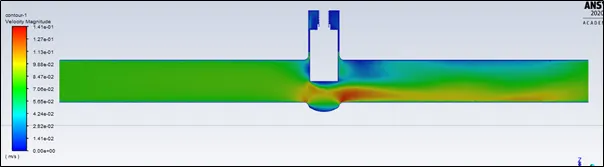
Velocity Contour and vector:
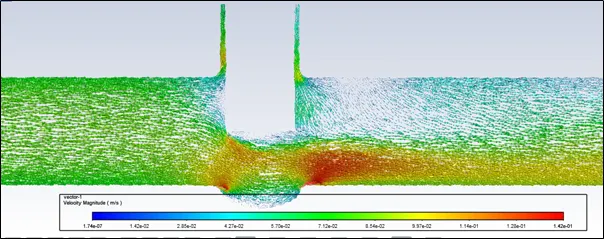
Case7: 70 mm lift
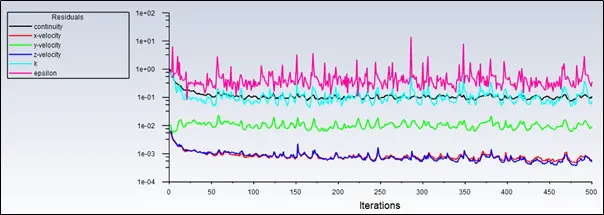
Residual:
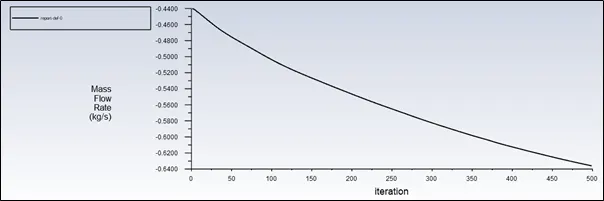
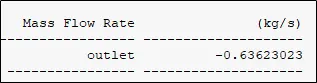
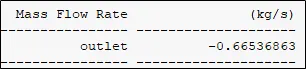
Mass flow rate at outlet:
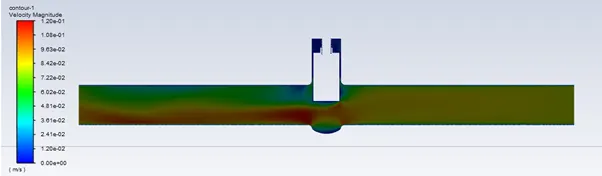
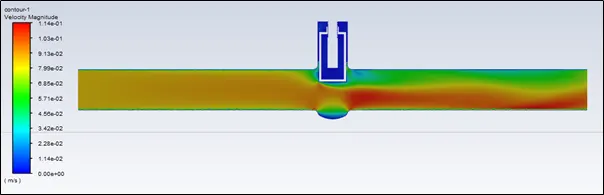
Velocity Contour:
Case8: 80 mm lift

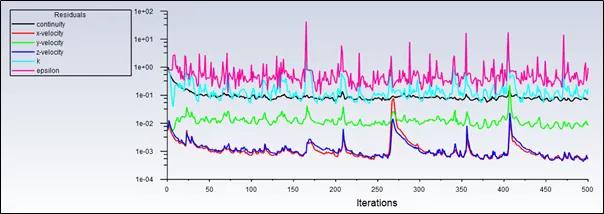
Residual:
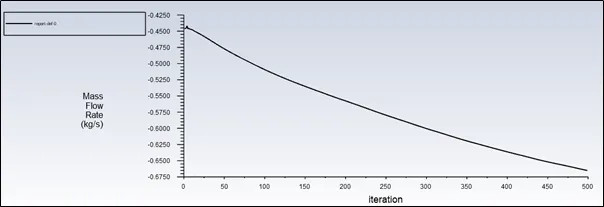
Mass flow rate at outlet:
Velocity Contour and vector:
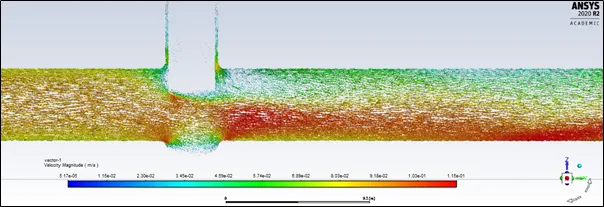
Flow Factor and Flow Coefficient calculation:
Flow factor
Lift:10 mm
Pressure drop: 10 Pa = 0.0001 bar
SG= 1
`K_v=Q√(SG⁄∇P)`
`K_v=0.541668√(1⁄0.0001)`
Kv= 54.166
And flow coefficient
`C_v=k_v/0.865`
`C_v=54.166/0.865`
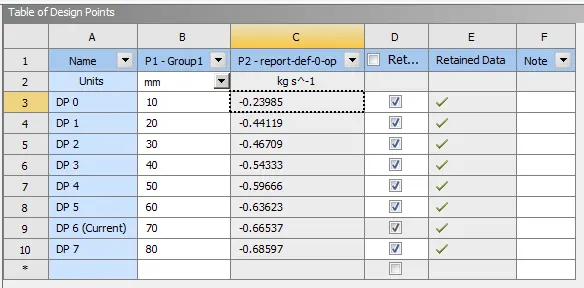
The Design points table: Parametrization data:
Flow Factor and Flow coefficient Calculation:
|
Lift(mm) |
flow rate (kg/s) |
flow rate (kg/hr) |
discharge (m3/hr) |
Sp. Gravity |
Pressure drop |
sqrt(SG/delP) |
Flow Factor |
Flow Coeff. |
|
10 |
0.15046 |
541.6668 |
0.54167 |
1 |
0.0001 |
100 |
54.16668 |
62.62 |
|
20 |
0.23985 |
863.46 |
0.86346 |
1 |
0.0001 |
100 |
86.346 |
99.822 |
|
30 |
0.44119 |
1588.284 |
1.58828 |
1 |
0.0001 |
100 |
158.8284 |
183.62 |
|
40 |
0.46709 |
1681.524 |
1.68152 |
1 |
0.0001 |
100 |
168.1524 |
194.4 |
|
50 |
0.54333 |
1955.988 |
1.95599 |
1 |
0.0001 |
100 |
195.5988 |
226.13 |
|
60 |
0.59666 |
2147.976 |
2.14798 |
1 |
0.0001 |
100 |
214.7976 |
248.32 |
|
70 |
0.63623 |
2290.428 |
2.29043 |
1 |
0.0001 |
100 |
229.0428 |
264.79 |
|
80 |
0.66537 |
2395.332 |
2.39533 |
1 |
0.0001 |
100 |
239.5332 |
276.92 |
Results:
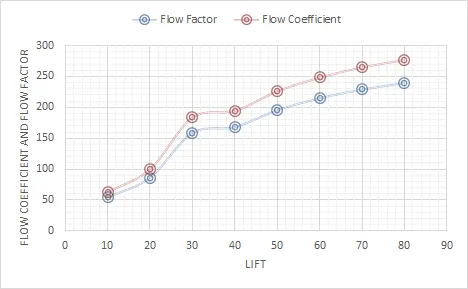
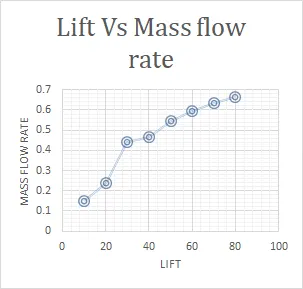
Conclusion:
From the above results, it is observed that the flow rate is increased with increase in lift of valve.
And also the flow factor and flow coefficient are proportional to the flow rate.