Final Project: Electric Rickshaw modelling
AIM:
Create a detailed MATLAB model of an electric rickshaw (three wheel passenger vehicle) as per details below:
Rear wheels driven by PM brushed type motor
Assume efficiency points of motor controller and motor
Make an excel sheet of all input and assumed data
Results: For any three standard driving cycles show energy consumption, temperature rise of motor and controller for 100 km constant speed driving at 45 kmph.
THEORY:
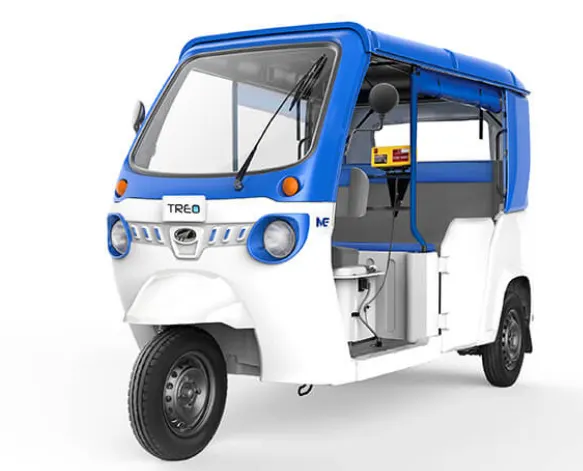
Electric rickshaws (also known as electric tuk-tuks or e-rickshaws or toto or e-tricycles) have been becoming more popular in some cities since 2008 as an alternative to auto rickshaws and pulled rickshaws because of their low fuel cost, and less human effort compared to pulled rickshaws. They are being widely accepted as an alternative to petrol/diesel/CNG auto rickshaws. They are three-wheelers powered by an electric motor ranging from 650 to 1400 Watts. They are mostly manufactured in India and China, only a few other countries manufacture these vehicles. Battery-run rickshaws could be a low-emitter complementary transport for the low-income people, who suffer most from a lack of transport facility, if introduced in a systematic manner according to experts.
These rickshaws have a M.S(Mild Steel) tubular Chassis, consisting of three wheels with a differential mechanism at the rear wheels. The motor is brushless DC motor manufactured mostly in India and China. The electrical system used in Indian version is 48V and Bangladesh is 60V. The body design from most popular Chinese version is of very thin iron or aluminum sheets. Vehicles made in fiber are also popular because of their strength and durability, resulting in low maintenance, especially in India. Body design is varied from load carriers, passenger vehicles with no roof, to full body with windshield for drivers comfort. It consist of a controller unit.They are sold on the basis of voltage supplied and current output, also the number of mosfet (metal oxide field effect transistors) used. The battery used is mostly lead acid battery with life of 6–12 months. Deep cycle batteries designed for electric vehicles are rarely used. Weight of the electric car has also been a recurring design difficulty in them.
BLOCK DIAGRAM:
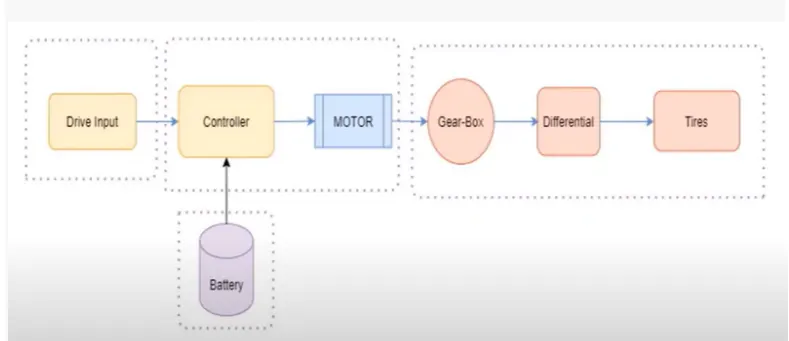
the model of electric vehicle is divided into four parts
1) vehicle body- in vehicle body we have gear box, tires, differential.
2) motor and controller part- we will use simple dc motor and H bridge controller.
3)drive input- we will create input by inbuilt drive cycle or by using signal builder block
4) battery
from the model we see that the drive input will provide driving cycle . the battery is connected to the motor through controller. if the battery is directly connected to motor , then controlling of speed is not possible.
the mechanical energy from dc motor is given to vehicle body so that the vehicle will perform accordingly.
MODEL:
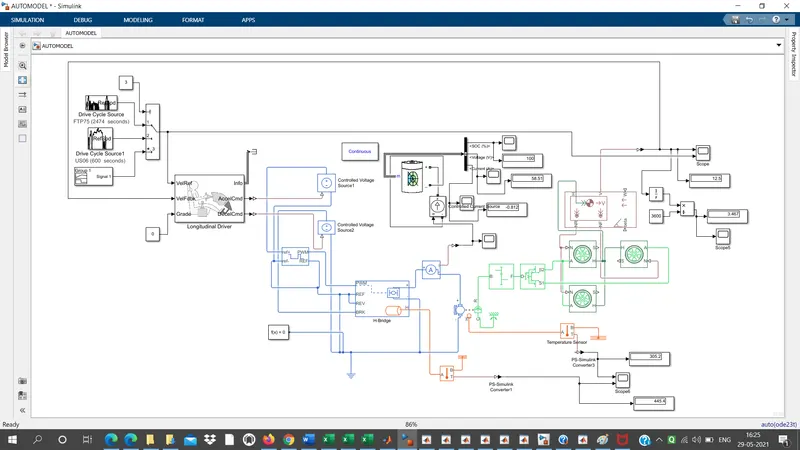
BLOCKS USED IN MODEL:
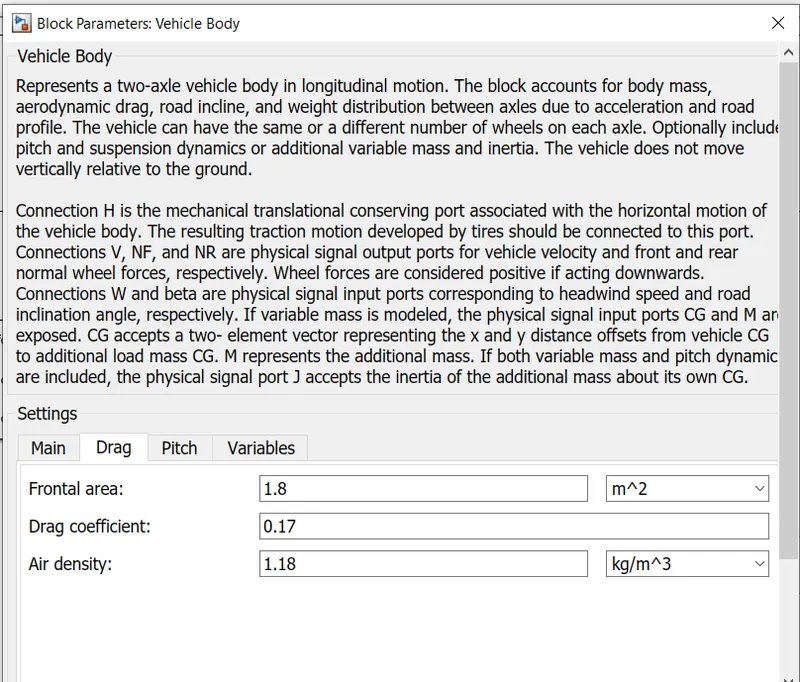
1) VEHICLE BODY
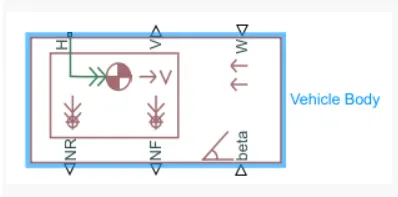
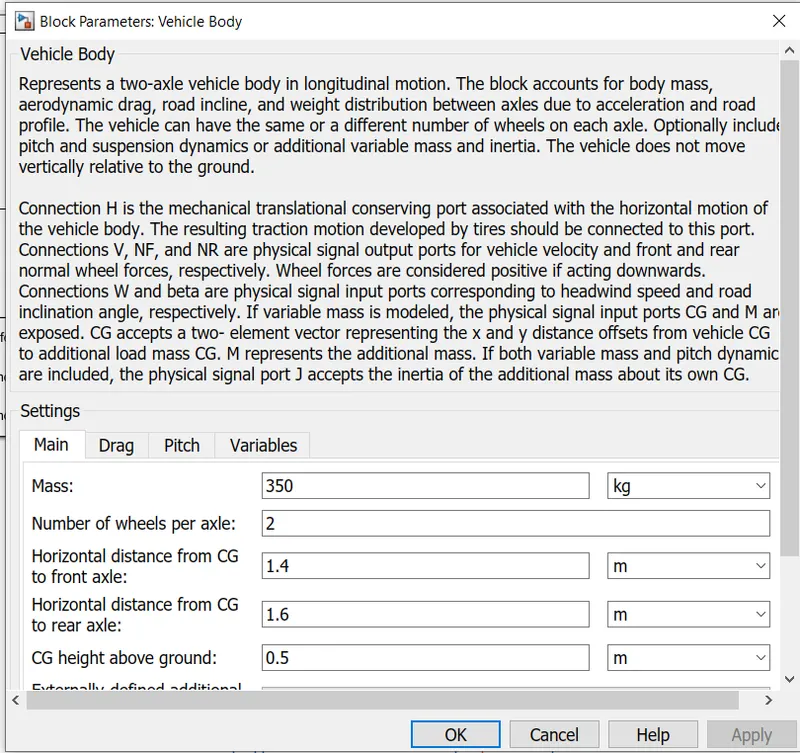
vehicle body have 6 ports.
V-actual sped of vehicle
w-wind velocity
beta- inclination of road
NF-normal force for front wheel
NR- normal force for rear wheel.
H-horizontal motion
2) TIRE:
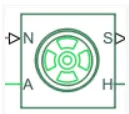
The Tire (Friction Parameterized) block models a tire with friction parameterized in terms of static and kinetic coefficients. The static friction coefficient determines the applied torque at which the tire loses traction and begins to slip. The kinetic friction coefficient determines the amount of torque that the tire transmits to the pavement once it begins to slip. The tire regains traction once its relative velocity over the pavement falls below the traction velocity tolerance specified.
To increase the fidelity of the tire model, the block enables you to specify properties such as tire compliance, inertia, and rolling resistance
input ports is
N-normal force
output port is
S-slip
conserving port are
1)A-axle
2)H-hub
3) DIFFERENTIAL:
by diffrential block ,we can add inertia and losses of gear machine and viscous gear friction.
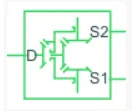
The Differential block represents a gear mechanism that allows the driven shafts to spin at different speeds. Differentials are common in automobiles, where they enable the various wheels to spin at different speeds while cornering. Ports D, S1, and S2 represent the longitudinal driving and the sun driven gear shafts of the differential.
the equivalent circuit for the block.
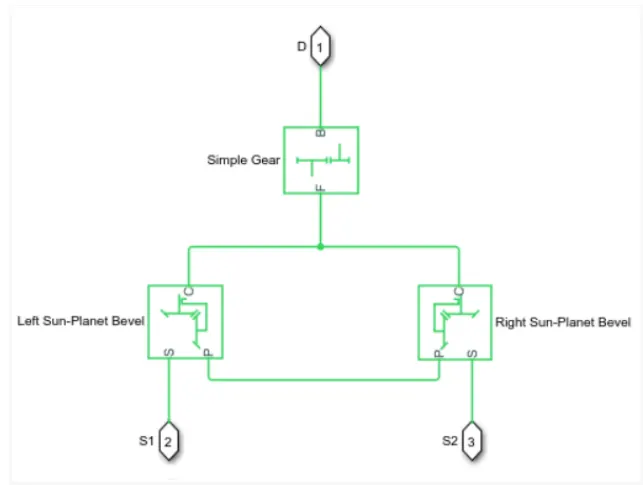
To increase the fidelity of the gear model, we specify the properties such as gear inertia, meshing losses, and viscous losses. By default, gear inertia and viscous losses are assumed negligible. The block enables us to specify the inertias of the gear carrier and internal planet gears only.
4) SIMPLE GEAR:
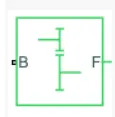
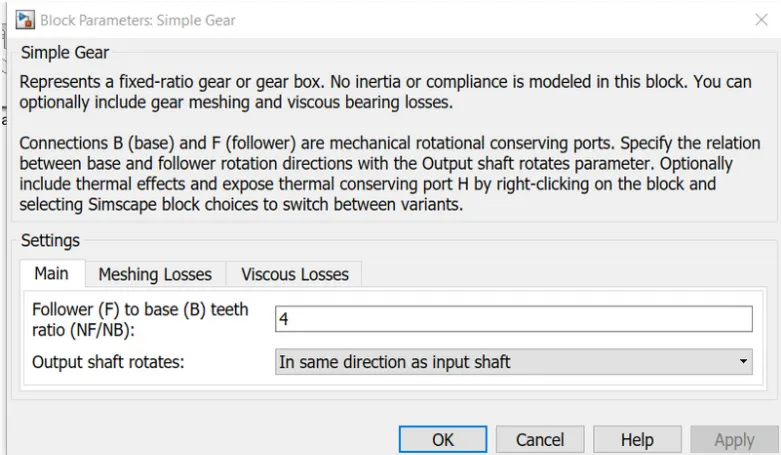
The Simple Gear block represents a gearbox that constrains the connected driveline axes of the base gear, B, and the follower gear, F, to corotate with a fixed ratio that we specify.
5) PS-SIMULINK CONVERTER-

vehicle body have physical quantities but the scope and display used show digital values .thus ps -simulink converter is used.
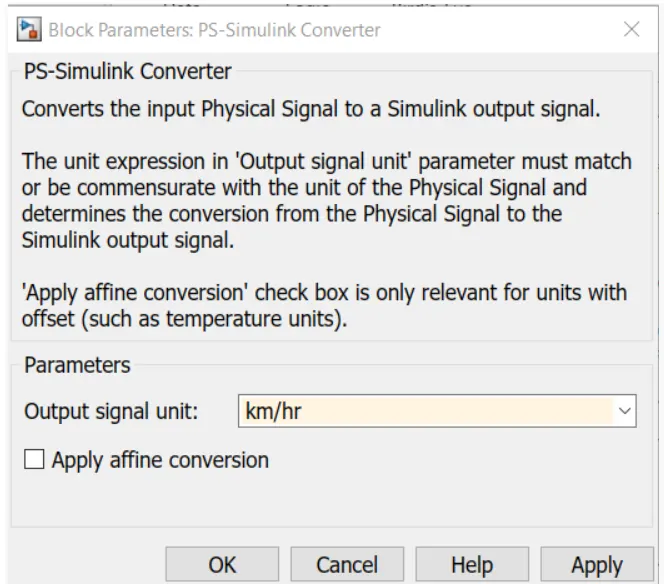
output signal unit is changed to km/hr
6) DC MOTOR:
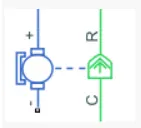
+ = positive terminal
- = negative termional
c = motor case
R = motor rotor
the c terminal is connected to mechanical rotational reference.
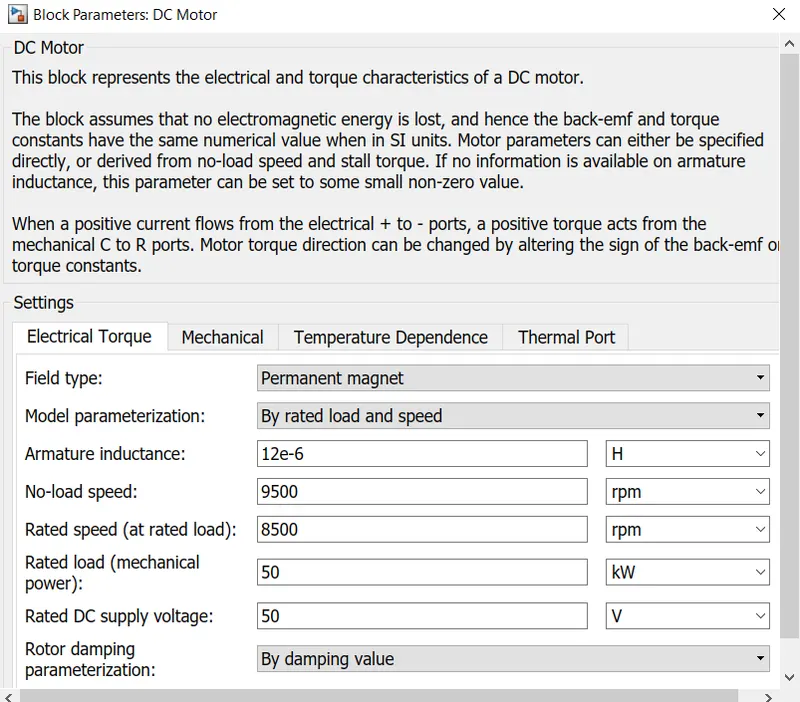
7) Hbridge coverter
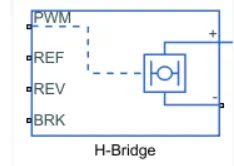
to control the motor current input , the H bridge converter is used.
The H-Bridge block represents an H-bridge motor driver. The block has the following two Simulation mode options:
1)The H-Bridge block output is a controlled voltage that depends on the input signal at the PWM port. If the input signal has a value greater than the Enable threshold voltage parameter value, the H-Bridge block output is on and has a value equal to the value of the Output voltage amplitude parameter. If it has a value less than the Enable threshold voltage parameter value, the block maintains the load circuit using one of the following three Freewheeling mode options:
- via one semiconductor switch and one freewheeling diode
- via two freewheeling diode
- via two semiconductor switch and one freewheeling diode
The first and third options are sometimes referred to as synchronous operation.
2)The signal at the REV port determines the polarity of the output. If the value of the signal at the REV port is less than the value of the Reverse threshold voltage parameter, the output has positive polarity; otherwise, it has negative polarity.Electrical conserving port associated with the voltage that controls when to reverse the polarity of the H-Bridge block output. The voltage is defined relative to the REF port.
3)BRK PORT- Electrical conserving port associated with the voltage that controls when to short circuit the H-Bridge block output. The voltage is defined relative to the REF port.
by the help of h bridge we can perform accleration , braking and reverse mechanism.
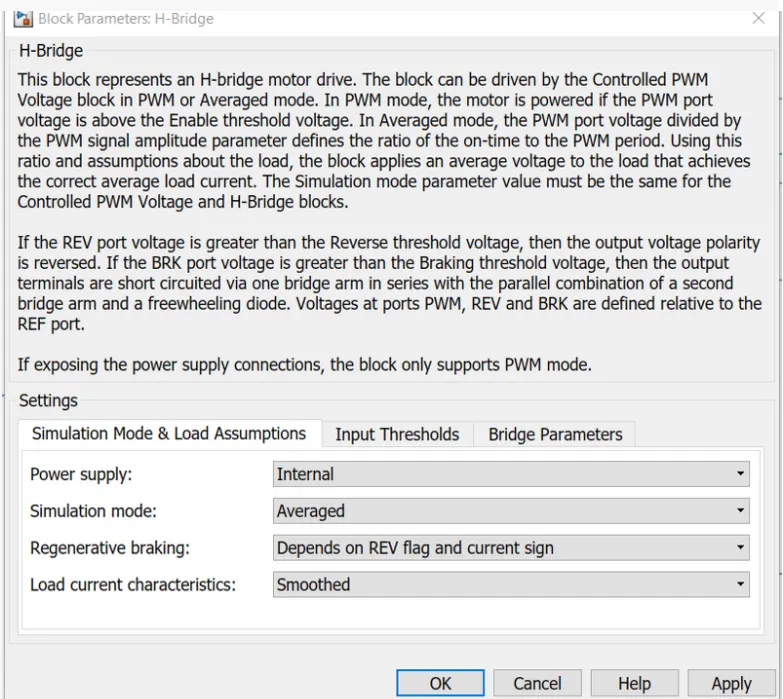
change simulation mode to average , this will reduce simulation time
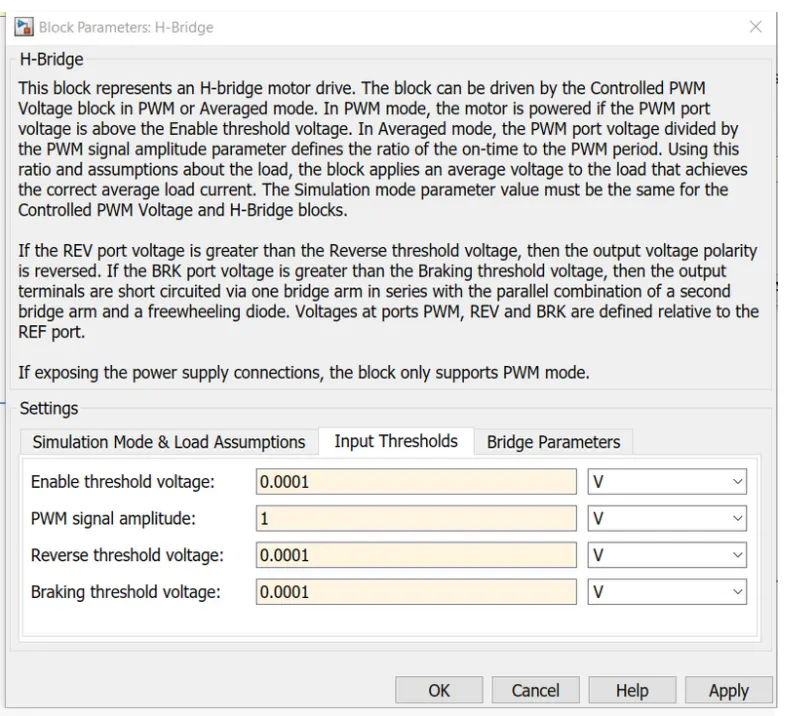
now change the input thresholds value as shown .
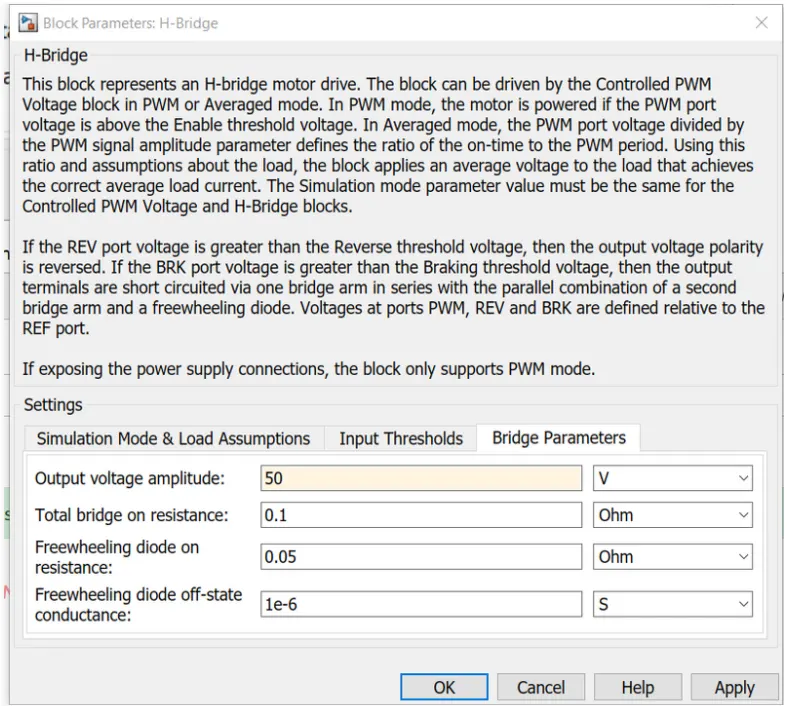
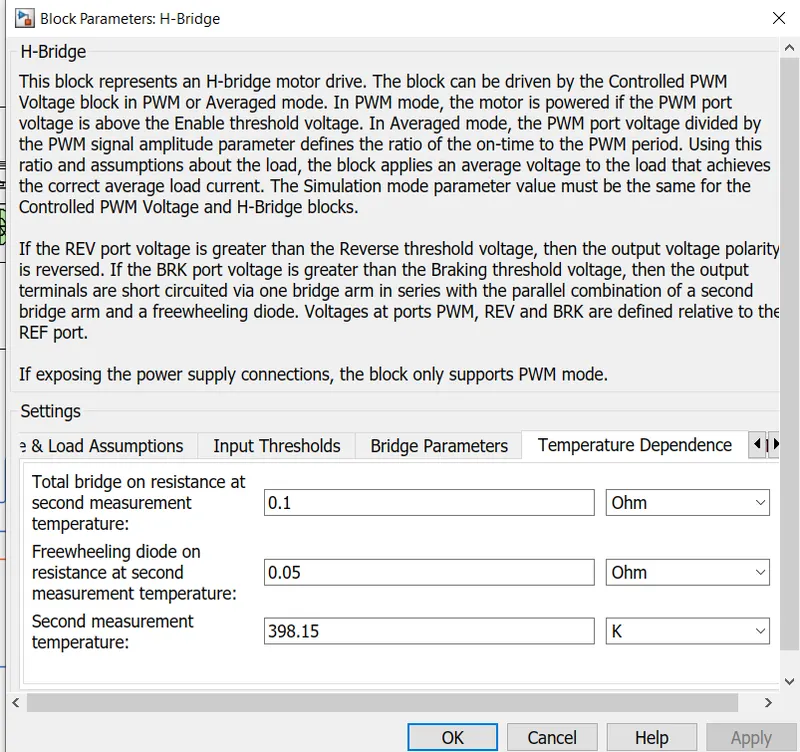
in bridge parameters , change the output voltage amplitude to 50 volts.
8) CONTROLLED PWM VOLTAGE:
to control PWm input we use controlled pwm voltage.
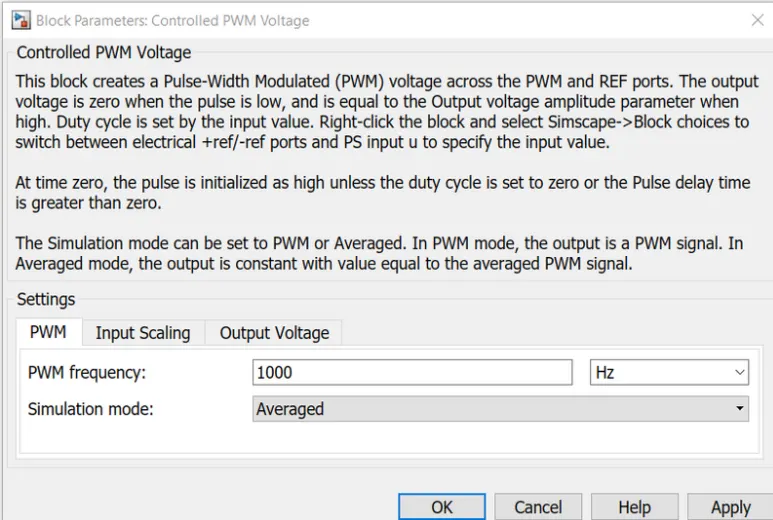
change simulation mode to averaged .
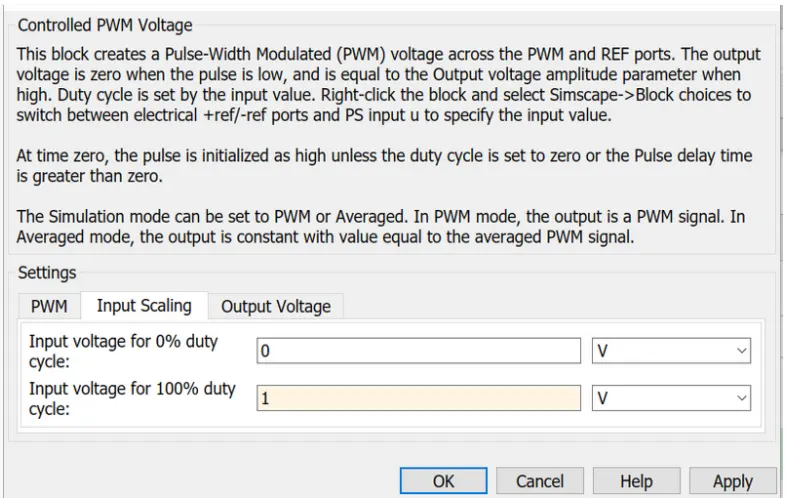
in input scaling , make lower value to zero and higher value to 1.
this done because driver will give signals in format of 0 and 1.
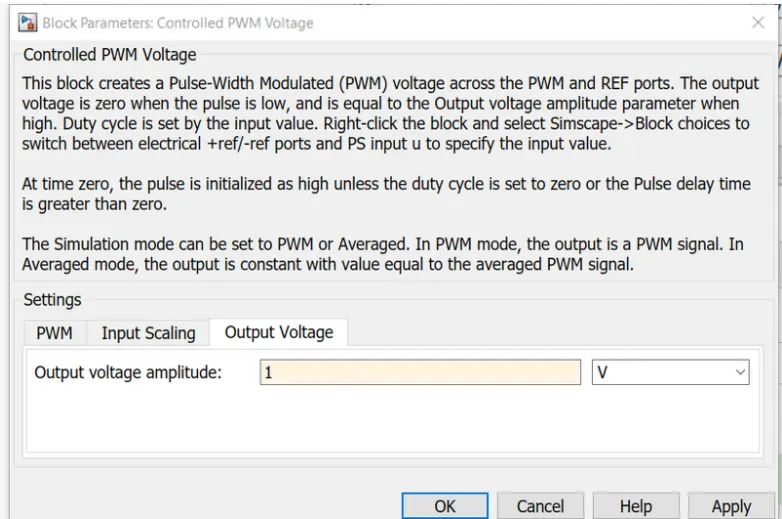
also make output voltage amplitude to 1.
the controlled pwm voltage block will get input from driver and driver will provide input in terms of 0 and 1 .thus we have choosen 0 and 1 as low and high value respectively.
9) ELECTRICAL REFERENCE:
all the references are connected to electrical reference .also connect solver confugration to ground.

10) LONGITUDINAL DRIVER:
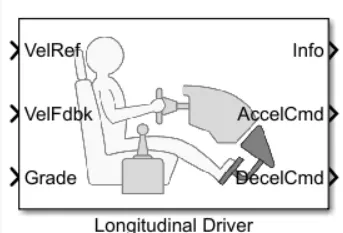
The Longitudinal Driver block implements a longitudinal speed-tracking controller. Based on reference and feedback velocities, the block generates normalized acceleration and braking commands that can vary from 0 through 1. You can use the block to model the dynamic response of a driver or to generate the commands necessary to track a longitudinal drive cycle.
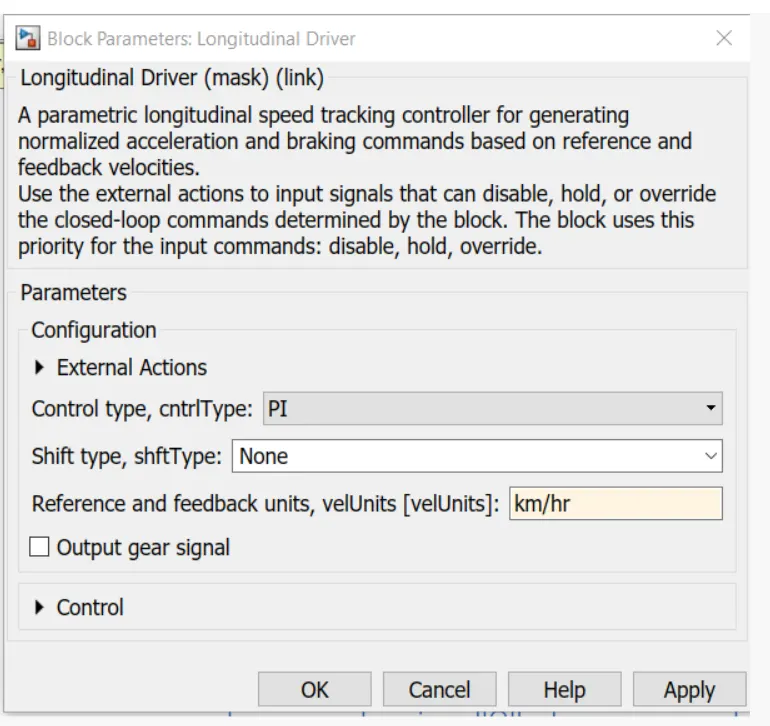
by double clicking on longitudinal driver block , change the reference and feedback units to km/hr.
here we will provide reference signal by inbuilt drive cycle or by creating our own signal by the help of signal builder block.
we will connect actual speed of vehicle to the port velocity feedback.
the grade port is connected to constant value let be 0.
we will get acceleration command from accel command
and deacceleration command from decel command.
11) SIMULINK TO PS CONVERTER:

this block is used to convert simulink signal to physical signal.
12) CONTROLLED VOLTAGE SOURCE
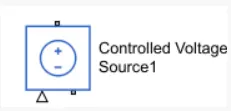
this block is used to provide constant voltage throughout the circuit.
13) BATTERY
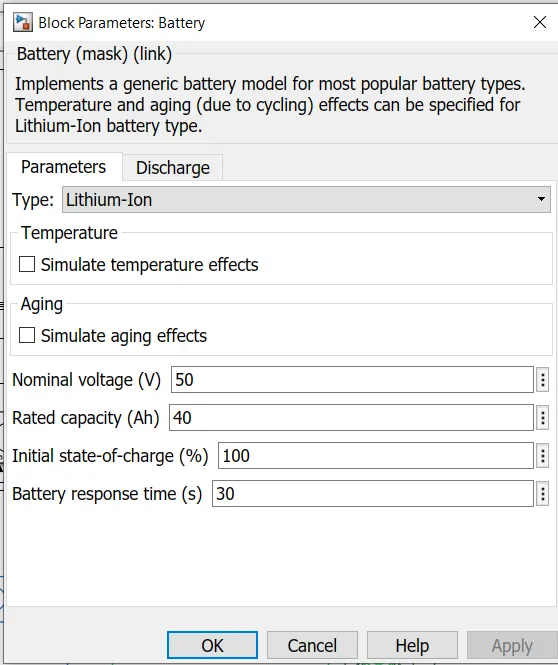
The lithum ion battery is taken in model. the nominal voltage selected is 50 volts .
14)BUS SELECTOR
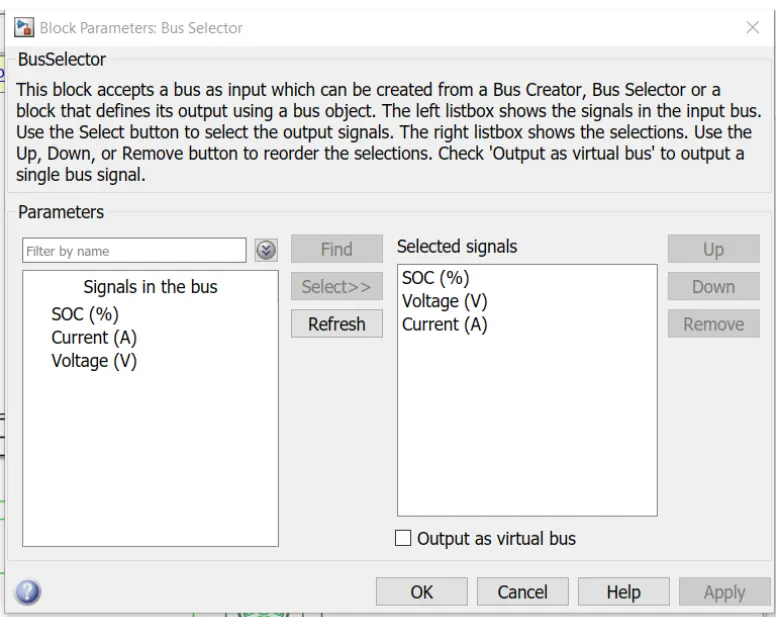
In bus selector, we have taken signal SOC , voltage and current.
15) CONTROLLED CURRENT SOURCE:

a controlled current source is connected to the lithium battery. this controlled current source will initiate the flow of current from battery to motor and during regenerative barking from motor to battery.
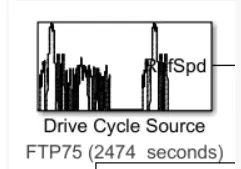
16) DRIVE CYCLE SOURCE:
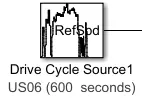
3 drive cycle source considered
1)default FTP75 drive cycle source
2)US06 drive cycle
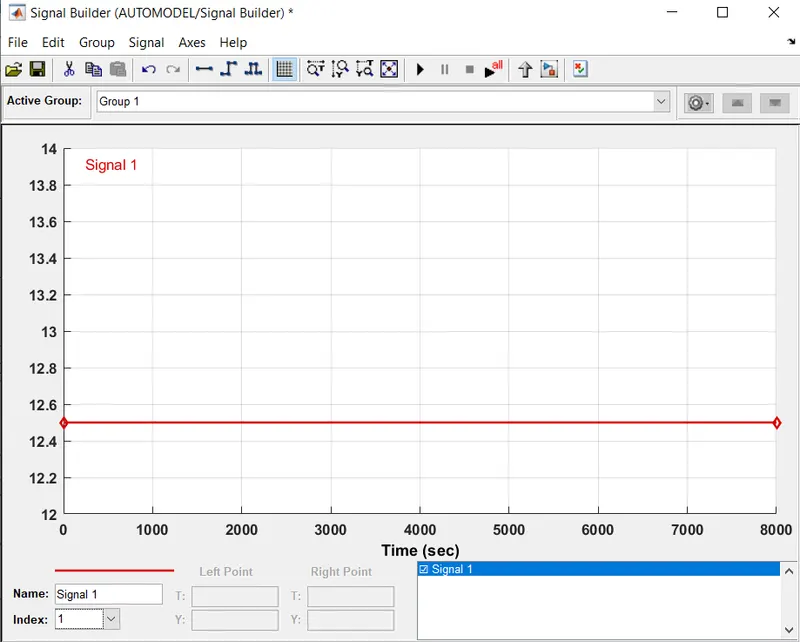
3) as given in question - for 100 km constant speed driving at 45 kmph
now speed=distance/time
thus time=distance/speed
time=100/45
time=2.2222hours
thus time=2.2222*60*60=8000 seconds
now 45kmph =(45*1000)/3600=12.5 m/sec
17) to measure temperature rise of motor and controller
Temperature Sensor block
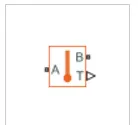
The Temperature Sensor block represents an ideal temperature sensor, that is, a device that determines the temperature differential measured between two points without drawing any heat.
Connections A and B are thermal conserving ports that connect to the two points where temperature is being monitored. Port T is a physical signal port that outputs the temperature differential value.
The block positive direction is from port A to port B. The measured temperature is determined as T = TA – TB
The block has the following ports:
AThermal conserving port associated with the sensor positive probe.BThermal conserving port associated with the sensor negative probe.TPhysical signal output port for temperature.
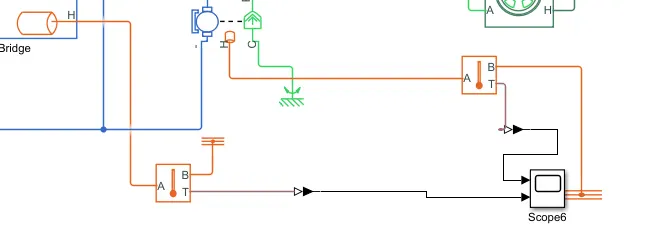
thermal sensor block is used to measure temperature rise of motor and controller.
18) TO MEASURE DISTANCE TRAVELLED BY ELECTRIC VEHICLE:
The scope will display velocity of vehicle in km/hr.
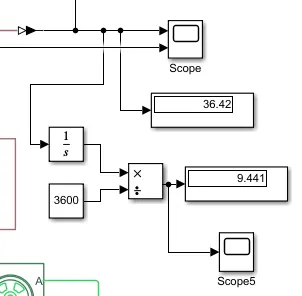
to measure the distance in km, an intergator block is used beacuse intergartion of velocity will give us distance.
and 3600 constant block is used because 1hr=3600 seconds.
thus scope 5 will give distance graph.
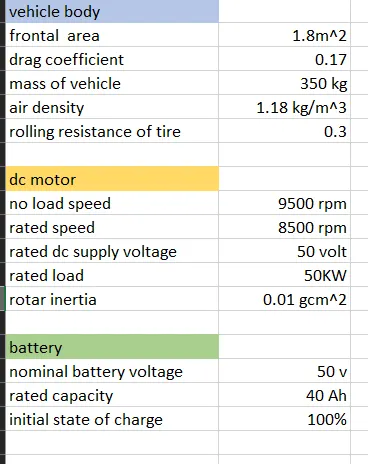
THE EXCEL SHEET FOR ALL INPUTS AND ASSUMED DATA:
RESULTS:
a) for default FTP75 drive cycle source
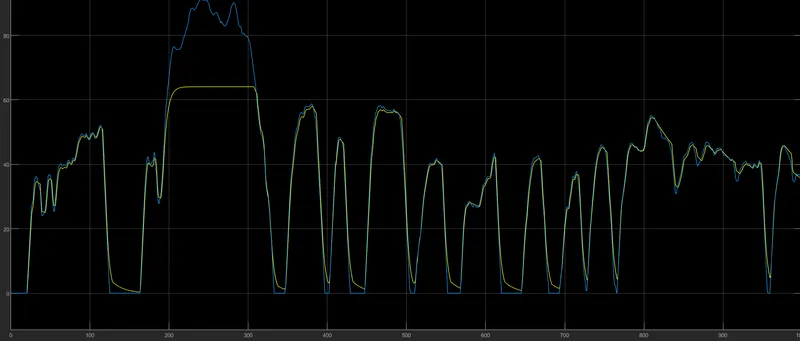
blue lines shows the default FTP75 drive cycle source graph and yellow line shows the output velocity graph
we found from the graph that the output velocity follows the input default drive cycle.
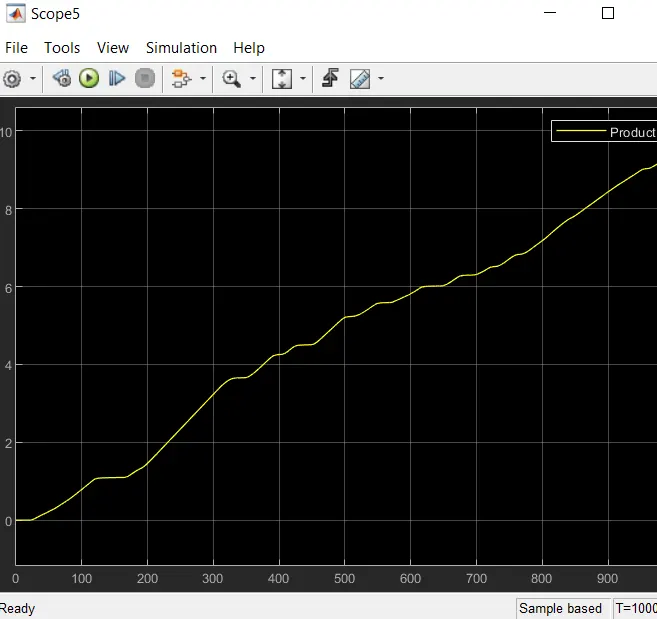
the above graph shows the distance covered by Electric Rickshaw.
thus from the graph we found that the distance travelled by Electric Rickshaw is 9.441 km
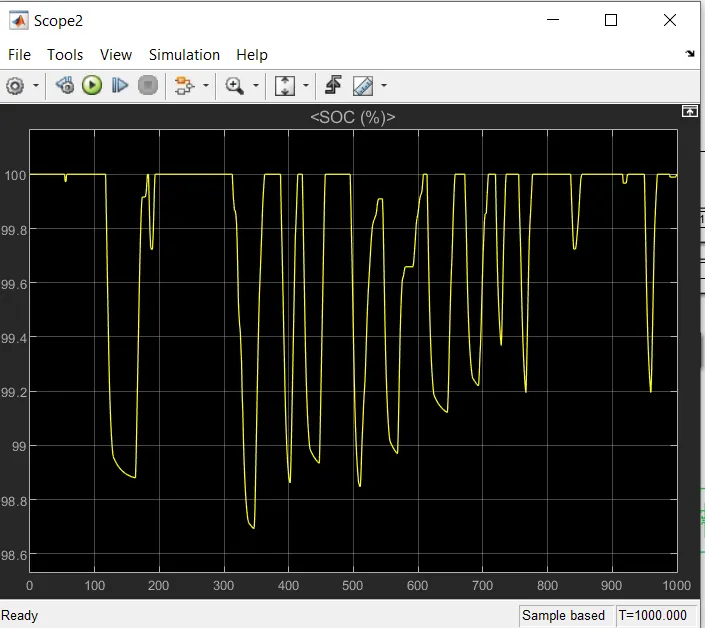
the above graph shows the SOC variation
as the input default drive cycle varies , the SOC also changes accordingly.
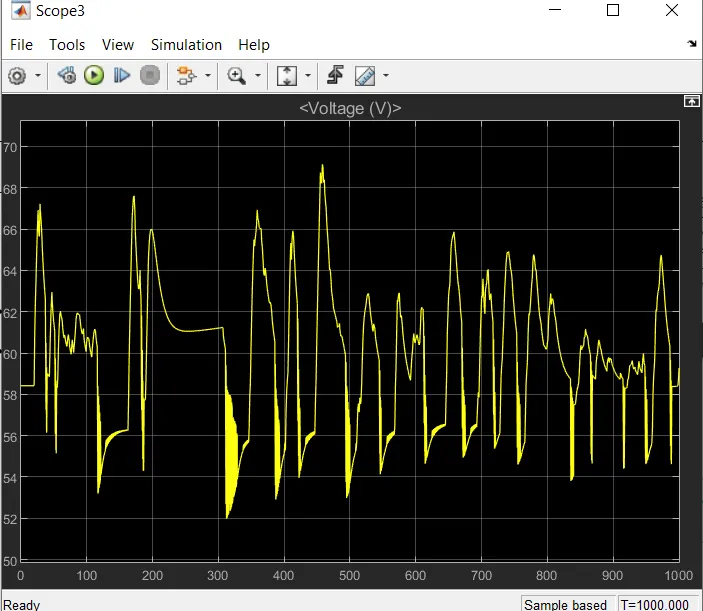
the above graph shows the variation of battery voltage.
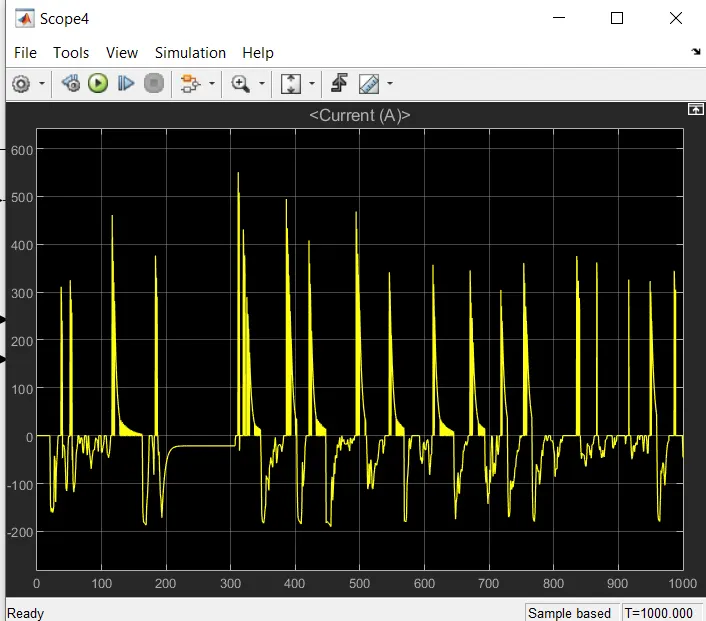
the above graph shows the variation of battery current.
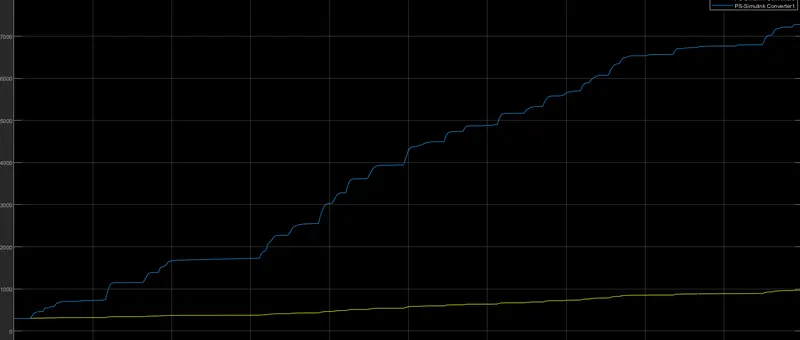
the above graph shows the variation in temperature of motor and motor controller.
blue graph shows the temperature variation of motor controller
yellow graph shows the temperature variation of motor .
b) for US06 drive cycle
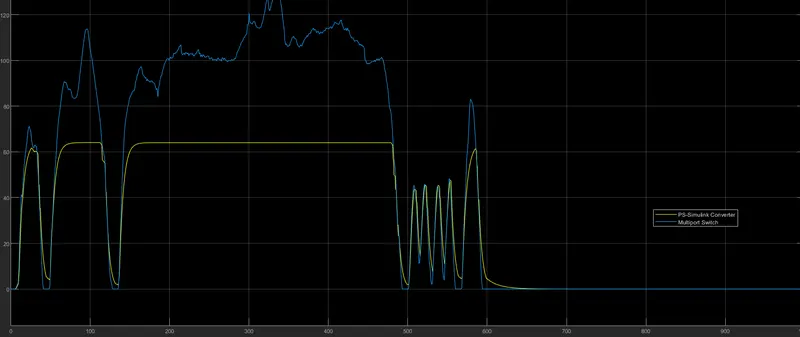
blue lines shows the US06 drive cycle source graph and yellow line shows the output velocity graph
we found from the graph that the output velocity follows the input default drive cycle.
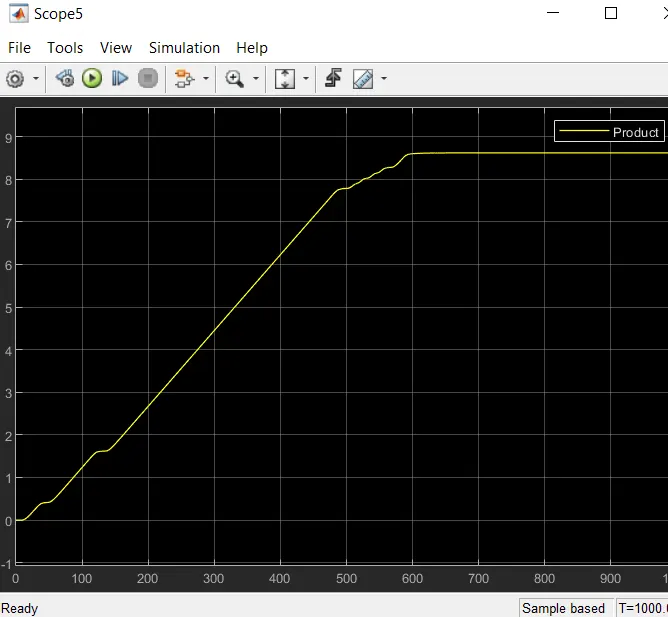
the above graph shows the distance covered by Electric Rickshaw.
thus from the graph we found that the distance travelled by Electric Rickshaw is 8.617 km
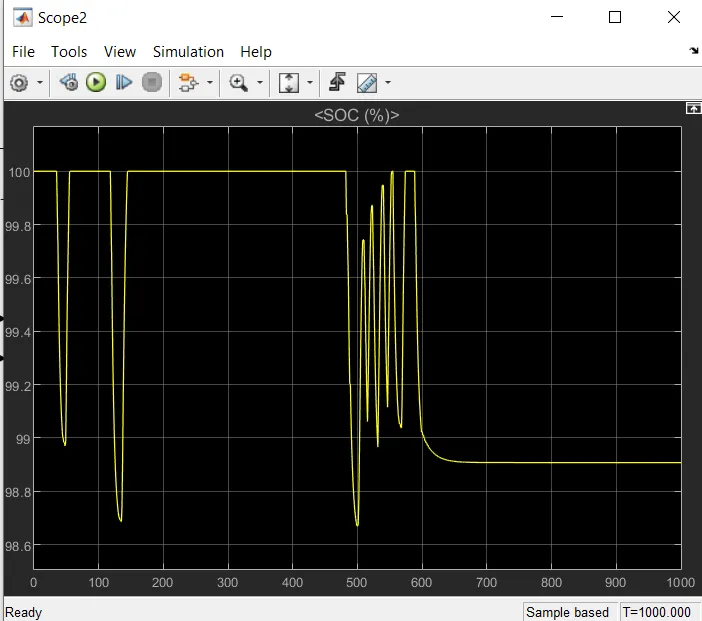
the above graph shows the SOC variation
as the input default drive cycle varies , the SOC also changes accordingly.
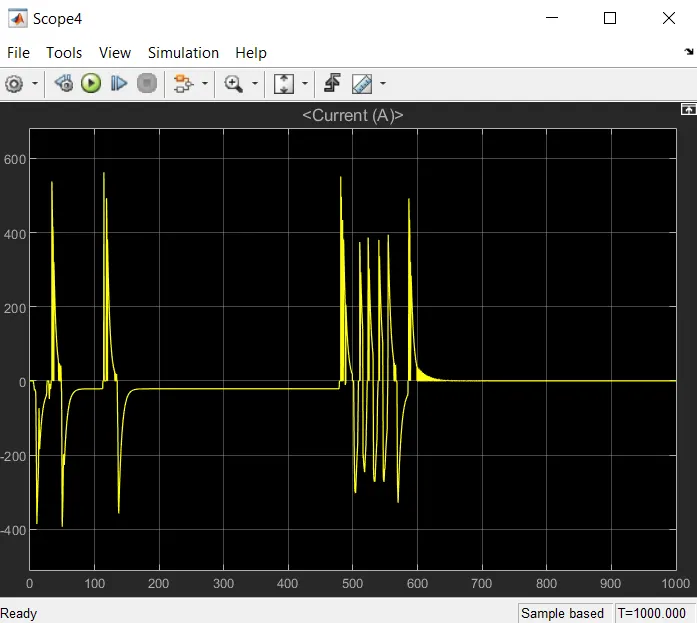
the above graph shows the variation of battery current.
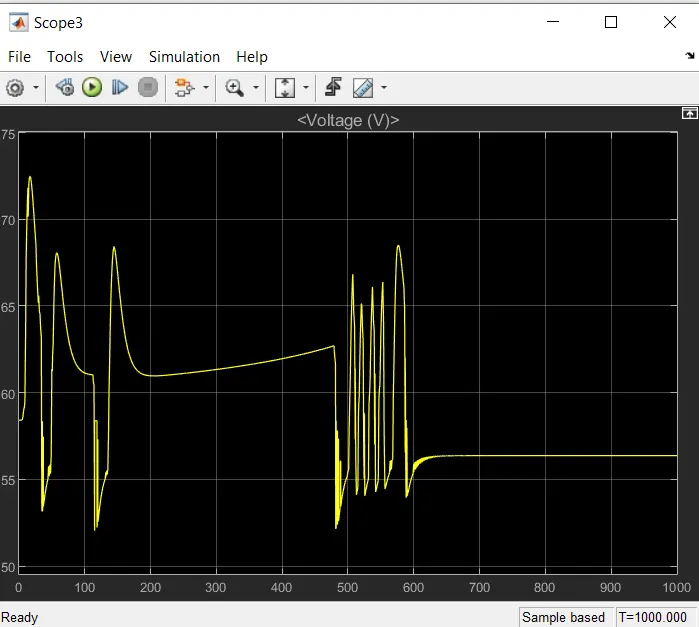
the above graph shows the variation of battery voltage.
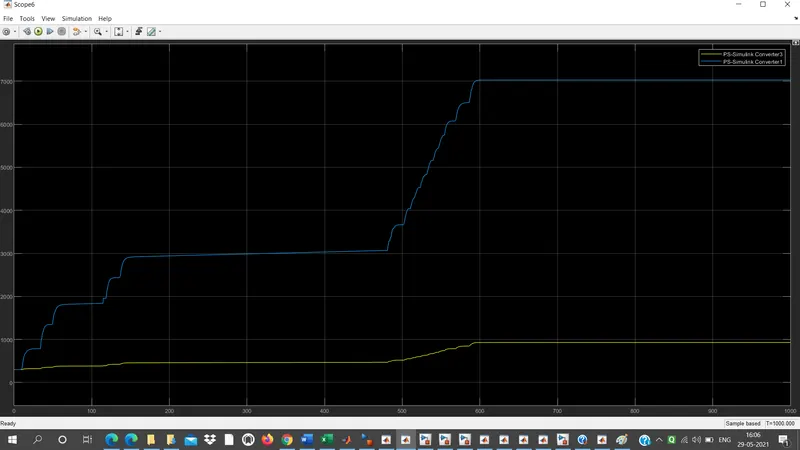
the above graph shows the variation in temperature of motor and motor controller.
blue graph shows the temperature variation of motor controller
yellow graph shows the temperature variation of motor .
3) 45 kmph till 100 km drive cycle.
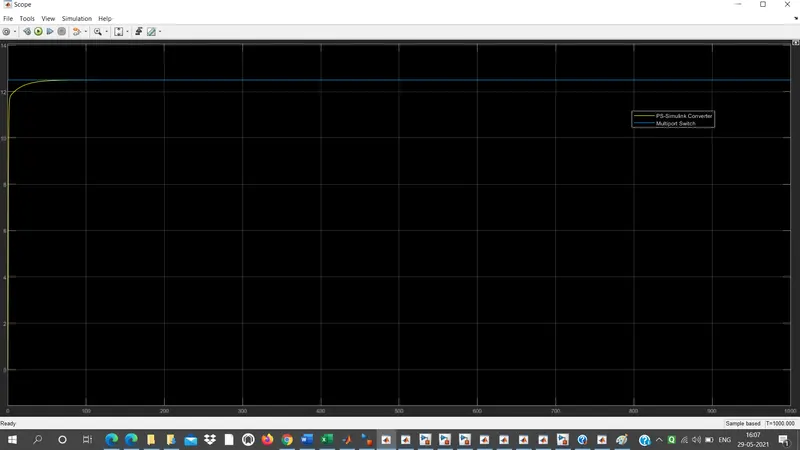
blue lines shows the drive cycle source graph and yellow line shows the output velocity graph
we found from the graph that the output velocity follows the input default drive cycle.
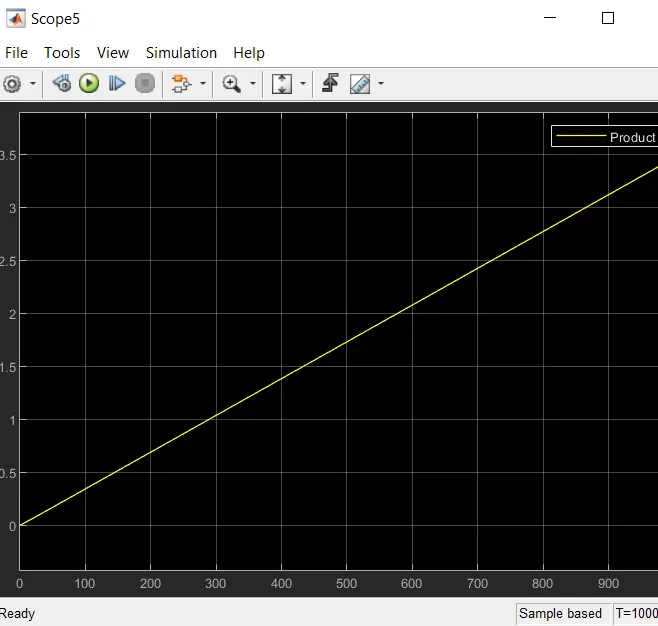
the above graph shows the distance covered by Electric Rickshaw.
thus from the graph we found that the distance travelled by Electric Rickshaw is 3.467 km
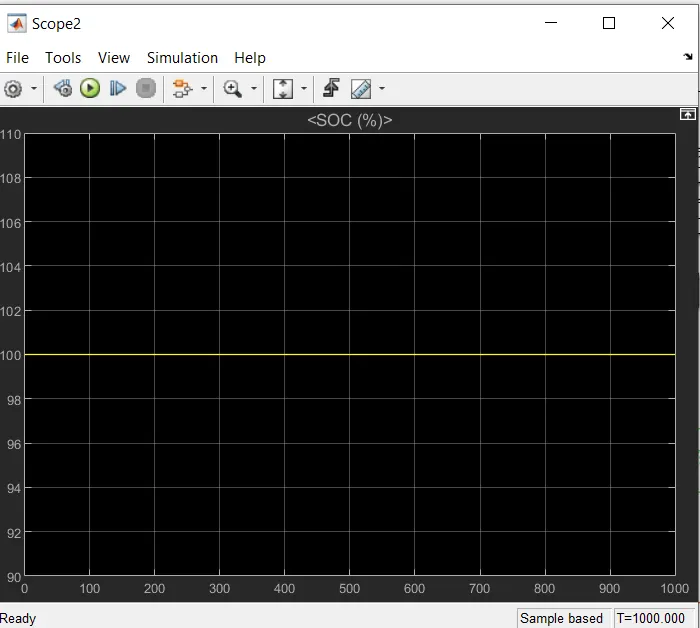
the above graph shows the SOC variation
as the input drive cycle varies , the SOC also changes accordingly.
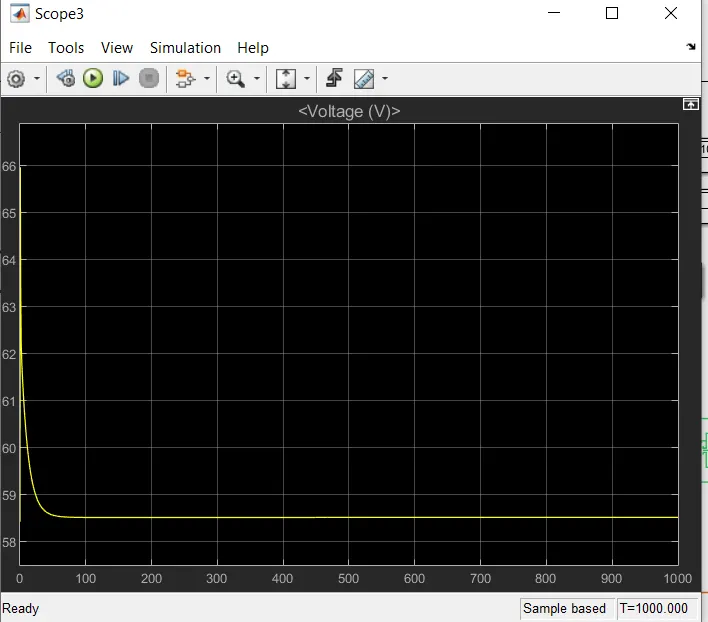
the above graph shows the variation of battery voltage.
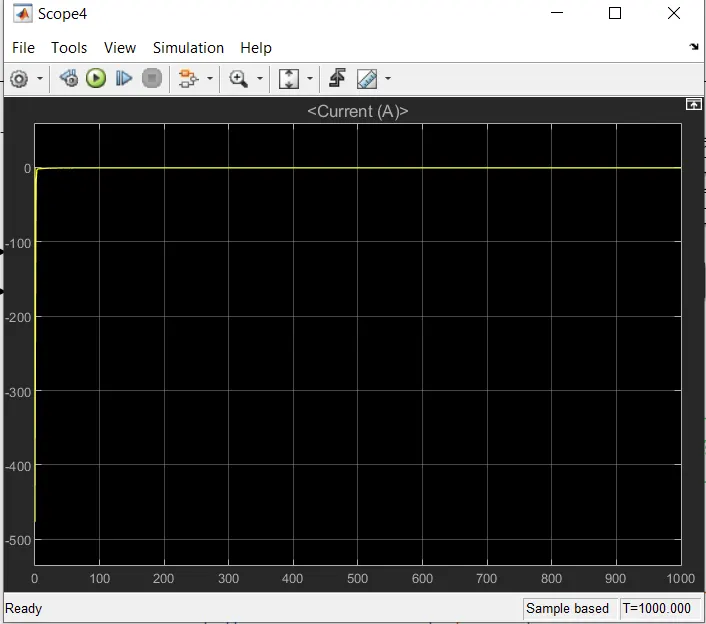
the above graph shows the variation of battery current.
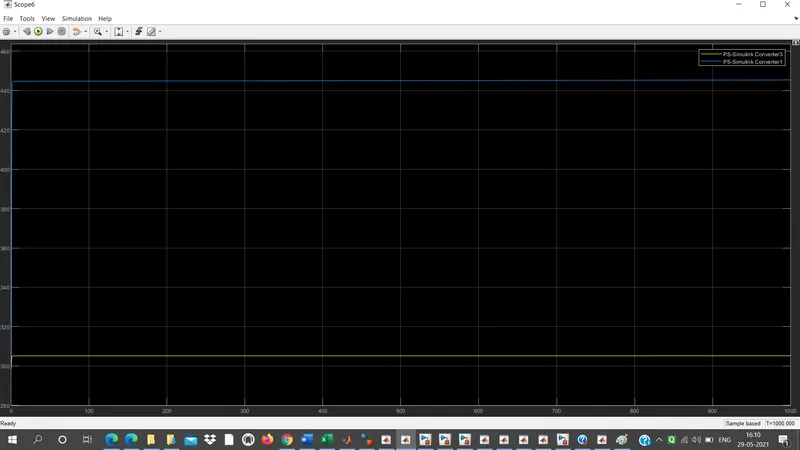
the above graph shows the variation in temperature of motor and motor controller.
blue graph shows the temperature variation of motor controller
yellow graph shows the temperature variation of motor .
CONCLUSION:
Thus all the objectives are achieved and various results are analysed.
REFERENCES: