Final Project: Electric Rickshaw modelling
AIM: To create a model of electric rickshaw using MATLAB.
OBJECTIVES:
- Rear wheels driven by PM brushed type motor
- Assume efficiency points of motor controller and motor
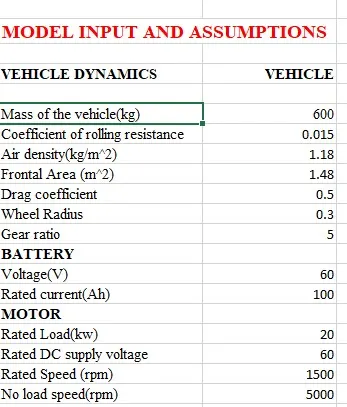
- Make an excel sheet of all input and assumed data
- Results: For any three standard driving cycles show energy consumption, temperature rise of motor and controller for 100 km constant speed driving at 45kmph.
THEORY:
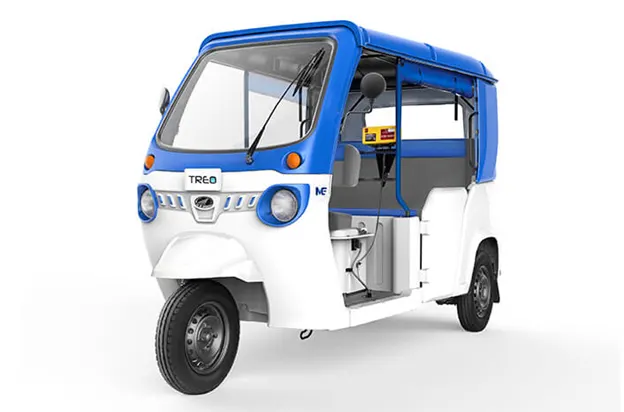
Electric rickshaws (also known as electric tuks or e-rickshaws or toto or e-tricycles) have been becoming more popular in some cities since 2008 as an alternative to auto rickshaws and pulled rickshaws because of their low fuel cost, and less human effort compared to pulled rickshaws. They are being widely accepted as an alternative to petrol/diesel/CNG auto rickshaws. They are three-wheelers powered by an electric motor ranging from 650 to 1400 watts. They are mostly manufactured in India and China, only a few other countries manufacture these vehicles. Battery-run rickshaws could be a low-emitter complementary transport for the low-income people, who suffer most from a lack of transport facility, if introduced in a systematic manner according to experts.
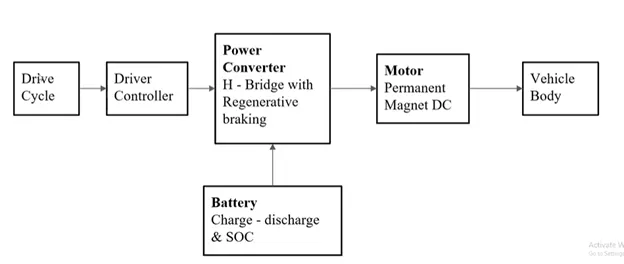
BLOCK DIAGRAM OF E-RICKSHAW
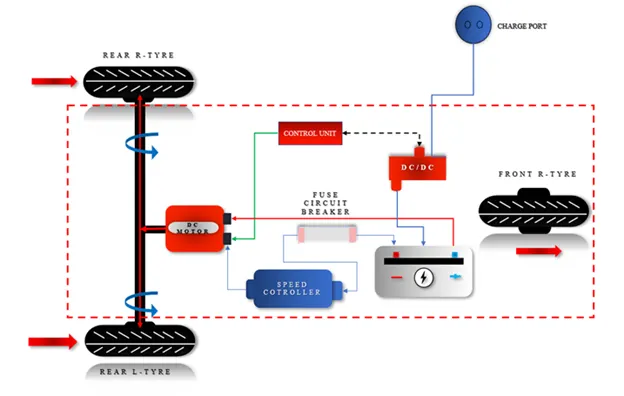
DESIGN OF E-RICKSHAW
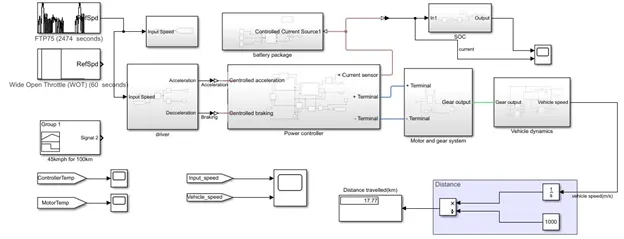
SIMULINK MODEL
DRIVER SUBSYSTEM
The system where the input of the system is given in terms of speed. We have used three driver system to represent the driver input speed. They are FTP75, Wide open throttle and signal builder block.
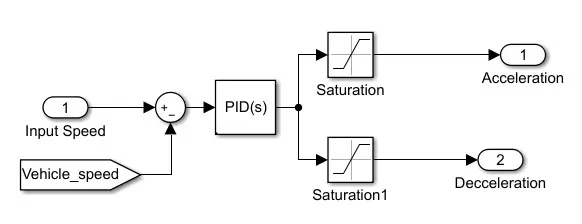
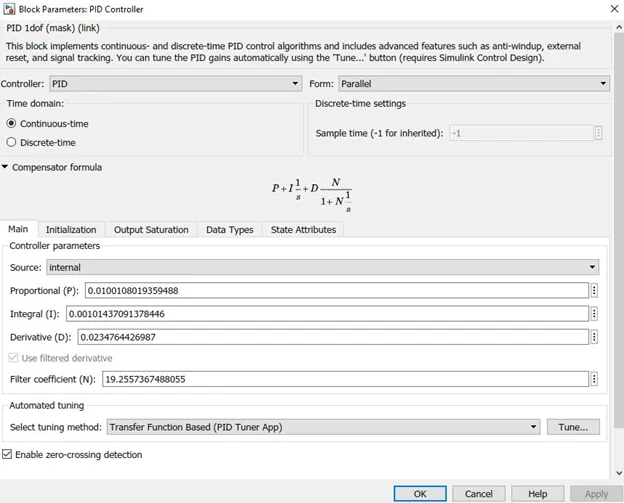
In this we observe that the input speed and final vehicle speed are fed with the sum block. The sum block is given to the PID Controller. The PID Controller decides whether to give acceleration command and deceleration command depending upon the situation.
POWER CONVERTER SUBSYSTEM
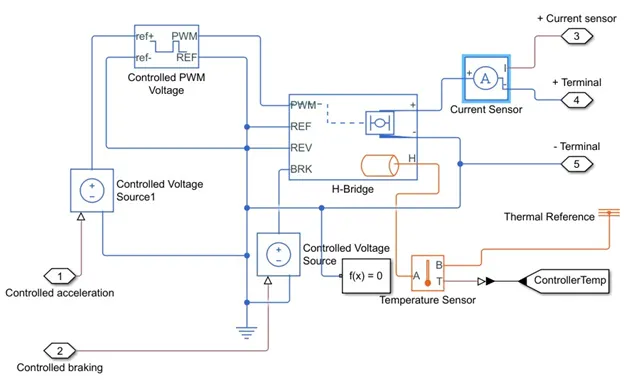
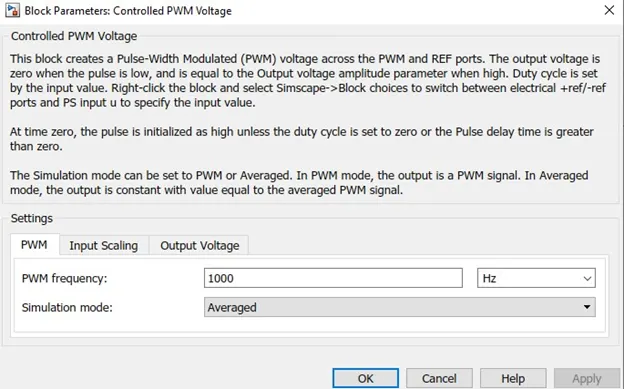
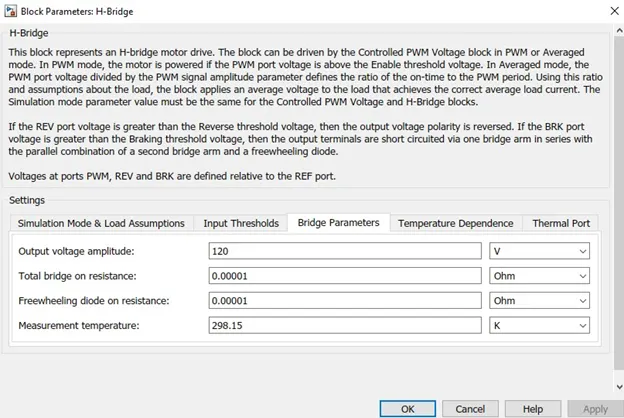
The acceleration command are given to the controlled voltage source. The function of controlled voltage source is to provide the constant voltage at its output regardless of the current pass through it. Both acceleration and deceleration command having separate controlled voltage source block. The acceleration command is given to the controlled PWM Voltage block through controlled voltage source. The PWM voltage block calculates the duty cycle for the voltage coming from the controlled voltage source. The duty cycle generated by PWM block is given to the H-Bridge block. The H-Bridge block is driven by a PWM Voltage block. The H-Bridge block produces the output current to the system. The output current is measured using current sensor. The H-Bridge is connected to the temperature sensor so that temperature of the H-Bridge can be measured while working.
BATTERY PACKAGE
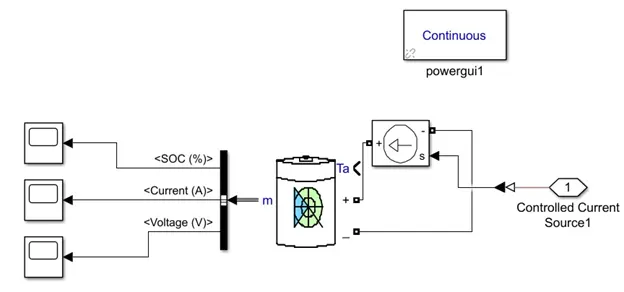
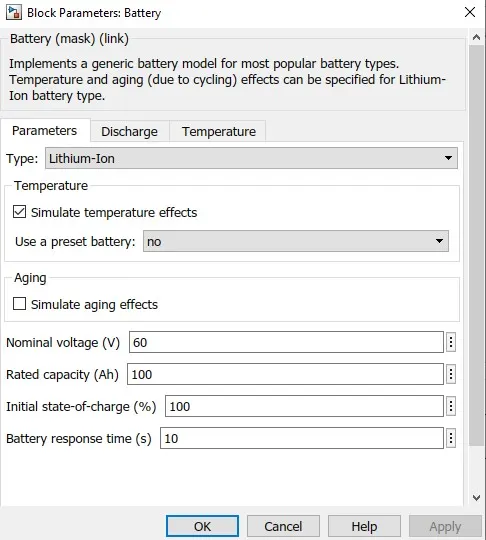
The output current produced from the H-Bridge is given to the controlled current source where it converts the physical signal into equivalent current source and given to the Lithium Ion battery. The Li-ion battery shows the state of charge, change in voltage and current. It also shows the current used from the battery to match the input current signal.
MOTOR AND GEAR SYSTEM
This subsystem is the working of motor of electric rickshaw. It is the transmission part of the system.
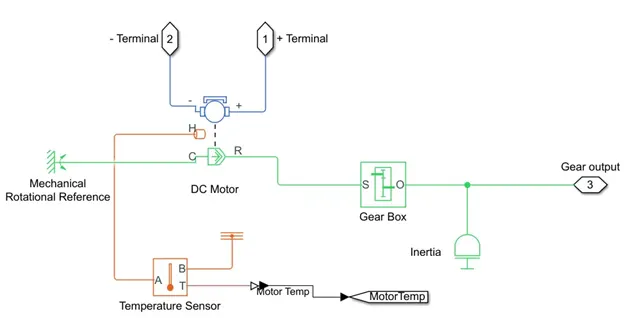
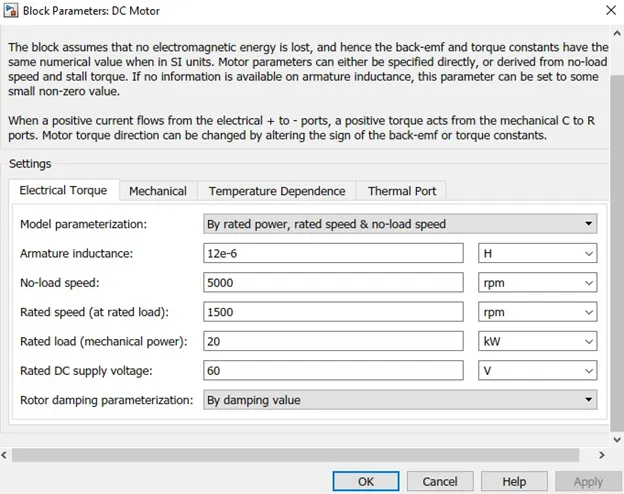
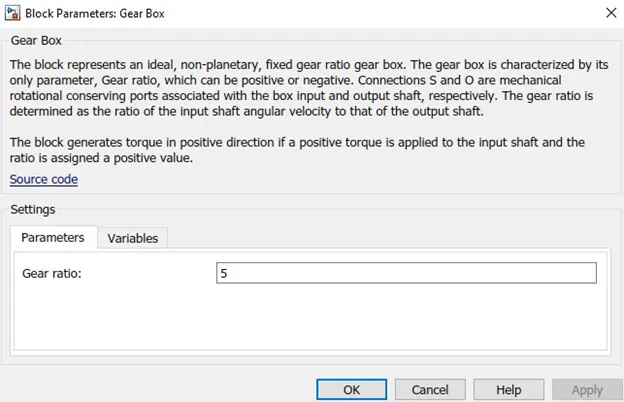
The output current from the H-bridge is connected to the dc motor block. This motor represents the working of the dc motor. The dc motor is connected to the gear box so that power can be transmitted to the vehicle through it. The gear ratio can be increased so that more power can be drawn from the motor to the vehicle. The dc motor is connected to the temperature sensor to measure the temperature of the motor. The temperature sensor is connected to the scope so that the temperature of motor can be viewed.
BATTERY SOC CALCULATION
This system shows the energy used by the battery and how the current is drawn.
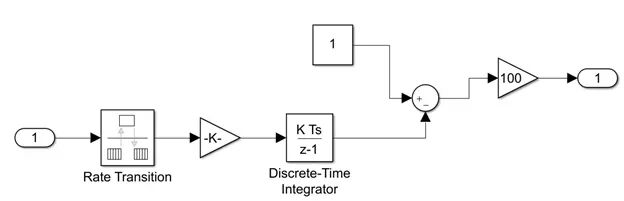
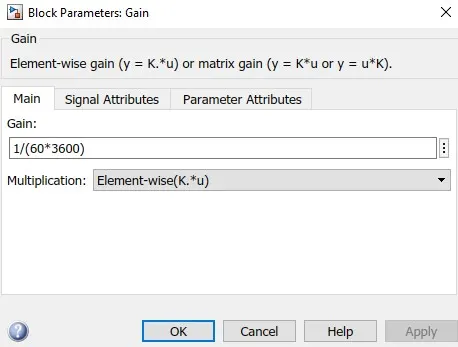
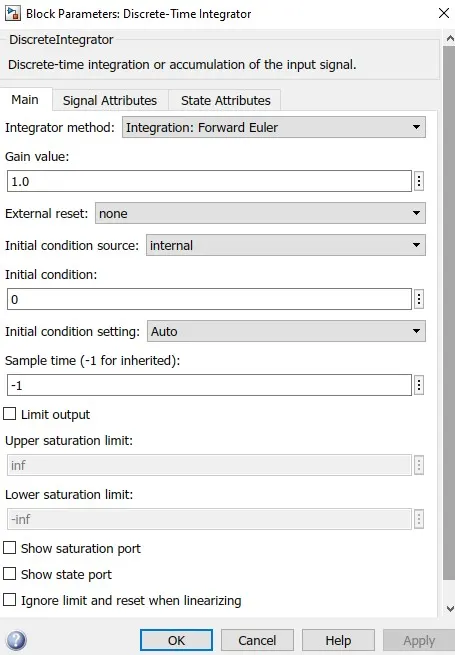
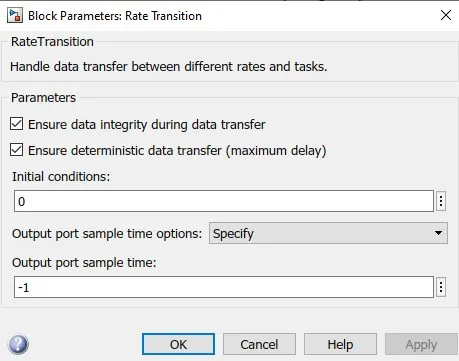
The current signal from the H-Bridge is connected to the Rate transition block. The rate transition block is used to handle the transfer of data between the ports operating at different rates. The signal is then pass through gain block where the 1/ nominal capacity of the battery is denoted. The nominal capacity of the battery = rated dc voltage*3600.The output of the gain block is the product of input signal and 1/nominal capacity of the battery. The output signal from the gain block is then pass through the Discrete-Time Integrator so that it produces the discrete signal. The discrete signal gets subtracted by value 1 and then multiply by 100 so that the battery SOC can be calculated.
VEHICLE DYNAMICS
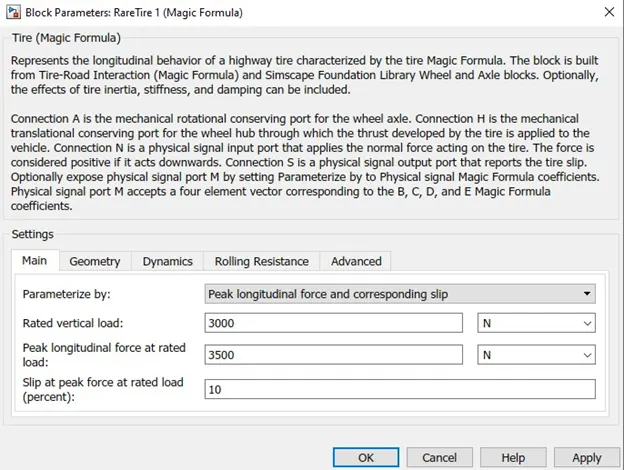
This subsystem shows the all the force acting on the vehicle. The arrangement of the electric rickshaw is shown as it has one frontal tire and two rare tire are interconnected.
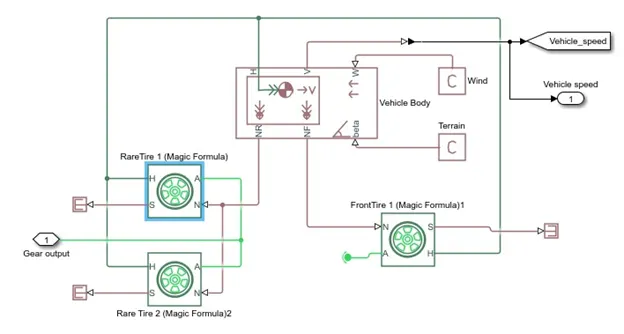
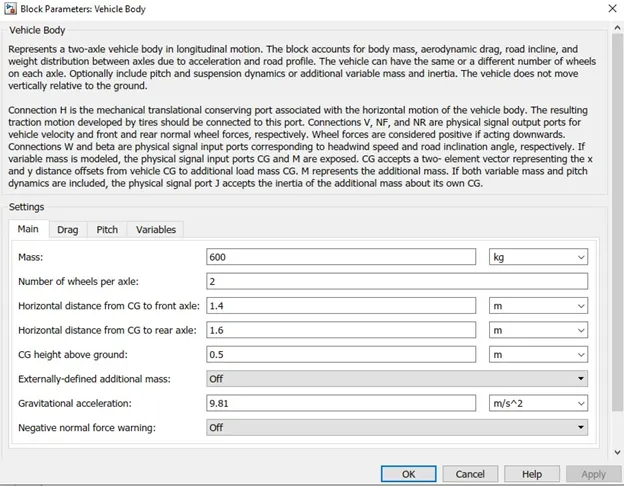
The arrangement of the wheels of the vehicle are represented using tire block. The gear box transmits the power to both the rare tires and frontal tire of the wheel from the dc motor. The frontal and rare tires are connected to the vehicle body block. The vehicle body block represents the two-axle vehicle body in longitudinal motion. The vehicle body calculates all the force acting on the vehicle. Thus the output is the final speed of the vehicle.
DISTANCE CONVERSION FROM M/S to KMPH
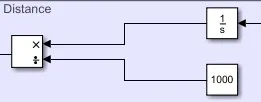
The vehicle speed in m/s produced from vehicle body is pass through integrator block which converts the speed into distance. To convert the m/s into km the output of the integrator should be divide by 1000 so that the distance in m/s is converted into km. The distance can be viewed using scope.
MODEL PARAMETERS
OUTPUT:
- FTP75 DRIVE CYCLE
DISTANCE TRAVELLED USING FTP75 DRIVE CYCLE
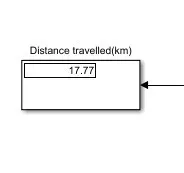
The distance travelled by the vehicle using FTP75 drive cycle is 17.77km with applied voltage of 60V.
VEHICLE SPEED:
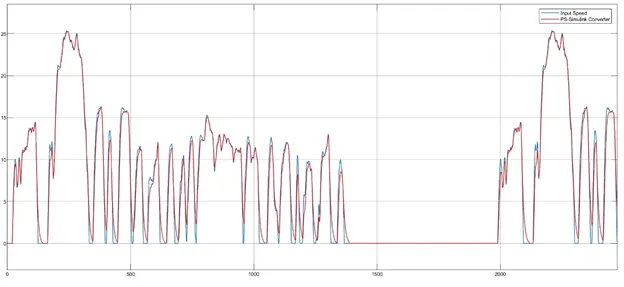
The input speed i.e. the reference speed is shown as blue color while the tracking speed shown as red color. The output speed tracks the reference speed of the vehicle i.e. the velocity of the vehicle is same as that of the standard drive cycle given as input.
SOC
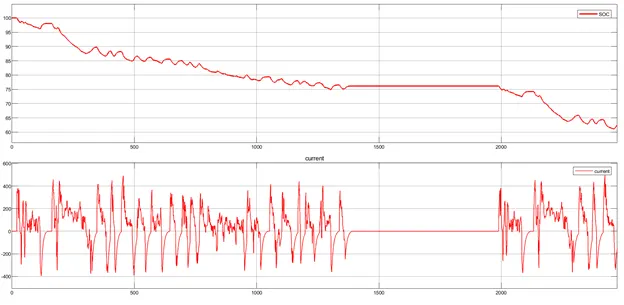
The battery SOC gets decreased to 60% while driving FTP75 drive cycle for 2474seconds.The battery remains same for some period of time as the drive cycle comes to rest position. The curve does not have a steady state as it moves up and down. The curve moving up shows the battery gets charged and moving down denotes the battery gets discharged. The battery gets charged by regenerative braking.
CONTROLLED TEMPERATURE
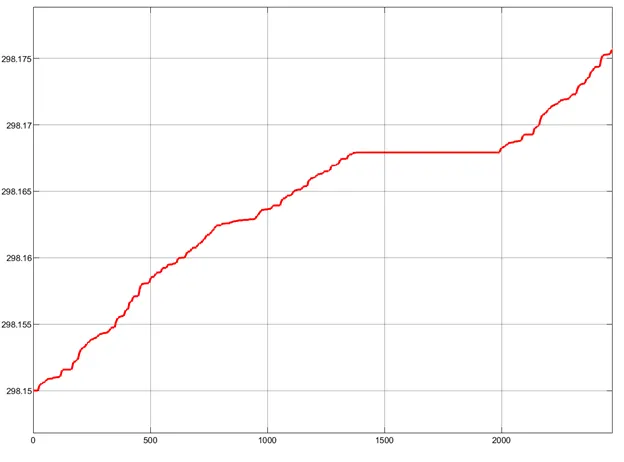
The temperature of the controller increases as the speed of the drive cycle increases. For the period of 1400 to 2000 temperature remains same. The initial temperature of the controller is 298.15K and the final temperature of the controller is 298.175K.This shows that the temperature of the controller gets increased slightly for the period of 2474 sec.
MOTOR TEMPERATURE
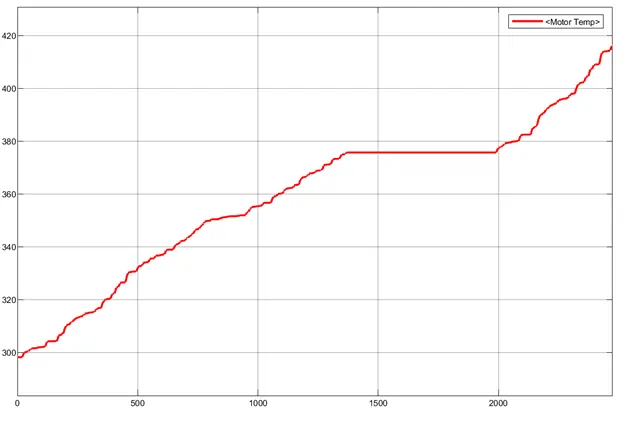
The temperature of the motor increases as the speed gets increased so that the vehicle can cover more distance in less span of time. The temperature of the motor remains same for some period of time. This shows that the motor is standstill as the vehicle does not produce drive cycle. The initial temperature was 298K and final temperature was 410K at the end of the drive cycle.
- WIDE OPEN THROTTLE
DISTANCE TRAVELLED
VEHICLE SPEED
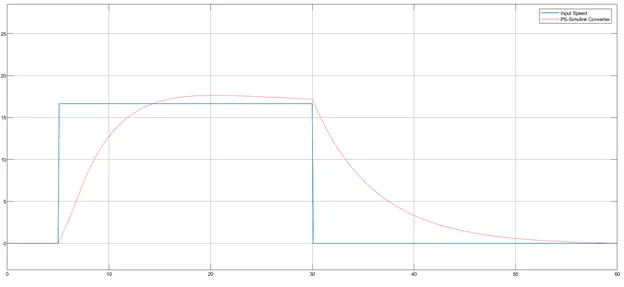
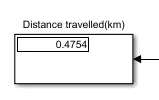
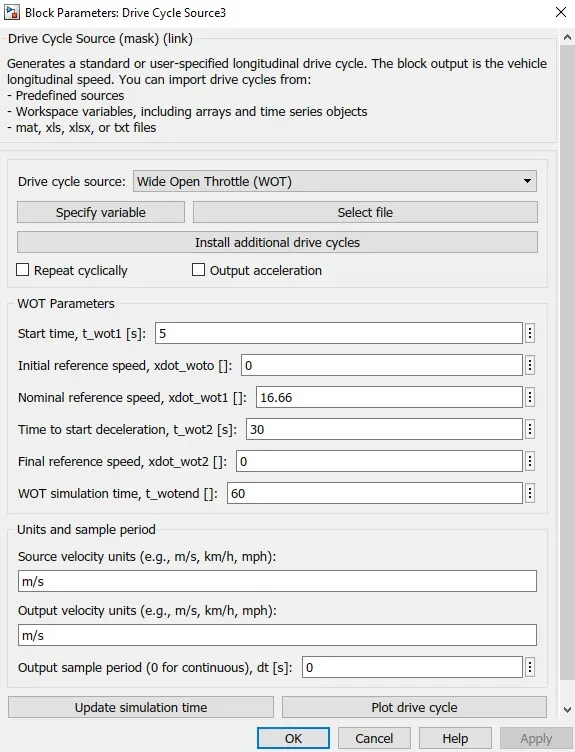
The distance travelled by the vehicle using wide open throttle drive cycle is 0.4754km with applied voltage of 60V. The wide open throttle runs for 60sec.
SOC
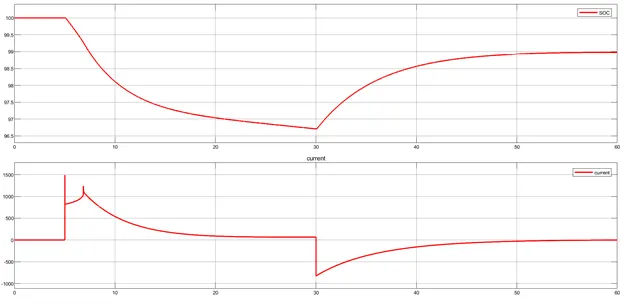
We observe that the battery SOC is 99% at the end of the simulation. At 30th second the battery SOC gets decreased to 96.7 but due to regenerative braking the battery gets charged and reaches to 99%.
CONTROLLER TEMPERATURE
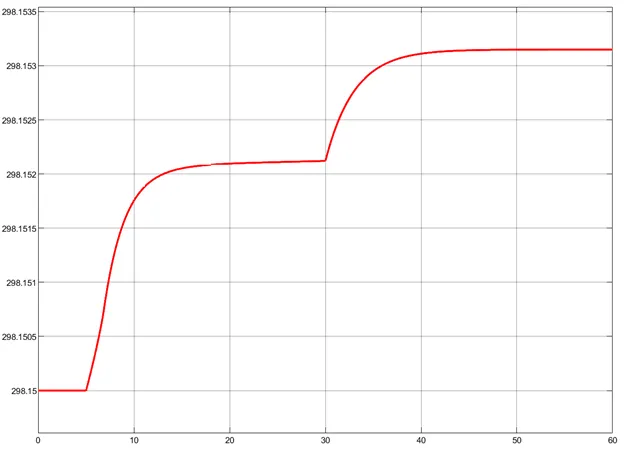
We observe that the temperature gets increased as the vehicle speed increased. Temperature remains constant as the vehicle moves in constant speed. In WOT condition deceleration takes place but temperature of controller increases instead of decreases because regenerative braking takes place. Due to the regenerative braking the motor act as generator at that time and charges the battery while the controller parameters controls the generator parameters so that temperature increases. The maximum temperature of the motor is 298.157K.
MOTOR TEMPERATURE
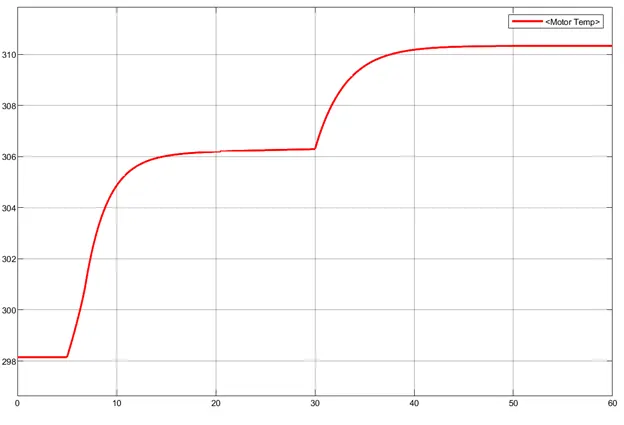
We observe that the temperature gets increased as the vehicle speed increased. Temperature remains constant as the vehicle moves in constant speed. In WOT condition deceleration takes place but temperature of controller increases instead of decreases because regenerative braking takes place. Due to the regenerative braking the motor act as generator at that time and charges the battery. The maximum temperature attained by the motor is 313K.
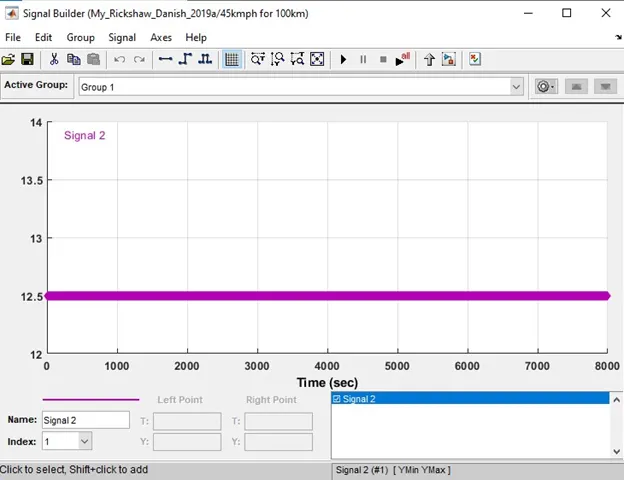
SIGNAL BUILDER
DISTANCE COVERED
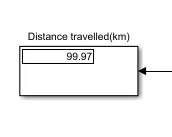
The distance travelled by vehicle is 99.97 for signal builder drive cycle.
VEHICLE SPEED
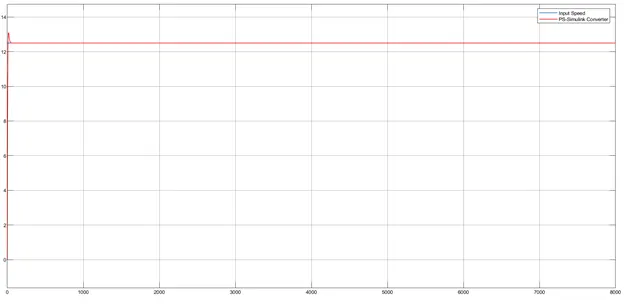
As per signal builder input value the output tracks 100% accurately. The above figure shows the output achieves the 45kmph constant speed upto 8000sec to cover the distance of 100km.
SOC
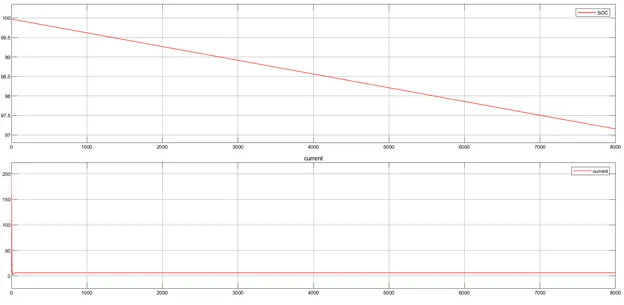
The state of charge of the battery decreases throughout 100km range. The state of charge is 97% after 100km.
CONTROLLER TEMPERATURE
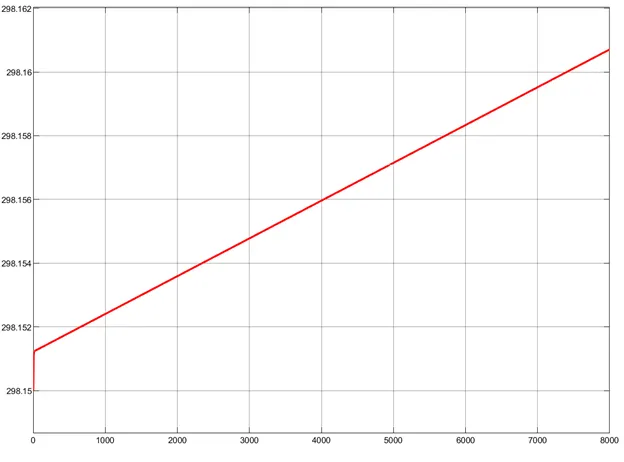
For constant speed the temperature of the controller increases linearly. The maximum temperature attained by the controller is 298.16 K. As the distance travelled increases temperature of controller also increases.
MOTOR TEMPERATURE
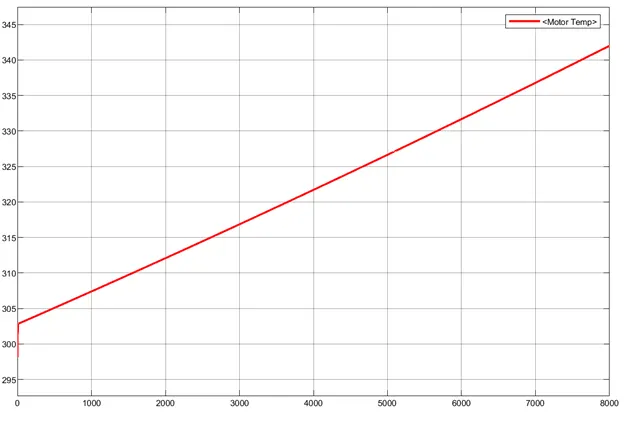
For constant speed the temperature of the motor get increases. The maximum temperature attained by the motor is 342K.
RESULT:
Thus the model of electric rickshaw has been successfully created and simulated using MATLAB. The results has been plotted for the energy consumption, temperature rise of motor and controller for 100 km constant speed driving at 45kmph.