Final Project: Electric Rickshaw modelling
Aim: Create a detailed MATLAB simulink model of an electric rickshaw.
Objective:
- Run the model for standard driving cycles and determine the energy consumption, temperature rise in motor and controller.
- Run the model e-Rickshaw at 45 Kmph for 100 Km and determine the energy consumption, temperature rise in motor and controller.
Electric Rickshaw:
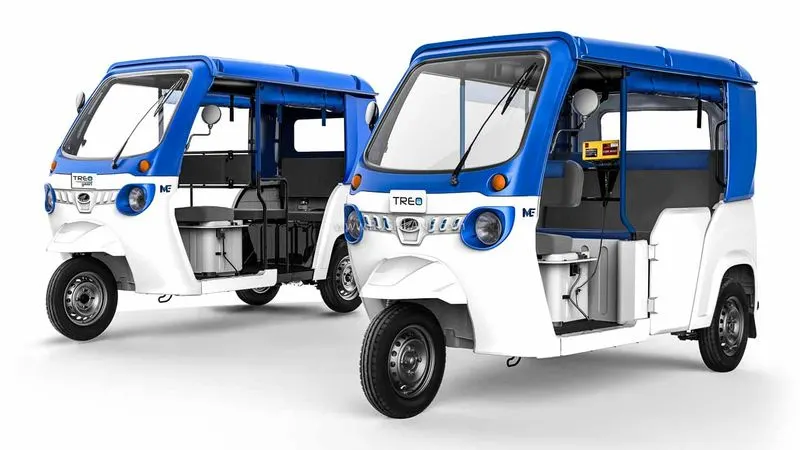
It has been becoming more popular in some cities since 2008 as an alternative to auto rickshaws and pulled rickshaws because of their low fuel cost, and less human effort compared to pulled rickshaws. They are being widely accepted as an alternative to petrol/diesel/CNG auto rickshaws. They are three-wheelers powered by an electric motor ranging from 650 to 1400 Watts. They are mostly manufactured in India and China. Battery-run rickshaws could be a low-emitter complementary transport for the low-income people, who suffer most from a lack of transport facility.
The preference of electric auto-rickshaw over the conventional ones can be accredited to the several benefits like the low operational cost of the auto-rickshaw. Over prolonged use, this equates to high savings for the operators. The benefit of almost zero-emission is a great plus point for a city. India is the largest market for auto-rickshaw, which may throw up a huge demand for electric auto-rickshaws and e-rickshaws taking into account zero-emission. According to the Society of Manufacturers of Electric Vehicles, an electric three-wheeler segment grew 21 per cent in 2018-19 when a sale of 6.3 lakhs vehicles was registered.
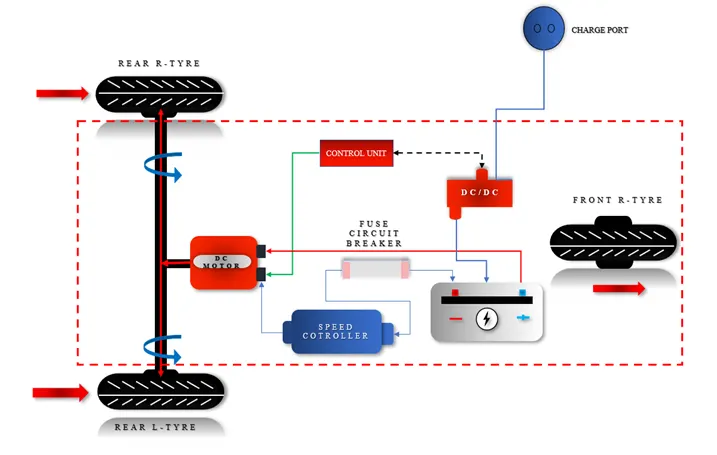
Block Diagram of Electric Rickshaw Model:
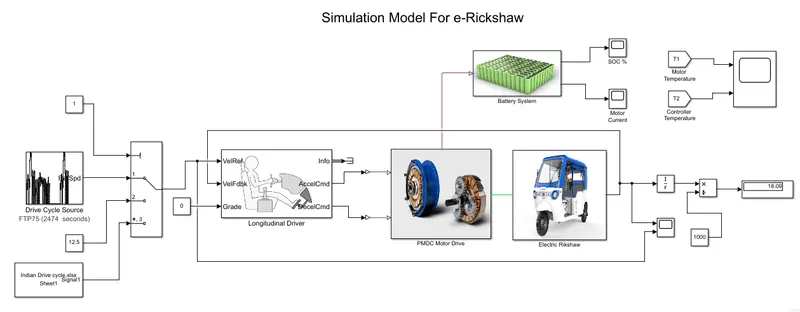
Simulink Model:
Drive Cycle:
FTP75:
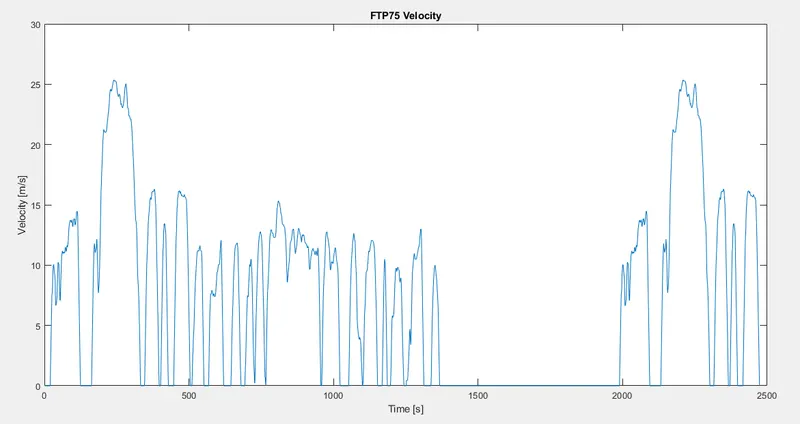
The FTP cycle (for Federal Test Procedure) has been created by US EPA (Environmental Protection Agency) to represent a commuting cycle with a part of urban driving including frequent stops and a part of highway driving.
Drive Cycle Characteristic:
- Duration: 2474 sec
- Distance: 17.77 Km
- Average Speed: 34.12 Kmph
- Maximum Speed: 91.25 Kmph
Wide Open Throttle: (WOT)
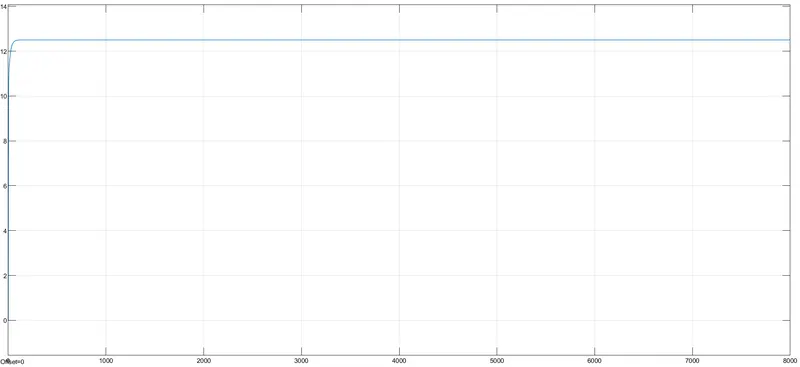
It is also called full throttle, is the fully opened state of a throttle on a vehicle. The term also, by extension, usually refers to the maximum-speed state of running the vehicle. For this model we take WOT at 45 Kmph i.e. 12.5 m/sec.
Indian Driving Cycle (IDC) for 2W & 3W:
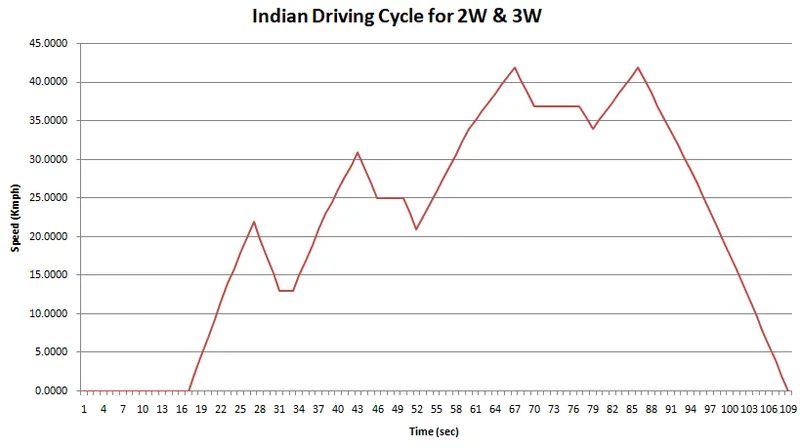
Drive Cycle Characteristics:
- Duration: 108 sec
- Distance: 3.9 Km
- Maximum Speed: 42 Kmph
Longitudinal Driver:
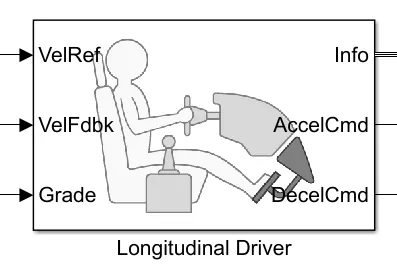
The Longitudinal Driver block implements a longitudinal speed-tracking controller. Based on reference and feedback velocities, the block generates normalized acceleration and braking commands that can vary from 0 through 1. You can use the block to model the dynamic response of a driver or to generate the commands necessary to track a longitudinal drive cycle.
Thermal Mass:
Thermal mass describes a material's capacity to absorb, store and release heat. For example water and concrete have a high capacity to store heat and are referred to as 'high thermal mass' materials. Insulation foam, by contrast, has very little heat storage capacity and is referred to as having 'low thermal mass'.
H-Bridge Motor Controller:
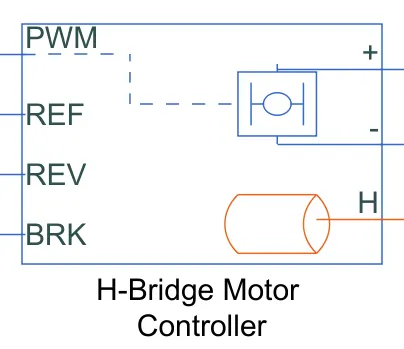
This block represents an H-bridge motor drive. The block can be driven by the Controlled PWM Voltage block in PWM or Averaged mode. In PWM mode, the motor is powered if the PWM port voltage is above the Enable threshold voltage. In Averaged mode, the PWM port voltage divided by the PWM signal amplitude parameter defines the ratio of the on-time to the PWM period. Using this ratio and assumptions about the load, the block applies an average voltage to the load that achieves the correct average load current. The Simulation mode parameter value must be the same for the Controlled PWM Voltage and H-Bridge blocks. H port is a thermal port.
H-bridge motor controller parameters:
- Output Voltage Amplitude: 1000 V
- Thermal Mass: 20000 J/K
- Initial Temperature: 30°C
Controlled PWM Voltage:
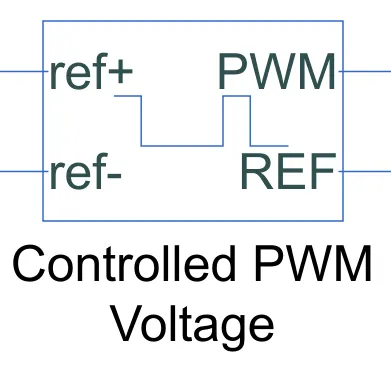
This block creates a Pulse-Width Modulated (PWM) voltage across the PWM and REF ports. The output voltage is zero when the pulse is low, and is equal to the Output voltage amplitude parameter when high. Duty cycle is set by the input value.
Permanent Magnet DC Motor: (PMDC Motor)
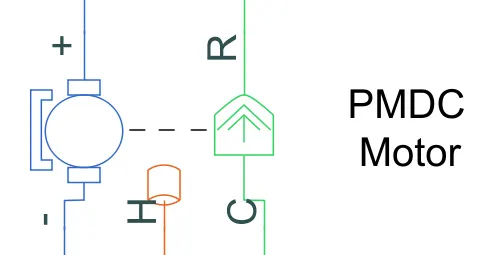
The block assumes that no electromagnetic energy is lost, and hence the back-emf and torque constants have the same numerical value when in SI units. Motor parameters can either be specified directly, or derived from no-load speed and stall torque. If no information is available on armature inductance, this parameter can be set to some small non-zero value. H port is a thermal port for measuring the temperature.
PMDC Motor Parameters:
- No Load Speed: 1000 rpm
- Rated Speed (at rated load): 2000 rpm
- Rated Load (Mechanical Power): 1000 rpm
- Rated DC Voltage Supply: 200 V
- Thermal Mass: 50000 J/K
- Initial Temperature: 30°C
Temperature Sensors:
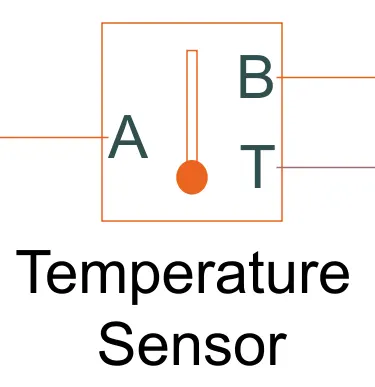
The Temperature Sensor block represents an ideal temperature sensor, that is, a device that determines the temperature differential measured between two points without drawing any heat.
Connections A and B are thermal conserving ports that connect to the two points where temperature is being monitored. Port T is a physical signal port that outputs the temperature differential value.
Simple Gear:
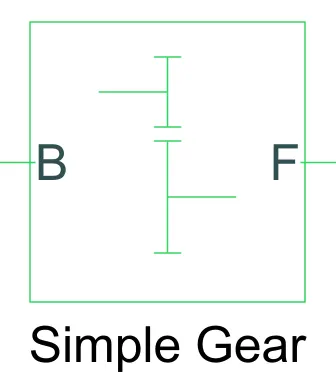
The Simple Gear block represents a gearbox that constrains the connected driveline axes of the base gear, B, and the follower gear, F, to corotate with a fixed ratio that you specify. You choose whether the follower axis rotates in the same or opposite direction as the base axis. If they rotate in the same direction, the angular velocity of the follower, ωF, and the angular velocity of the base, ωB, have the same sign. Follower (F) to base (B) teeth ratio is 2.
Vehicle Body:
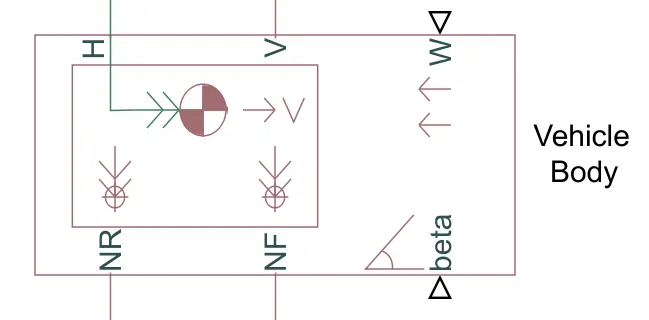
The Vehicle Body block represents a two-axle vehicle body in longitudinal motion. The vehicle can have the same or a different number of wheels on each axle. The vehicle wheels are assumed identical in size. The vehicle can also have a center of gravity (CG) that is at or below the plane of travel. The block accounts for body mass, aerodynamic drag, road incline, and weight distribution between axles due to acceleration and road profile.
Vehicle Body Parameters:
- Vehicle Mass: 500 Kg
- Frontal Area: 3 m^2
- Drag Coefficient: 0.4
- Air Density: 1.25 Kg/m^3
Tire:
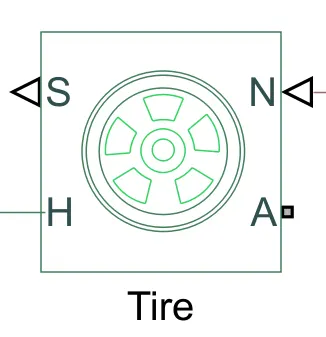
Represents the longitudinal behavior of a highway tire characterized by the tire Magic Formula. The block is built from Tire-Road Interaction (Magic Formula) and Simscape Foundation Library Wheel and Axle blocks. Optionally, the effects of tire inertia, stiffness, and damping can be included.
Tire Parameters:
- Rolling Radius: 0.3 m
- Rolling Resistance: on
- Resistance Model: Constant Coefficient
- Constant Coefficient: 0.015
Battery:
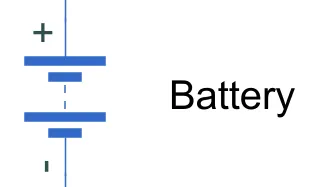
This block models a battery. If you select Infinite for the Battery charge capacity parameter, the block models the battery as a series internal resistance and a constant voltage source. If you select Finite for the Battery charge capacity parameter, the block models the battery as a series internal resistance plus a charge-dependent voltage source. I assume total battery power capacity is 20 KWh.
Battery Parameters:
Battery nominal voltage: 200 V
Battery charge capacity: Finite
Ampere-hour rating: 100 Ah
SOC Estimation:
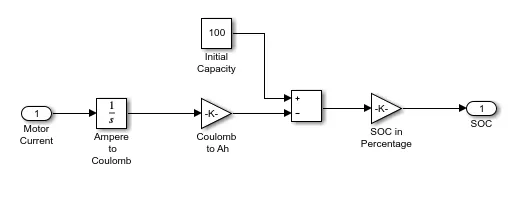
The above figure shows inside the SOC estimation system. In this system first convert motor current into charge by using integral block then convert into charge to capacity and subtract with initial capacity of battery. And after that it's converted into SOC percentage.
PMDC Drive:
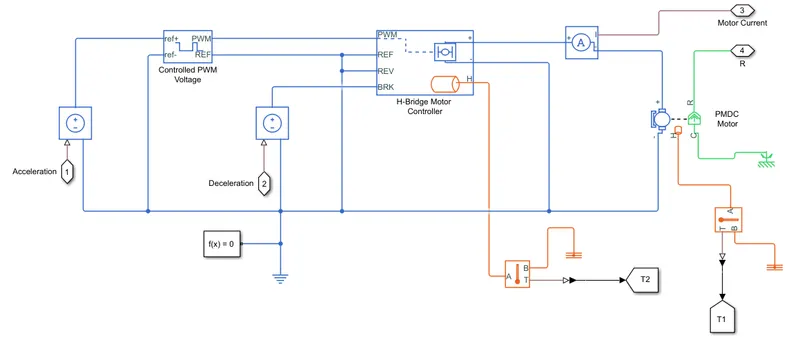
We can see that in the above figure inside the PMDC drive subsystem. For this system I give the acceleration and deceleration command and determine the temperature of the motor and its controller. Similarly the motor outputs power connection to the next subsystem.
Electric Rickshaw:
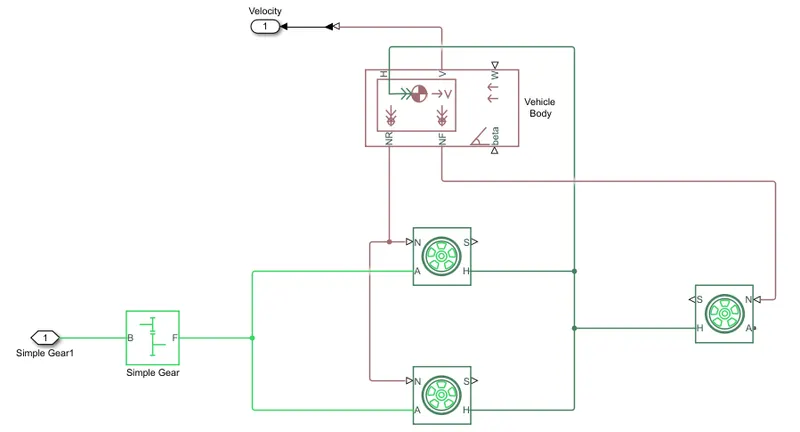
The above figure we can see that inside the electric rickshaw subsystem. In this subsystem we determine the vehicle velocity.
Case 1: FTP75 Drive Cycle
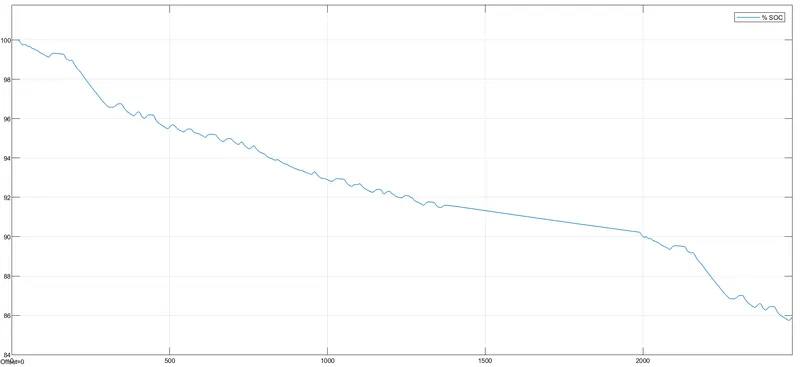
FTP75 drive cycle duration is 2474 sec that is why our simulation time for this case is also 2474 sec. Initial battery SOC is full.
Result:
e-Rickshaw Speed
Motor and Controller Temperature
Battery SOC in Percentage
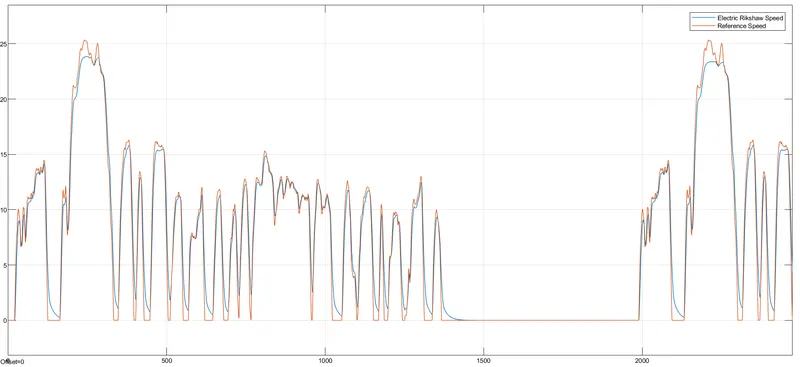
- We can see that in the above first figure, e-Rickshaw speed follows the reference speed of the drive cycle. After running the simulation it travelled 18.1 Km.
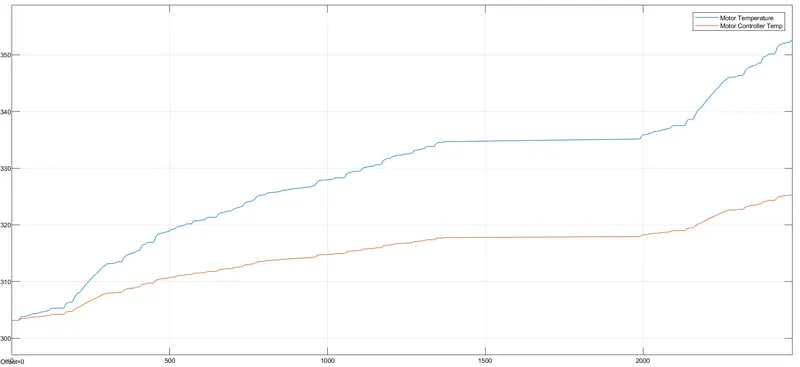
- In the second figure we can see the temperature of the motor and its controller. The motor temperature increased from 303 K to 353 K and the controller temperature varied from 303 K to 325 K.
- Similarly in the third figure shows the battery SOC in percentage. After running the whole simulation battery reduces from 100% to 85.85%, which means energy required to travel the 18.1 Km is 2.83KWh.
- When drive cycle speed reduces at that time battery gains some energy in the form of regenerative energy, similarly we can see that slight fluctuation happens in the temperature also.
Case 2: Wide Open Throttle (WOT)
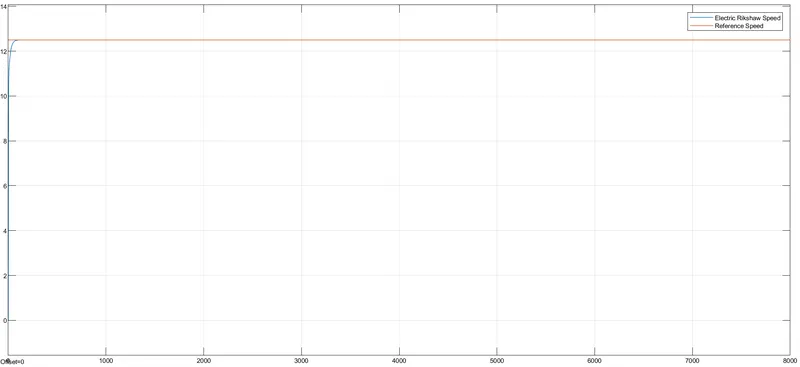
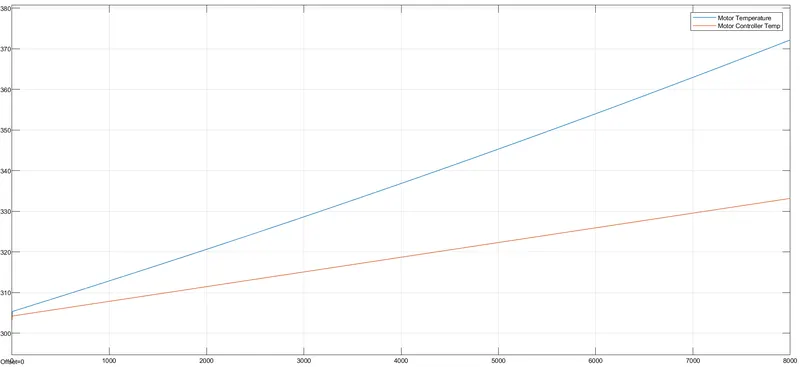
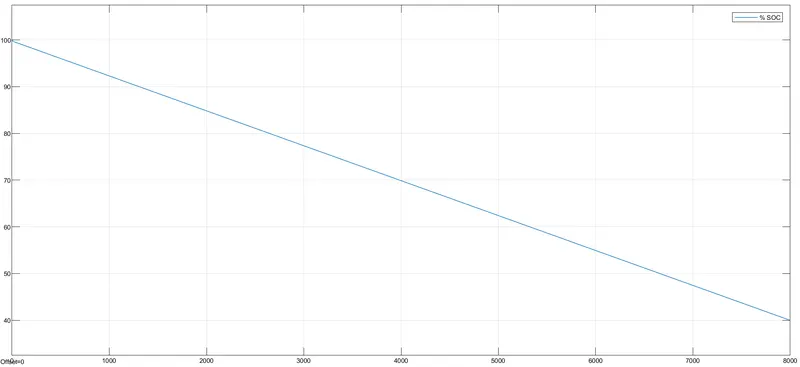
In this case we take the WOT test at 45 Kmph i.e. 12.5 m/sec for 100 Km. So the run time for this case is 8000 sec and the initial capacity of the battery is full.
Result:
e-Rickshaw Speed
Motor and Controller Temperature
Battery SOC in Percentage
- The above first figure shows the WOT test speed of e-Rickshaw with reference speed. e-Rickshaw reach exactly 45 Kmph i.e. 12.5 m/sec and follow the reference speed upto 100 Km.
- In the 8000 sec it's covered distance is 99.94 Km it does not reach exactly 100 Km because in the starting e-Rickshaw required some time to reach 12.5 m/sec.
- The second figure shows the motor and its controller temperature. The motor temperature is 372 K and the controller temperature is 333 K.
- For this WOT test required 60% of battery pack energy i.e. 12 KWh. Because in this case e- Rickshaw runs at constant 45 Kmph speed, battery SOC is drastically reduced and there is no regeneration happening and similarly no slight fluctuation in the temperature.
Case 3: Indian Driving Cycle (IDC)
IDC drive cycle duration is 108 so for this model I take run time as 110 sec. Similarly the initial battery SOC is 100%.
Results:
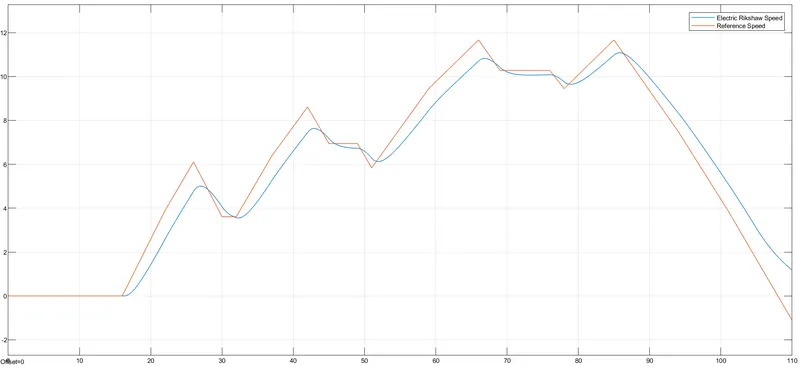
e-Rickshaw Speed
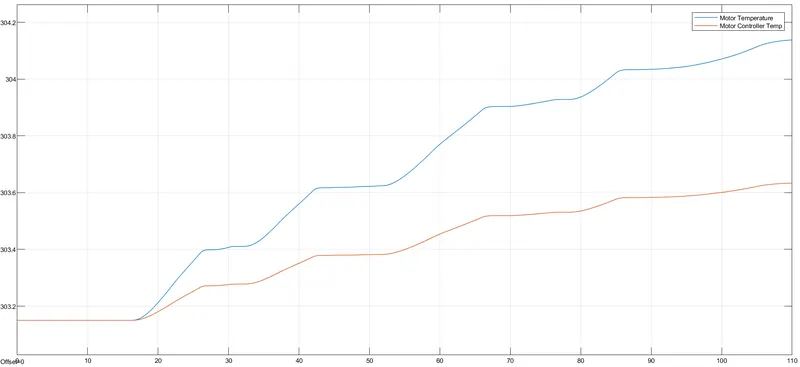
Motor and Controller Temperature
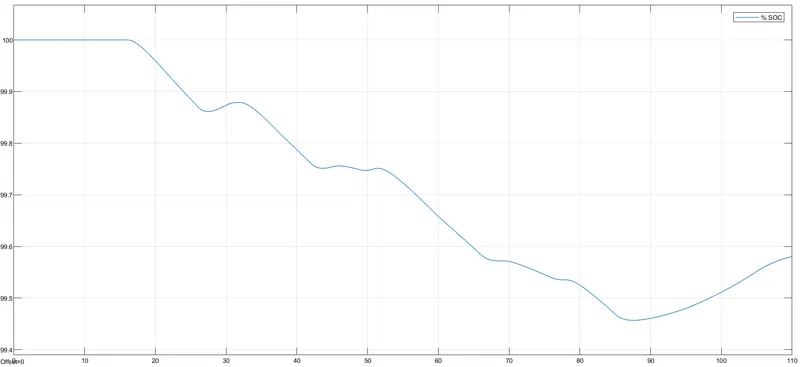
Battery SOC in Percentage
- We can see that in the first figure e-Rickshaw speed and drive cycle reference speed. The e-rickshaw speed is trying to follow the reference speed but because of small drive cycle duration and sudden changes in the speed, it does not exactly meet the reference speed.
- In this case e-Rickshaw travelled 0.65 Km in 108 sec. Because of less drive cycle duration, temperature of the motor and its controller do not vary significantly, and SOC is also slightly changed.
- The motor temperature is 304.1 K and the controller temperature is 303.6 K. Similarly SOC reduced upto 99.59% only.
Attachment:
- e-Rickshaw simulation model file name ‘Final_Project_e_Rickshaw.slx’
- Indian Driving Cycle (IDC) excel sheet file name ‘Indian Drive cycle.xlsx’
- Assumption Value list in excel file name ‘Assumption Parameters.xlsx’