Final Project: Electric Rickshaw modelling
Electric rickshaws also known as e-rickshaws have been gaining popularity in several cities as a low-cost alternative to auto rickshaws and pulled rickshaws since 2008. They require less human effort than pulled rickshaws. They are commonly acknowledged as a viable alternative to auto rickshaws powered by gasoline, diesel, or compressed natural gas. They are electric three-wheelers with motors ranging from 650 to 1400 Watts. They are primarily produced in India and China. Battery-powered rickshaws could be a low-emitter alternative mode of transportation for low-income persons who are most affected by a lack of transportation options.The chassis of these rickshaws are of tubular chassis(mild steel),and consist of 3 wheels with a different mechanism at the rear wheels.
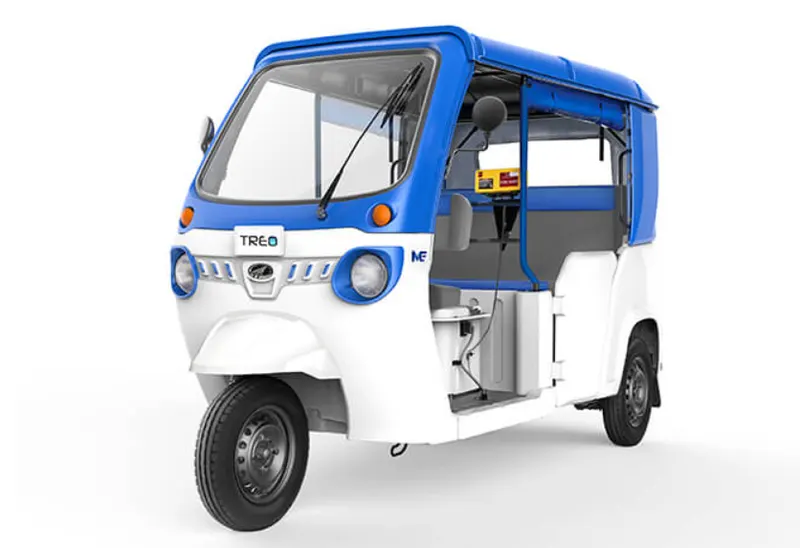
The body design from popular Chinese version is of very thin aluminium or iron sheets,There are vehicles which made of fibres which have greater strength and durability and posses lower maintanence cost which is popular in India.The design of the vehicles varies from load carriers,passenger transport with soft top,It consist of a controller unit,They are manufactured on the basis of current and voltage output and the no. of mosfet used.The battery types that are popular are led acid battery and Lithium ion batteries.Weight of the e-rickshaw and other parameters should be also considered for developing an e-rickshaw.
AIM
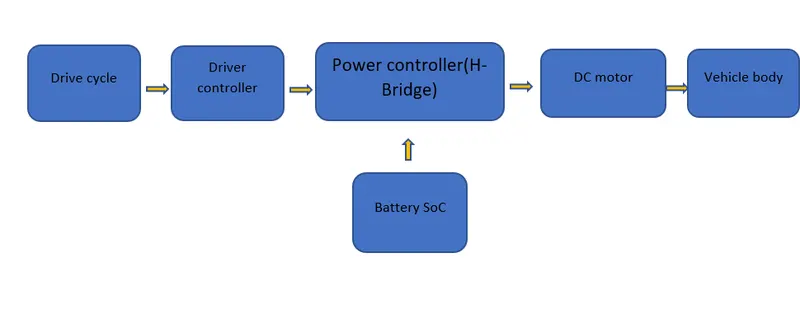
In this project,we will create a matlab model of an electric rickshaw which gives the power from a permanent magnet brush type DC motor and an optimised lithium ion battery.We have to learn about how an ev works and what elements are needed for the operation of an electric rickshaw,The aim is run the model in different driving conditions by using the help of three standard driving cycles and analysing their energy consumption,and the temperature rise of the motor and motor controller for a distance of 100km with driving in a constant speed of 45 kmph.
Main system-
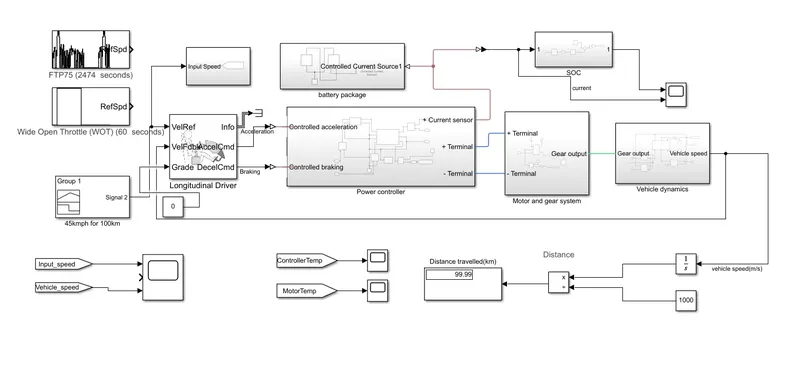
In the figure we can see the main system of the electric autorickshaw.In here we can see the subsystems and we have to know the operations and conditions at which the subsystems are working wrt to each other.And the we have to examine each subsystems and the components and their respective configuration.
Longitudinal Driver-
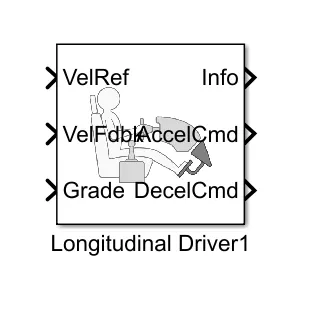
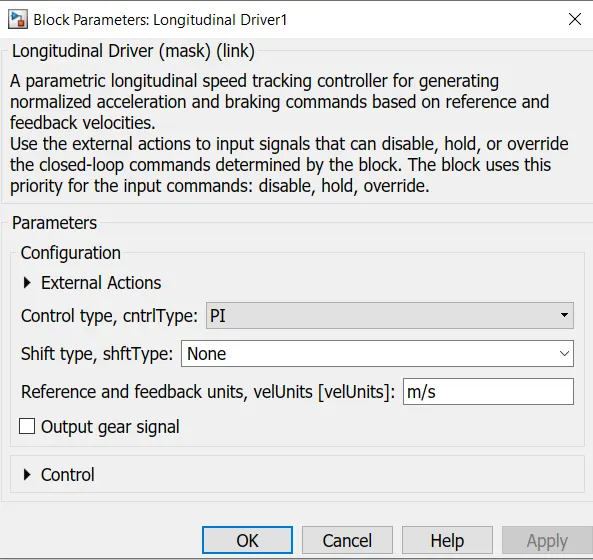
By using this block we will get the normal response from the driver which is provided as acceleration and controlled braking ie deceleration for the vehicle,We can give the parameters as VelRef from the respective drive cycle source,and the feedback from the vehicle body to the longitudinal driver block.By the external actions to the input the system can hold or override the operation,we have change the reference unit to km/hr as we are analysing the driving condition.We are giving the grade of the vehicle as zero.The info port is terminated as we don’t need it now.We have used PI controller type in this block and the reference and feedback units are in m/s.
Power controller subsystem-
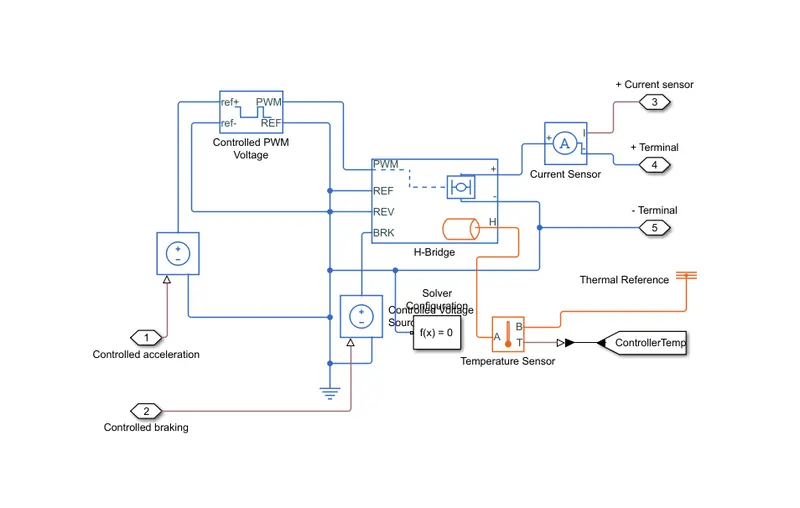
The subsystem comprises of mainly H-bridge and a controlled pwm voltage block ,
In the controlled pwm voltage,This block produce pwm voltage with Because pulse width modulation (PWM) signals are robust in the presence of noise, they are used in many industrial applications.
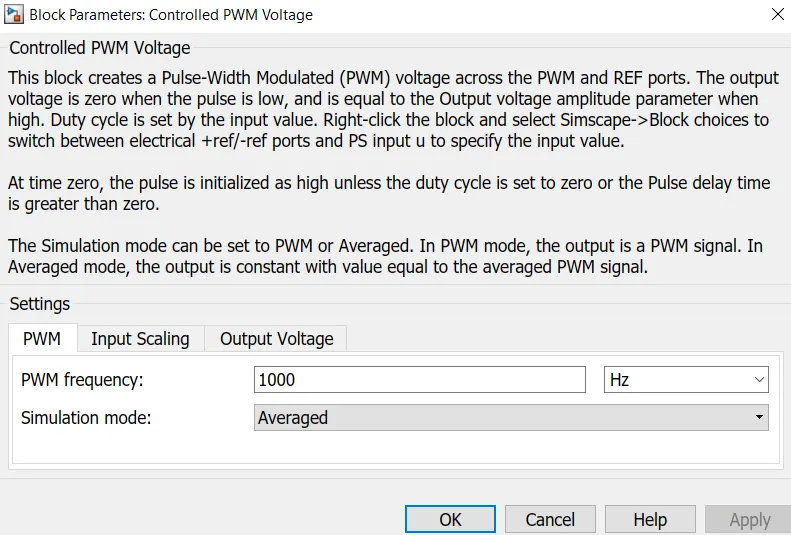
The PWM and REF ports are used to generate a Pulse-Width Modulated (PWM) voltage. When the pulse is low, the output voltage is zero; when the pulse is high, the output voltage is equal to the Output voltage amplitude parameter.The pwm frequency is set to 1000Hz,And the simulation mode is average.The output voltage is set to a value of 60V.
This block represents an H-bridge motor drive. The PWM or Averaged mode of the Controlled PWM Voltage block can be used to drive the block.
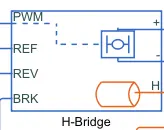
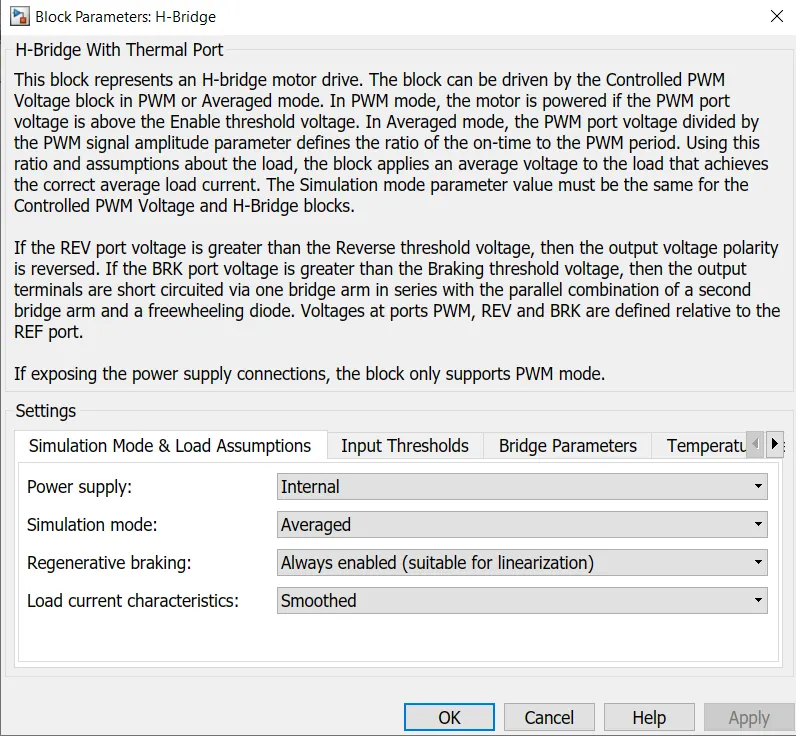
The motor is driven in PWM mode if the PWM port voltage is greater than the Enable threshold voltage. The PWM port voltage divided by the PWM signal amplitude parameter defines the ratio of the on-time to the PWM period in Averaged mode. Using this ratio and assumptions about the load, the block delivers an average voltage to the load that creates the correct average load current. Controlled PWM Voltage and H-Bridge blocks must have the same Simulation mode parameter value. The thermal port has an associated thermal mass and initial temperature.Resistance is assumed to vary linearly between the two measurement temperatures. Extrapolation is used for temperatures outside of this range, except for when simulating in averaged mode with discontinuous load current characteristics.The Output voltage amplitude is given as same as pwm block ie 60V.And the simulation mode is set to average.
Solver configuration block-
By this block it specifies the solver parameters in the model before the simulation is engaged A single Solver Configuration block must be attached to each topologically distinct Simscape block diagram.
Current sensor-
When current travels through a conductor, it creates a magnetic field that is proportional to the current. The sensor then outputs a voltage or current that may be measured by a metre linked to the sensor and converted to the amount of current flowing through the conductor.
Temperature sensor
The Temperature Sensor block illustrates an ideal temperature sensor, i.e. a device that determines the temperature difference between two places without generating heat. Connections A and B are thermally efficient ports that connect to the two temperature monitoring sites.
Motor and gear subsystem
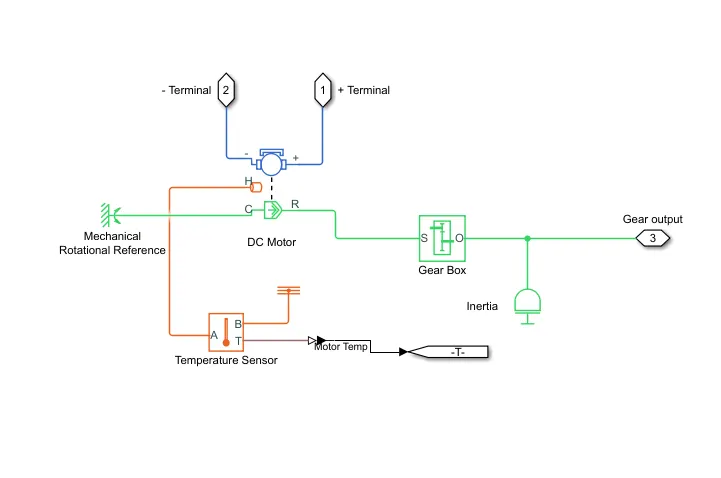
The DC Motor block uses the equivalent circuit model to depict the electrical and torque properties of a DC motor: When you set the Model parameterization option to equivalent circuit parameter, you provide the equivalent circuit parameters for this model.
The back-emf and torque constants have the same numerical value when represented in SI units since the block assumes no electromagnetic energy is wasted. No-load speed and stall torque can be used to calculate motor parameters. This option can be assigned to a tiny non-zero value if no information on armature inductance is available.
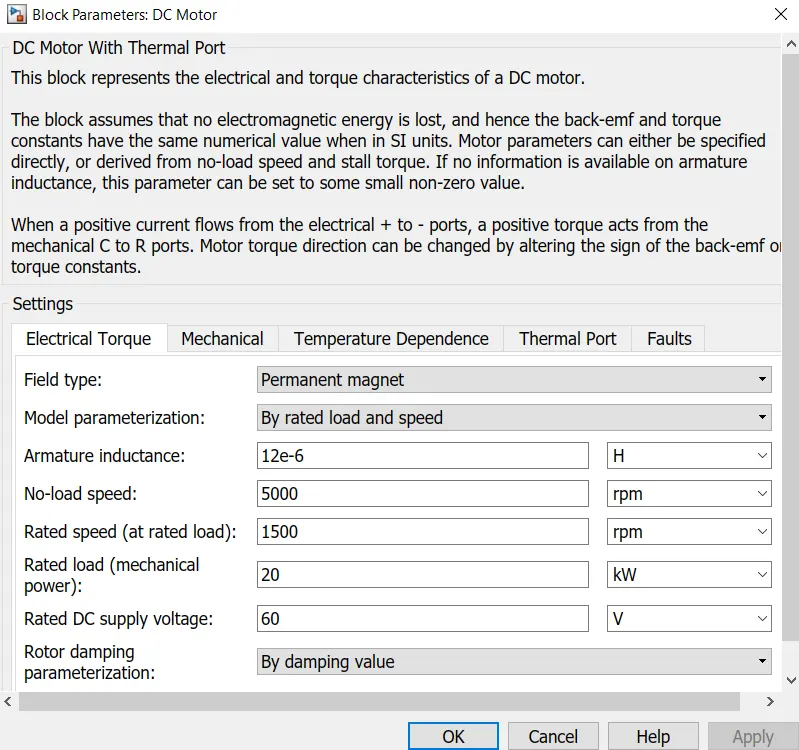
When a positive current flows from the electrical + to - ports, a positive torque applies from the mechanical C to R ports. To change the direction of the motor torque, the sign of the back-emf or torque constants can be changed. It accepts the motor controller's input command and transfers it to the transmission system.The rated supply voltage is set for 60V and with a rated load of 20kW.The no load speed is given as 5000rpm and the initial temperature of the thermal port is set to 25 degC.When the braking condition occurs the motor will act as a generator and employs regenerative braking.Then the motor is connected to a simple gear system with gear ratio of 2.
Gear box
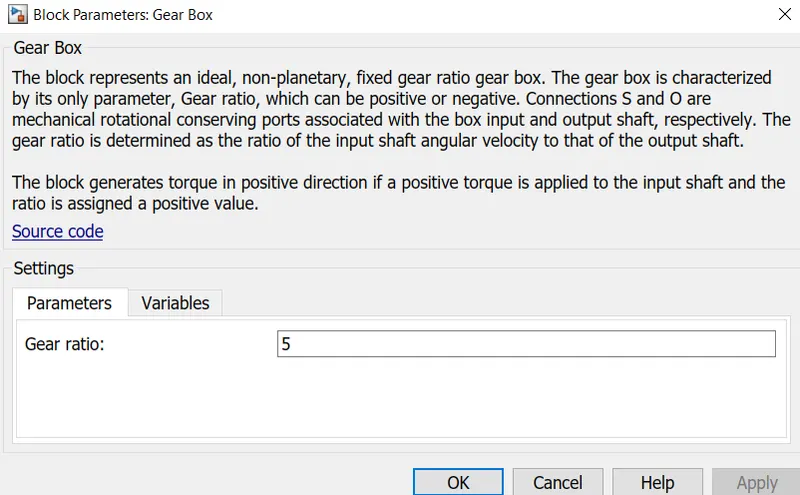
The purpose of a gearbox is to increase or reduce speed. As a result, torque output will be the inverse of the speed function. If the enclosed drive is a speed reducer (speed output is less than speed input), the torque output will increase; if the drive increases speed, the torque output will decrease.
Temperature sensor
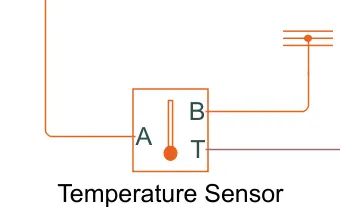
When the rickshaw is running, it is utilised to detect the temperature of the motor. To replicate the impacts of copper resistance losses that convert electrical power to heat, use the thermal ports. Use the thermal ports to replicate the effects of copper resistance losses in converting electrical power to heat, and then use the sensor to measure the amount of heat created.
Vehicle dynamics subsystem
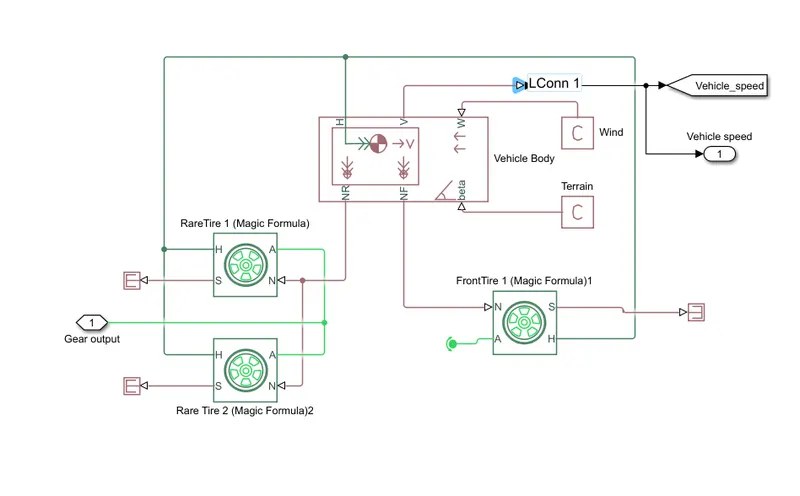
In this system we have three wheels and the power is given to rear axle wheels and the front wheel is independent.The wind and the grade value is given as physical constant.
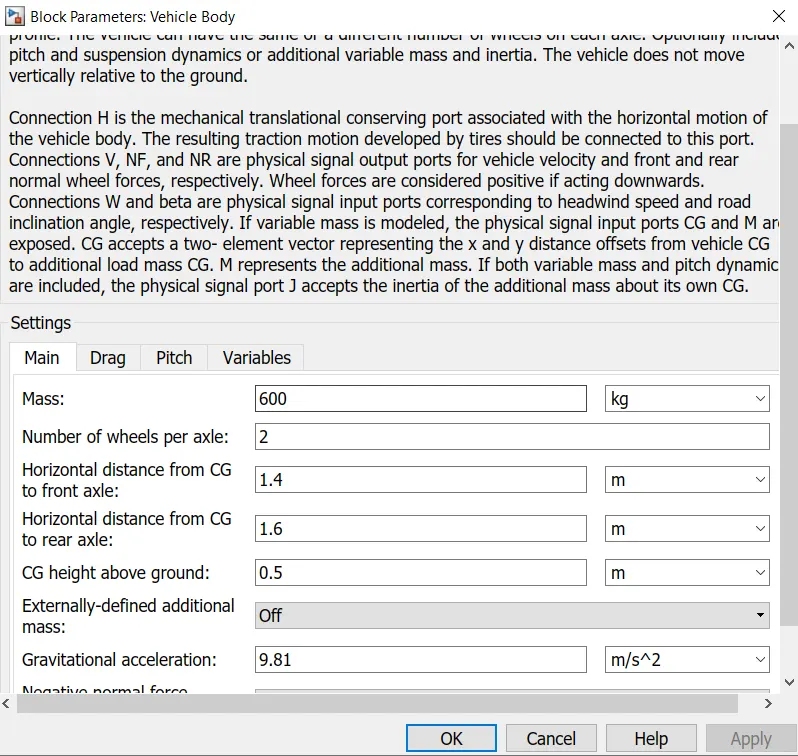
In here the mass of the vehicle is taken as 600kg,and we have only one axle and 2 wheels are attached to it in the rear side of the vehicle.And as for the vehicle the frontal area is less and taken as 1.5 and the drag is taken as 0.5.and the pitch is set as off condition.
Tires: Because we're creating a three-wheeled EV, we'll need four of these tyres, with H standing for the hub, S for tyre slip, N for normal force, and A for axle connection.
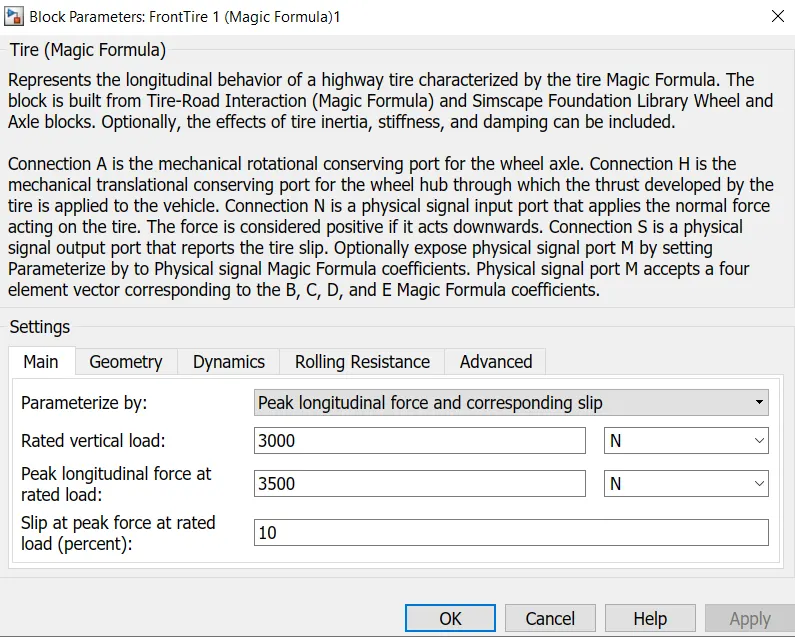
A uni-axle vehicle body in longitudinal motion is represented by the Vehicle Body block. Each axle of the vehicle can have the same number of wheels or a different number of wheels. Due to acceleration and road profile, the block accounts for body mass, aerodynamic drag, road gradient, and weight distribution between axles.The wind and the beta are connected to physical constants.
Battery-
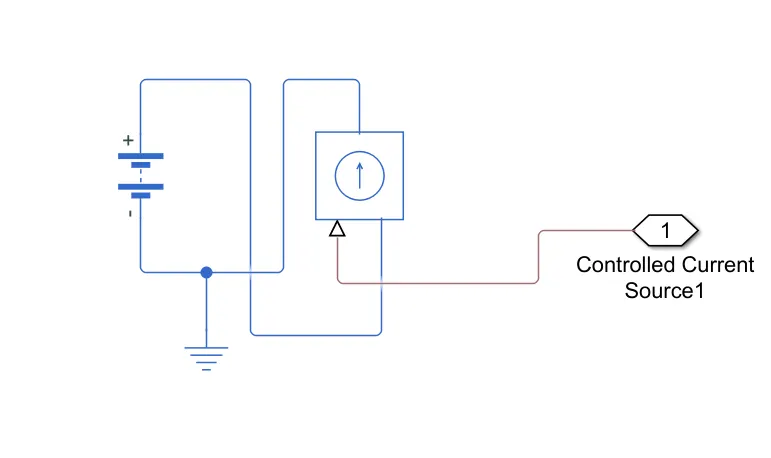
The controller and motor are both powered by the battery. To achieve maximum speed, the controller employs battery power to produce the input delivered by the motor. Every electrical component in the car is also powered by the battery.The nominal voltage is given as same as in the controller ie 60V,and with internal resistance of 2 Ohm.The current is passed through controlled current source.The Battery block creates a generic dynamic model that represents the most common rechargeable battery types.
Controlled Current source-
The Simulink input signal is converted into an analogous current source via the Controlled Current Source block. The generated current is driven by the block's input signal. The arrow in the block icon indicates the positive current direction.
The Controlled Current Source block can be initialised with a specific AC or DC current. If we want the simulation to start in steady state, we must connect the block input to a signal that starts as a sinusoidal or DC waveform corresponding to the initial values.
SoC block-
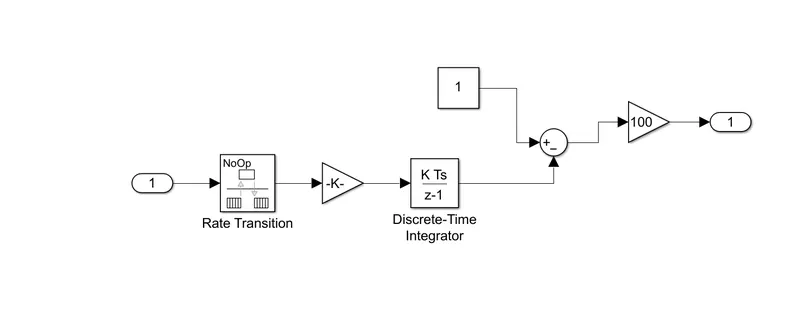
For analysing the energy consumption, SoC for the battery pack is the equivalent of a fuel gauge. It is important to mention that state of charge, presented as a gauge or percentual value at any vehicle dashboard, especially in plug-in hybrid vehicles, may not be representative for a real level of charge. In that particular case, some noticeable amount of energy stored in the electric battery is not shown at the dashboard, and it is reserved for hybrid-work operations. It permits a vehicle to accelerate with electric motors mainly using battery energy, while engine serves as a generator is used to recharge the battery to the minimum level needed for such operation.We have used rate transition block and the discrete time integrator block with gain block for the calculation of the SoC.
For distance calculation ,We have used integrator block and product block with a value of 1000 where the speed is given in m/s and for converting it to km we have to divide by 1000,and the speed is displayed.
Drive cycle source-
We have used three different drive cycle source block for the input speed given to the system. FTP75 drive cycle WOT cylce and a constant speed of 45kmph for a distance of 100km.
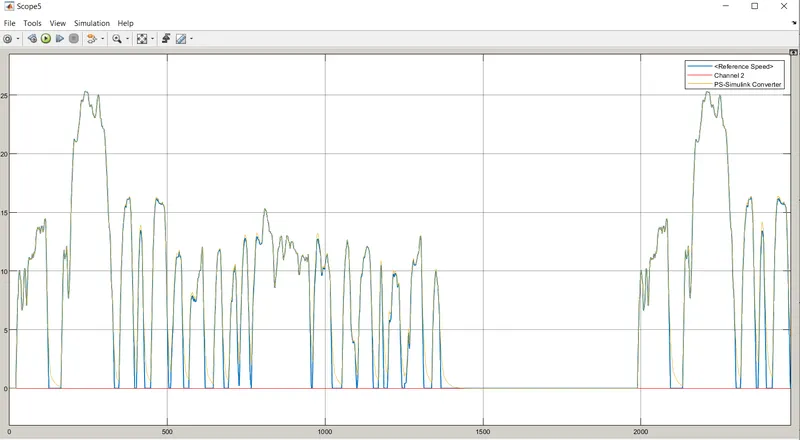
The FTP75 drive cycle is a mandated dynamometer test on tailpipe emissions of an automobile that replicates city driving circumstances, derived from the Urban Dynamometer Driving Schedule.The simulation is done for a simulation time of 2474 seconds
We can see the scope of the drive cycle and the input speed of the vehicle below
We have to analyse the temperature changes that is affecting the motor and controller for this given cycle
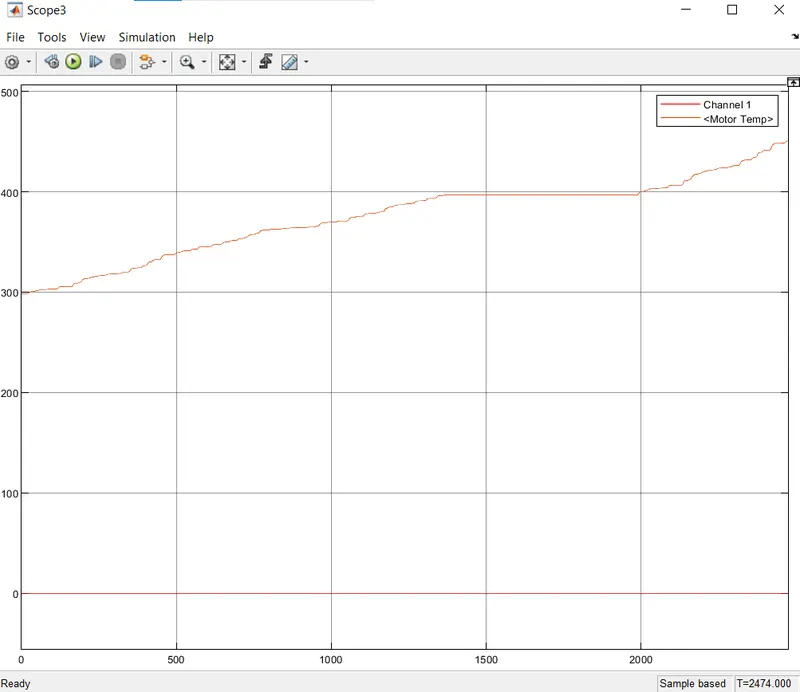
As the initial temperature is set to 303K as the motor starts working the temperature rises from 303 K to 400 K as it reaches at 1500 and after it goes with a constant value upto 2000 and we can see the variation is not rapid it slowly reaches the value of 400K and after 2000 it reaches upto a value of nearly to 450K at the end of the drive cycle.

For the controller it maintains the same value of temperature through out the drive cycle with the initial temperature of 300K the work load of the controller is less compared to the motor.
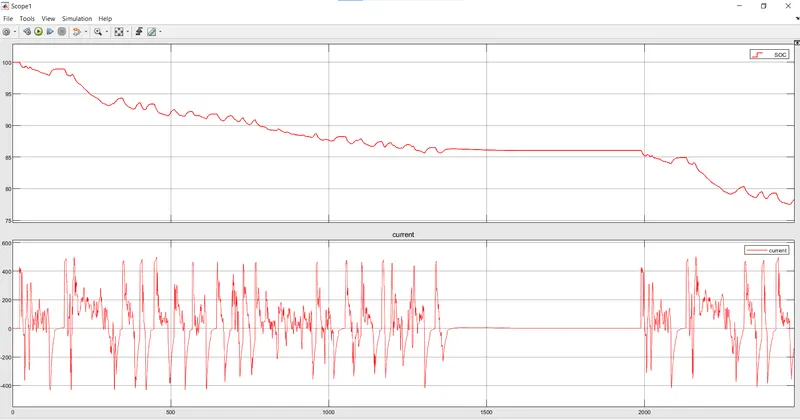
We can see the SoC value as the operation starts it is reduced gradually from the value of 100 and in a regular fashion to 85 and then it takes upon a constant trend from 1500 to 2000 and after that the consumption is again increasing reduced down to a value of 78 at the end of the drive cycle.For the current it shows a cycle where it fluctuates from -400 to 400 and it continues upto 1500 and regains from 2000 to the end of the cycle.The distance travelled for this cycle is approx 18km.
Wide open throttle cycle-
The fully opened state of a throttle on an engine is known as wide open throttle or wide-open throttle (WOT) (internal combustion engine or steam engine). By extension, the word usually refers to the highest speed at which the engine can run, as a result of a completely opened throttle plate/butterfly valve. This is the highest amount of air and fuel intake that happens when the throttle plates inside the carburetor or throttle body are "wide open" in an internal combustion engine (fully opened up).We are testing this cycle for a time of 60 seconds
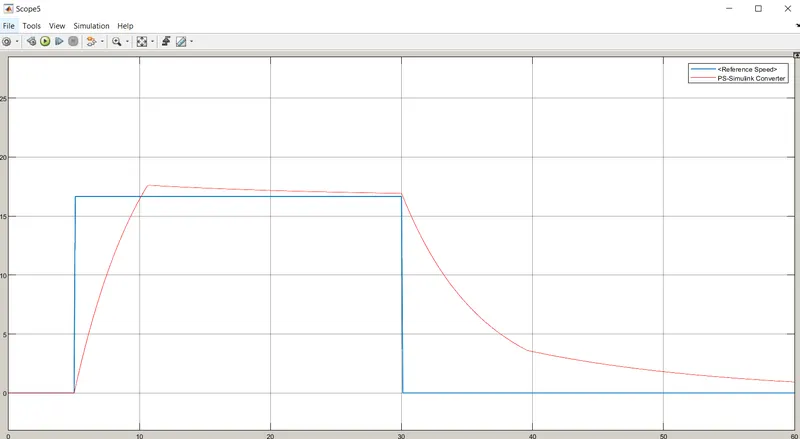
In the graph we can see the input speed and the feedback from the vehicle,there will a change when it is practically done ,the graph takes a sudden rise from 5 seconds to a value of 18 and goes constant upto a value of 30s and goes down by a curve to zero.
Lets take the motor temp and controller temperature graph,
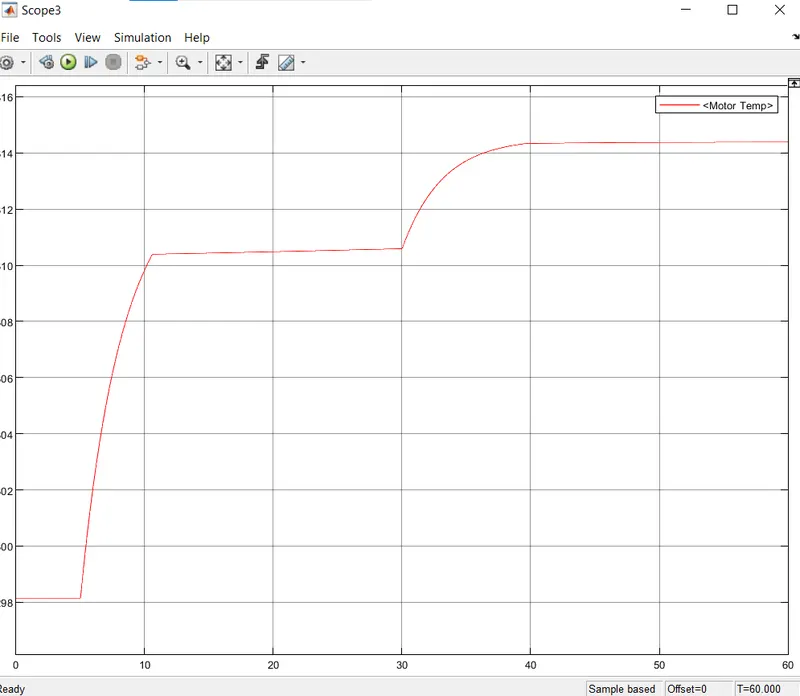
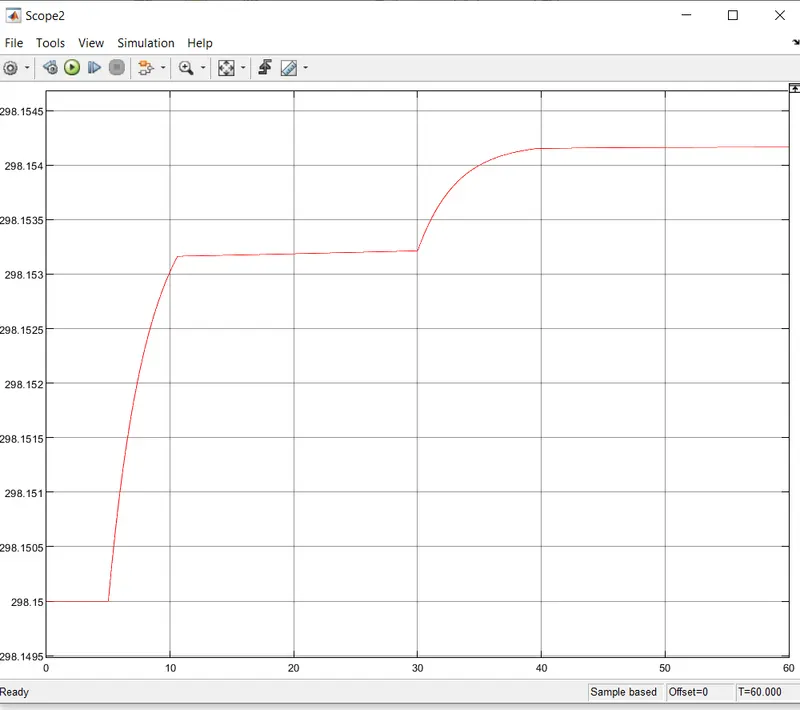
For motor we have the intial temp of 298.15K, it have sudden rise from value of 5 to a temperature of 312K upto 10s and showing a constant trend to 30 s and gradually rise in a curve fashion to a value of 315K and continues till the end.For the controller .For the controller the temperature graph is very similar to the motor temperature graph,it only changes in decimal values from 298K as shown below,there is a sudden rise after it goes constant for a little time span and again increases in a curve fashion and ends in constant value.
For SoC battery consumption can be analysed from below,
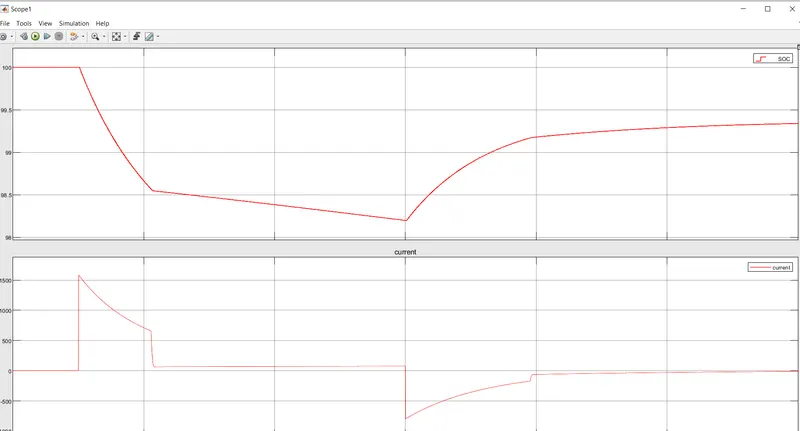
We can see the graph goes down from 100 to a value of 98.5 ,and it goes up from avalue of 98 to 99.5 in a curve fashion,goes to the end with the same value.For current it fluctuates from -500 to 1500 it varies with a sudden leap to 1500 and decreases in a curvly fashion to 600 and goes constantly and same trend is seen as it goes negative and comes upto to a constant value.The effect of degenerative braking in this graph.
For the third condition where the vehicle goes for 100km with a constant speed of 45kmph,We have create the signal from a signal builder block
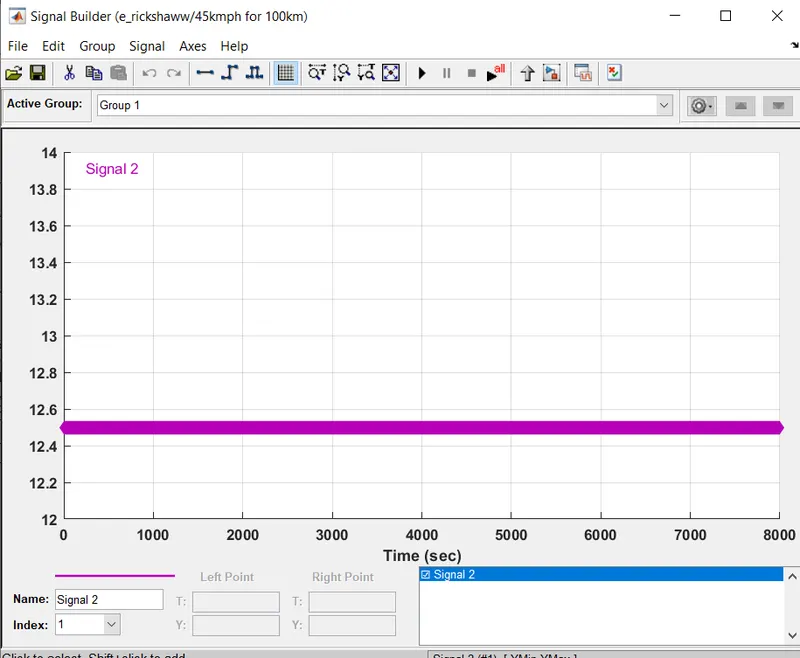
For 45km by converting it to ms it will be 12.5m/s for 100km and by doing the calculation the simulation should have the time of 8003s for getting the correct value.
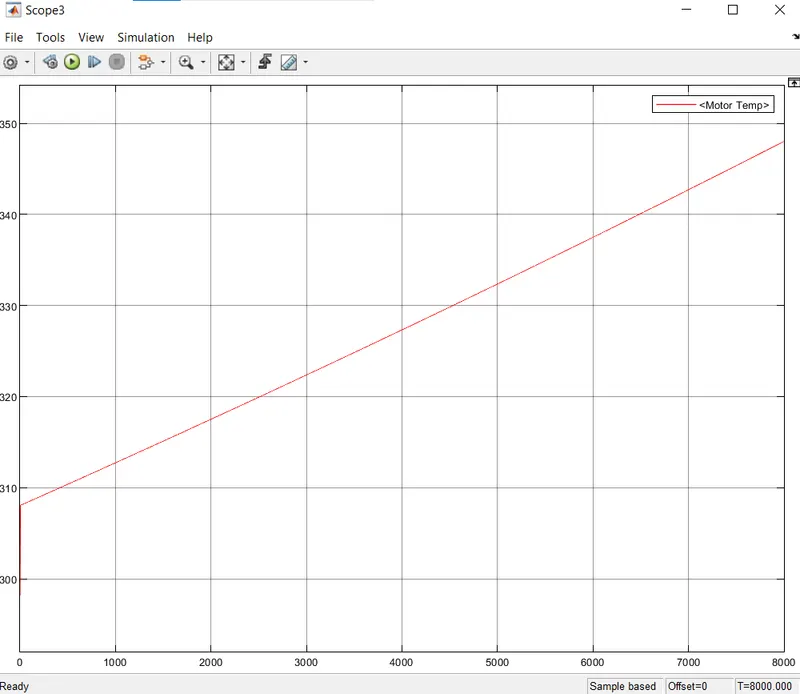
Analysing the temperature graph,At the initial condition it rises up linearly from a value of 308K to a value 348K in the time upto the end of the simulation ie 8000s.So the motor temp will depends on time of the operation even the speed is kept constant.it is seen that the motor temp rises linearly.
For controller the temperature value changes from nearly from 298K to 299K ,the rise in temperature is very less compared to the motor temperature.
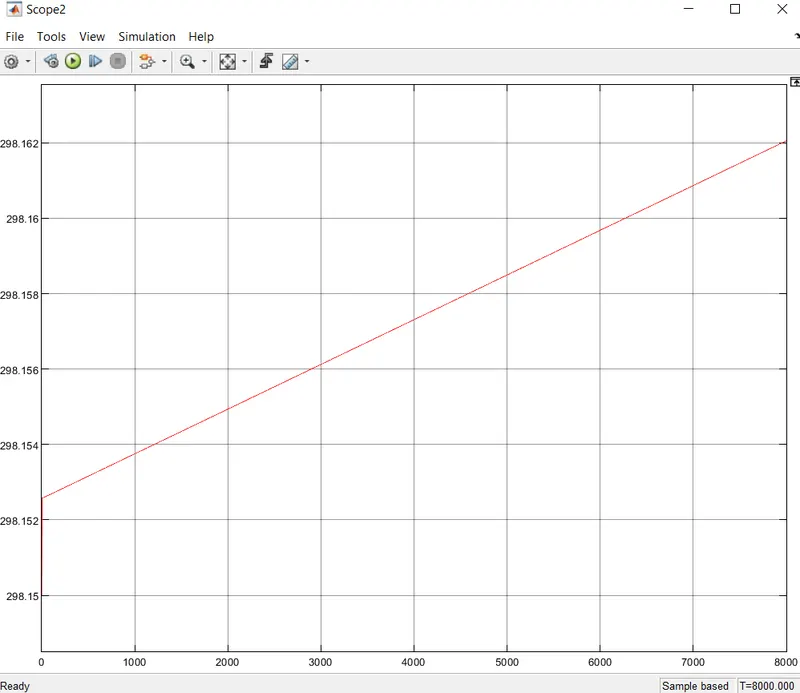
In the energy consumption graph we can see,
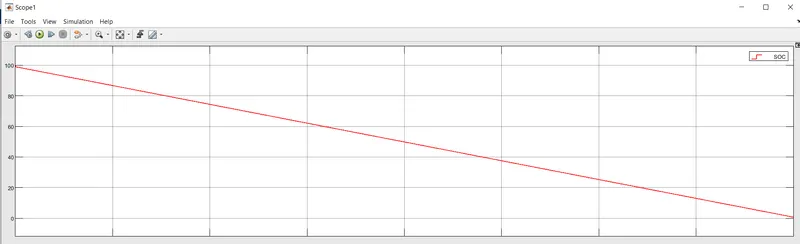
The SoC level decreases wrt time and it goes in a downward fashion where the battery is completely reduced to no value .So it exceeds the range of the vehicle it can maximum cover the distance of 100km.
Conclusion-
We have created the rickshaw model wrt the condition specified,and with three different drive cycle source the vehicle system is tested and the results were analysed.So the battery should have the optimum capacity to deliver the expected distance.And the temperature depends on the how much load is given to the vehicle and the driving condition of the system.So the motor and controller should be selected which can deliver maximum efficiency.So the e-rickshaw can be a good choice for short distance travel.